2019
Publication Year
2020-12-11T15:58:21Z
Acceptance in OA@INAF
AGILE and blazars: the unexpected, the unprecedented, and the uncut
Title
VERCELLONE, STEFANO
Authors
10.1007/s12210-019-00818-4
DOI
http://hdl.handle.net/20.500.12386/28804
Handle
RENDICONTI LINCEI. SCIENZE FISICHE E NATURALI
Journal
30
AGILE and Blazars: the Unexpected , the
Unprecedented , and the Uncut
Stefano Vercellone
Received: date / Accepted: date
Abstract AGILE has been coordinating multi-wavelength campaigns on ac-tive galactic nuclei with several major observing facilities since its launch in 2007. This effort allowed us to investigate some remarkable sources both on short and on long time-scales, deriving information on the physical mechanisms responsible for the emission in different energy bands. A complete review of the whole set of AGILE results on extra-galactic sources and their theoretical interpretation is well beyond the scope of this paper, therefore I will present an overview on an handful of outstanding objects and describe the most recent observations.
Keywords gamma rays: observations · blazars · jetted sources
1 Introduction
Multi-wavelength studies of γ-ray active galactic nuclei (AGNs) date back to the ’80s and ’90s, with both COS-B and CGRO-EGRET observatories, estab-lishing blazars as a class of γ-ray emitters. For a few sources, it was possible to study both the properties of the spectral energy distributions (SEDs) dur-ing different γ-ray states, and the search for correlated variability at different bands (e.g., 3C 279 [1,2]).
The launches of the AGILE and Fermi γ-ray satellites allowed a tremen-dous improvement in the multi-wavelength monitoring of blazars in the γ-ray energy band, thanks to their wide field of view, all-sky scanning pointing model, and fast quick-look analysis pipelines.
The broad band spectral energy distribution (SED) of blazars displays two broad “humps”, as shown in Figure 1.
S. Vercellone
INAF–OA Brera, Via E. Bianchi 46, I-23807 Merate (LC), Italy E-mail: [email protected]
2 Stefano Vercellone
10
1010
1510
2010
25Frequency [Hz]
10
-1210
-1110
-1010
-910
-8ν
F(
ν
) [erg cm
-2s
-1]
Pre-Flare (2010 Nov.) Flare (2010 Nov.) Post-flare (2010 Nov.)Low state (2008 Fall)
Fig. 1 Spectral energy distribution of the flat-spectrum radio quasar 3C 454.3 accumulated
during the 2010 November flare (in colors, data from [3]) compared with a SED accumulated during a particularly low γ-ray state in Fall 2008 (in black, data from [4]).
Blazars emit across several decades of energy, from the radio to the TeV energy band. Their spectral energy distributions (SEDs) are typically double humped, as shown in Figure 1. The first peak occours in the infra-red/optical band in the flat-spectrum radio quasars (FSRQs) and at UV/X-rays in the high-energy peaked BL Lac (HBLs) sources, and it is commonly interpreted as synchrotron radiation from high-energy electrons in a relativistic jet. The sec-ond SED component, which peaks at MeV–GeV (FSRQs) and at TeV (HBLs) energies is commonly interpreted as inverse Compton (IC) scattering of soft seed photons by relativistic electrons. A comprehensive review of the different leptonic emission models in blazars is provided in [5]. Alternatively, hadronic scenarios interpret the high-energy bump (or its high-energy part) as the by-product of electromagnetic cascades initiated by high-energy protons or as their synchrotron emission (see [6] for a recent review).
A mandatory ingredient in order to investigate SEDs of different blazars is the set-up of almost simultaneous multi-wavelength observing campaigns. The
the physical mechanisms responsible for the emission at different wavelengths and possibly the location of the γ-ray emission region. For this reason, fast reaction to flare alerts are of paramount importance, as discussed in [7] for the AGILE Alert System.
2 Old Friends
Among the so-called “old friends” we can certainly include three very famous objects, 3C 454.3 (also dubbed as the uncut Crazy Diamond), MRK 421 (the unprecedentedsource, because of a spectacular flare), and PKS 1830−211 (the unexpectedone, because of its lensed properties).
3C 454.3
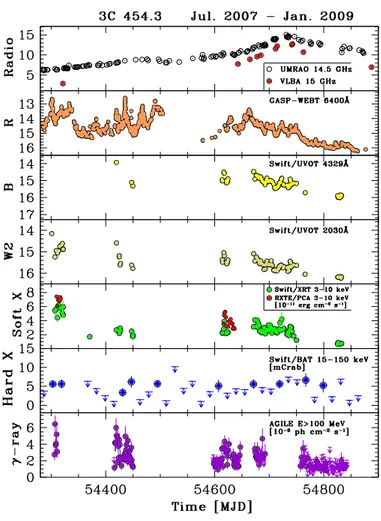
It is a well known flat-spectrum radio quasar (z = 0.859) with a clear signature of the accretion disc in low states and it is the first blazar detected in a flaring state by AGILE in 2007; in the following years, it also became the most intense γ-ray source detected by AGILE above 100 MeV. AGILE initiated several multi-wavelength campaigns on 3C 454.3, which allowed us both to study the different SEDs and to discuss innovative flaring models to account for different flaring activity periods. A long-term observing campaign [4] was performed between July 2007 and October 2009 during which we observed fast γ-ray variability (tγ
var≤1 d) with almost no time-lag with respect to the the optical
one. Figure 2 shows the long-term multi-wavelength light-curves where we can see how the radio band behave differently from the higher frequencies bands. Thanks to this long time-scale multi-wavelength coverage, we were able to find a slow, almost constant increase of the 15 GHz flux with no correlation with other wavebands. This different behaviour of the light curves at different wavelengths could be interpreted in terms of a changing of the jet geometry between 2007 and 2008.
On the other hand, as shown in Figure 3, the γ-ray flare that occurred on 2010 November 20 [3] showed some peculiar behaviours, among which a γ-ray orphan optical flare which may challenge the model of a uniform external photon field responsible for the high-energy emission.
MRK 421
This source is a nearby (z = 0.031) high-synchrotron peaked BL Lac object, and one of the most investigated AGN at all frequencies, from the radio band up to several tens of TeV [8]. This extensive coverage allowed to in-vestigate both leptonic and hadronic scenarios to fit the observed data. On 2008 June 10 Super-AGILE detected a strong flare (30 mCrab, 20–60 keV), reaching 55 mCrab in a few days. The AGILE γ-ray imaging detector de-tected an average flux of about 40 × 10−8 ph cm−2s−1 above 100 MeV and
immediately triggered a multi-wavelength campaign involving Swift, RXTE, the GASP-WEBT and for the first time a joint collaboration between MAGIC and VERITAS Cherenkov arrays, resulting in an extraordinary set of almost
4 Stefano Vercellone
Fig. 2 3C 454.3 light curves at different energies, covering about 18 months of monitoring.
Figure from [4].
simultaneous data, covering a 12-decade spectral range [9]. We were able to obtain SEDs for two different time-periods. The γ-ray emission detected by AGILE during the second period and the TeV emission detected during first one can be modelled on the characteristics of the corresponding synchrotron peaks. We showed that the γ-ray flare can be interpreted within the frame-work of the synchrotron self-Compton model in terms of a rapid acceleration of leptons in the jet.
PKS 1830−211
Fig. 3 From top to bottom: AGILE (E > 100 MeV), Swift/XRT (2–10 keV), Swift/UVOT (w1, m2, w2), and GASP-WEBT (R) light-curves obtained during the 2010 November flare. Data from [3].
with a rather soft γ-ray spectrum (photon index Γ = 2.56). It is also classified as a possible “MeV blazar”, since the inverse-Compton peak lies at energies E ≤ 100 MeV. AGILE detected a prolonged γ-ray activity between 2010 October 8 and November 8, with a flux peak on October 14 [10]. The resulting γ-ray photon index during the 4-day flaring period turned out to be Γ = 2.4 ± 0.3. This event immediately triggered a multi-wavelength campaign including Swift and SMARTS. INTEGRAL data were used to investigate the steady-state phase. The observing campaign showed a lack of correlated variability between the low (NIR–optical bands, X-rays) and high (γ-ray ) energy portions
6 Stefano Vercellone 1010 1015 1020 1025 Frequency [Hz] 10-13 10-12 10-11 10-10 10-9 ν F( ν ) [erg cm -2 s -1 ]
Fig. 4 Spectral energy distribution for the two AGILE flares. Orange symbols refer to the
AGILE data first flare and black symbols to the second. The blue lines represent the over-all F2 SED fit (solid line) and each component, namely the synchrotron emission (dashed line), the black-body approximation to the disc emission (dotted line), the synchrotron self-Compton emission (SSC, dash-dotted line), the external Compton emission off the disc (dash-triple-dot line), and the external Compton emission off the broad-line region (long-dashed line). The light grey solid and dotted lines represent the torus and the external Comp-ton emission off the torus phoComp-tons, respectively. The red curve represents the e-ASTROGAM sensitivity for an integration time of 6 days (comparable to the AGILE integration time for the spectral analysis). Adapted from [11].
of the SEDs, disfavouring the one-zone leptonic model for this event. The chromatic variation disfavours macro-lensing (since it does not depend on λ), while the micro-lensing from stars in the lensing galaxy may cause the observed γ-ray variability.
3 New Companions
During the recent years, AGILE detected several flares from different AGNs, such as 4C+71.07, 3C 279, and PKS 2023−07.
4C+71.07
This source is a high-redshift (z = 2.172) γ-ray loud blazar whose optical emission is dominated by a strong bump peaking at about 1014.9Hz, which is
Figure 4 shows the SED accumulated during two flares detected by AG-ILE between 2015-10-26 – 2015-11-01 (F1) and 2015-11-07 – 2015-11-13 (F2), respectively. The observed flare F2 can be interpreted in the framework of the one-zone leptonic model, with a dissipation region placed within the broad-line region and a jet power of the order of Pjet≈4 × 1047erg s−1. This class
of high-redshift FSRQs with a Compton-dominance reaching values up to 100 might be excellent targets for future γ-ray missions as e-ASTROGAM. 3C 279
It is one of the most studied blazars in the sky, with variability time-scale as short as a few (3–5) minutes above 100 MeV which may challenge current emission models. AGILE detected this source during the early operation phase in July 2007 [12] and more recently in June 2015 [13]. Figure 5 shows that during this last flare, the γ-ray flux rose by a factor of ≈ 4 in half a day, while the optical counterpart only by a factor of ≈ 2 on a similar time-scale. This behaviour challenges simple one-zone emission models, suggesting alternative explanations such as the mirror-driven models [14].
0 10 20 30 Flux [x10 -6 ph/cm 2/s] AGILE-GRID: 1-day AGILE-GRID: 12 hrs 0 10 20 30 Flux [x10 -6 ph/cm
2/s] FERMI-LAT: 10ks (this work)
FERMI-LAT: 5.7ks (ApJ 824) 0 2 4 6 8 10 12 F(0.3-10 keV) [x10 -11 erg/cm 2/s] Swift-XRT 2.0 2.5 3.0 3.5 4.0 4.5 5.0 F [mJy] GASP-WEBT (R band) 5 10 15 20 25 30 35 P [%] 184 186 188 190 TIME (MJD - 57000) 10 20 30 40 50 EVPA [deg]
Fig. 5 Multi-wavelength light curves of 3C 279 in June 2015:γ-rays (E > 100 MeV) as
ob-served by AGILE-GRID and Fermi-LAT, the Swift-XRT X-ray follow-up and simultaneous GASP-WEBT photometric and polarimetric optical data. From [13].
8 Stefano Vercellone
PKS 2023−07
It is a FSRQ at an intermediate distance (z = 1.388) and AGILE detected quite a strong flare in April 2016 [15]. This object helped us in investigating one of the most interesting open points in blazar astrophysics, the location of the dissipation region where the γ-ray emission is produced. Because of the strong photon field of the broad-line region, FSRQs can suffer strong absorption above E = 25/(1 + z) GeV due to γ-γ interaction if the emitting region is close to the super-massive black hole, causing a cut-off in the high-energy portion of the spectrum. We found that, during the peak emission, the most energetic photon had an energy of ≈ 40 GeV. This suggests a possible interpretation of the broadband SED (see Figure 6) in terms of leptonic models for blazar jet, provided that the γ-ray emission site is beyond the broad-line region, at about 7 pc far from the central black hole.
Fig. 6 Spectral energy distribution for the brightest flare of PKS 2023−07 in April 2016.
From [15].
4 Conclusions
This very short compilation of AGILE results on blazars (calling it a review would be pretentious) would not be complete without reporting some recent important results. The first one is the confirmation of the ≈ 2.2 yr periodicity
The second interesting result deals with the possible identification of extra-galactic counterparts of IceCube neutrino events. In [17] we discuss the AGILE candidate of a γ-ray possible precursor to the IceCube-160731 neutrino event, while in [18] we report on the AGILE confirmation of γ-ray activity from the IceCube-170922A error region, expanding the AGILE investigation on electro-magnetic counterparts of non-photons transients.
Acknowledgements The author acknowledges the AGILE Team and the colleagues of the
many observing facilities who still make it possible to achieve these extraordinary results.
Funding: The author acknowledges financial contribution from the grant ASI I/028/12/0
and from the agreement ASI-INAF n.2017-14-H.0.
Conflict of Interest: The author declares that he has no conflict of interest.
References
1. Hartman, R. C., et al., Multiepoch Multiwavelength Spectra and Models for Blazar
3C 279, ApJ, 553, 683 (2001)
2. Hartman, R. C., et al., Day-Scale Variability of 3C 279 and Searches for Correlations
in Gamma-Ray, X-Ray, and Optical Bands, ApJ, 558, 583 (2001)
3. Vercellone, S., et al., The Brightest γ-Ray Flaring Blazar in the Sky: AGILE and
Multi-wavelength Observations of 3C 454.3 During 2010 November , ApJL, 736, L38 (2011)
4. Vercellone, S., et al., Multiwavelength Observations of 3C 454.3. III. Eighteen Months
of Agile Monitoring of the “Crazy Diamond”, ApJ, 712, 405 (2010)
5. Ghisellini, G., et al., The Fermi blazar sequence, MNRAS, 469, 255 (2017)
6. Zech, A., Cerruti, M., Mazin, D., Expected signatures from hadronic emission processes
in the TeV spectra of BL Lacertae objects, A&A, 602, A25 (2017)
7. Bulgarelli A., et al., The AGILE Alert System for γ-Ray Transients, ApJ, 781, 19 (2014) 8. Abeysekara, A. U., et al., Daily Monitoring of TeV Gamma-Ray Emission from Mrk 421,
Mrk 501, and the Crab Nebula with HAWC, ApJ, 841, 100 (2017)
9. Donnarumma, I., et al., The June 2008 Flare of Markarian 421 from Optical to TeV
Energies, ApJL, 691, L13 (2009)
10. Donnarumma, I., et al., ApJL, The Remarkable γ-Ray Activity in the Gravitationally
Lensed Blazar PKS 1830−211, 736, L30 (2011)
11. Vercellone, S., et al., AGILE, Fermi, Swift, and GASP/WEBT multi-wavelength
ob-servations of the high-redshift blazar 4C +71.07 in outburst, A&A, 621, A82 (2019)
12. Giuliani, A., et al., AGILE observation of a gamma-ray flare from the blazar 3C 279, A&A, 494, 509 (2009)
13. Pittori, C., et al., The Bright γ-ray Flare of 3C 279 in 2015 June: AGILE Detection
and Multifrequency Follow-up Observations, ApJ, 856, 99 (2018)
14. Vittorini, V., et al., Meeting the Challenge from Bright and Fast Gamma-Ray Flares
of 3C 279, ApJ, 843, L23 (2017)
15. Piano, G., et., al., The mid-2016 flaring activity of the flat spectrum radio quasar
PKS 2023−07, A&A, 616, A65 (2018)
16. Tavani, M., et al., The Blazar PG 1553+113 as a Binary System of Supermassive Black
Holes, ApJ, 854, 11 (2018)
17. Lucarelli, F., et al., AGILE Detection of a Candidate Gamma-Ray Precursor to the
IceCube−160731 Neutrino Event, ApJ, 846, 121 (2017)
18. Lucarelli et al., AGILE confirmation of gamma-ray activity from the IceCube−170922A
![Fig. 1 Spectral energy distribution of the flat-spectrum radio quasar 3C 454.3 accumulated during the 2010 November flare (in colors, data from [3]) compared with a SED accumulated during a particularly low γ-ray state in Fall 2008 (in black, data from [4]](https://thumb-eu.123doks.com/thumbv2/123dokorg/8096731.124795/3.892.124.603.145.589/spectral-distribution-spectrum-accumulated-november-compared-accumulated-particularly.webp)