Spatial confinement induces hairpins in nicked
circular DNA
Aleksandre Japaridze
1, Enzo Orlandini
2, Kathleen Beth Smith
1, Lucas Gm ¨ur
1,
Francesco Valle
3, Cristian Micheletti
4and Giovanni Dietler
1,*1Laboratory of Physics of Living Matter, EPFL, 1015 Lausanne, Switzerland,2Dipartimento di Fisica e Astronomia
and Sezione INFN, Universita di Padova, Via Marzolo 8, 35131 Padova, Italy,3Consiglio Nazionale delle Ricerche
(CNR), Istituto per lo Studio dei Materiali Nanostrutturati (ISMN), Via P.Gobetti 101, Bologna 40129, Italy and4SISSA
- Scuola Internazionale Superiore di Studi Avanzati and CNR-IOM Democritos, Via Bonomea 265, 34136 Trieste, Italy
Received December 12, 2016; Revised January 25, 2017; Editorial Decision February 01, 2017; Accepted February 06, 2017
ABSTRACT
In living cells, DNA is highly confined in space with the help of condensing agents, DNA binding proteins and high levels of supercoiling. Due to challenges associated with experimentally studying DNA under confinement, little is known about the impact of spa-tial confinement on the local structure of the DNA. Here, we have used well characterized slits of differ-ent sizes to collect high resolution atomic force mi-croscopy images of confined circular DNA with the aim of assessing the impact of the spatial confine-ment on global and local conformational properties of DNA. Our findings, supported by numerical sim-ulations, indicate that confinement imposes a large mechanical stress on the DNA as evidenced by a pro-nounced anisotropy and tangent–tangent correlation function with respect to non-constrained DNA. For the strongest confinement we observed nanometer sized hairpins and interwound structures associated with the nicked sites in the DNA sequence. Based on these findings, we propose that spatial DNA
confine-mentin vivocan promote the formation of localized
defects at mechanically weak sites that could be co-opted for biological regulatory functions.
INTRODUCTION
Characterizing the properties of DNA in spatial confine-ment is one of the open challenges both for theory and experiment (1–12). The increasing interest for such prob-lem arises because of its relevance for all living organ-isms, whose genetic material is always subject to a high degree of compaction (13,14) as well as its technological
implications based on nanoslits (15–18), nanopores (19– 23) and nanochannels (4,6,10,11,18,20). These confining devices open new perspectives for harnessing the physical behaviour of confined DNA in various setups (e.g. micro-fuidics) for sorting molecules according to their length (24), topology (5,22,23) and even for barcoding profiling (25,26). One standing challenge is how to measure in detail the ef-fects of spatial confinement on DNA properties. Almost all available probing techniques are based on optical measure-ments, where one can access only overall and low resolution properties of molecules (1–6,27). Here, we present a novel experimental method for studying DNA with nanometer resolution under quasi-1D confinement that is not based on optical measurements. We combined the capability of atomic force microscopy (AFM) to provide high-resolution images with a microfluidics device of a very well defined geometry and dimension (Figure1). We studied !m-long DNA rings from 2.7 up to 8.4 kb and adsorbed them in-side an array of rectangular slits of various sizes resting on a mica surface.
Here, to characterize the conformational properties of DNA under confinement, we profile various metric prop-erties, including the complete tangent-tangent correlation function and the chain asphericity, a parameter describing how close the DNA molecule is to an ideal circle. The mea-surements for DNA inside large slits, which we complement by numerical simulations as well, closely follow the behav-ior expected theoretically for equivalent model DNA chains in equilibrium on an attractive surface in the presence of mild lateral confinement (2D case)(28). This clarifies that the considered experimental setup offers a practical means of realizing quasi-1D slit confinement in equilibrium and can hence be exploited for practical purposes. For molecules translocated inside narrower slits, instead, we find that the agreement with theoretical expectations for 2D
conforma-*To whom correspondence should be addressed. Tel: +41 21 693 04 46; Fax: +41 21 693 04 22; Email: [email protected]
Present addresses:
Aleksandre Japaridze, Department of Bionanoscience, Kavli Institute of Nanoscience, Delft University of Technology, Van der Maasweg 9, 2629 HZ Delft, The Netherlands.
Kathleen Smith, Food and Soft Materials Science, Institute of Food, Nutrition and Health, ETH Zurich, Schmelzbergstrasse 9, CH-8092 Zurich, Switzerland. C
⃝The Author(s) 2017. Published by Oxford University Press on behalf of Nucleic Acids Research.
This is an Open Access article distributed under the terms of the Creative Commons Attribution License (http://creativecommons.org/licenses/by-nc/4.0/), which permits non-commercial re-use, distribution, and reproduction in any medium, provided the original work is properly cited. For commercial re-use, please contact [email protected]
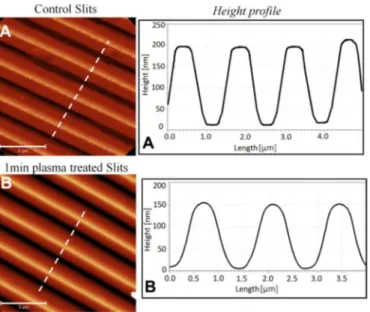
Figure 1. AFM phase image of (A) untreated small slits and (B) small slits
treated with 1 min of plasma stream. (A and B) Height cross-section along the white dotted lines on (A) and (B) respectively. 2 !m scale bar.
tion is systematically offset. In fact, DNA has a larger than expected asphericity and the tangent-tangent correlation function has a more pronounced anti-correlation at half the total length of the circular DNA. Moreover, the tailed analysis of the conformations reveals that these de-viations are in part due to the occurrence of relatively ex-tended defects in the form of hairpins and interwound seg-ments at the nicked sites, which involve up to 15% of the total DNA length. These structural defects were only ob-served for confined nicked DNA and not for controls, e.g. nicked DNA outside the slits or within giant slits, and non-nicked molecules trapped inside small slits.
Detection and correct repair of single stranded breaks in the genome is crucially important for the genome stabil-ity (29,30), therefore we propose that confinement helps ex-pose these mechanically weak sites in the DNA sequence by forming hairpins and interwound regions, which themselves act as structural markers for different biological processes (29,31–33). In addition, we surmise that these confinement-induced hairpin defects at nicked sites could also have di-rect bearings on the in vivo processing of the genome, such as blocking or hindering transcription machinery, therefore affecting gene expression and regulation.
MATERIALS AND METHODS Circular DNA
2.7 kb (pUC19 2686 bp); 4.4 kb (pBR322 4361 bp); 5.4 kb (Fx174 5386 bp) supercoiled plasmid DNA were pur-chased from Fermentas (Switzerland). 8.4 kb DNA (pET-28a His6/mTet3, 8381 bp) was kindly provided by Dr T. Ju-rkowski. All plasmids were nicked using Nt.BstNBI nicking enzyme (NEB) and further extracted from 1.0% agarose gel and purified using extraction kit from Promega. DNA was then placed in TE buffer composed of 10 mM Tris and 1 mM EDTA solution.
For experiments performed with non-nicked DNA, nicked plasmids were first incubated with T4 ligase (NEB) for 2 h at room temperature in Ligase reaction buffer (NEB). Then ligation was stopped through passing the DNA mix through an extraction column (Promega). The circularity of molecules was chosen on purpose since all forms of prokaryote organisms contain DNA in circular, rather than its linear form (34,35).
Sample preparation
A 10 !l aliquot containing DNA (typical concentration 0.5−1.0 ng/!l) and 1.5 mM MgCl2final concentration was
deposited on one side of the slits on a freshly cleaved mica surface. The sample was then incubated in a warm moist environment for 30 min, letting the DNA diffuse into the slits. The long incubation time was chosen in order to let the molecules relax and adjust inside the slits, thus minimizing the effect of the flow on the DNA conformation. Afterward, the slits were gently removed, the surface gently rinsed twice with 1 ml Milli-Q water (18.2 M!.cm resistivity) and then blow-dried.
AFM
AFM images were collected using a MultiMode SPM with a Nanoscope III controller (Veeco Instruments, Santa Bar-bara, CA, USA) operated in tapping-mode in air. The AFM cantilevers used in air had a spring constant of 5 N·m–1
(Veeco cantilevers, TAP150A) with resonance frequencies ranging between 120 and 160 kHz. All the recorded AFM images consist of 512 × 512 pixels with scan frequency ≤1 Hz. Images were simply flattened using the Gwyddion soft-ware (36) (Version 2.25) and no further image processing was carried out.
Master fabrication
The masters used in the present work were fabricated fol-lowing two different procedures according to the lateral size of the features. The large slits master was fabricated by contact photolithography with a Mask Aligner Karl Suss MJB40 (l = 365 nm). High contrast masks were obtained by engraving a thin aluminium layer using an IR-laser printer (ScribaR, Scriba Nanotecnologie srl.). The exposure inter-val was adjusted to match the contrast of the mask. Neg-ative photoresist SU8 (MicroChem Corp, USA), was spin coated at 2000 RPM on flat polycarbonate substrate (sur-face roughness < 10 nm), resulting in a film of 5 !m thick-ness. After alignment and exposure, the master was dipped in the resist developer for 1 min to develop it and postbaked at 150◦C for 30 min to enhance crosslinking of photoresist.
During postbaking, the section of the slits becomes round shaped. This curvature improves the peel-off of the mold in replica molding. The patterned areas were always in the range of 5 mm × 5 mm.
The small slits master, consisting of an array of paral-lel slits whose width and height are 1 !m and 230 ± 15 nm, respectively, and a 1.4 !m pitch, was obtained from the polycarbonate portion of a commercially available CD-Rom. The metallic part was peeled off using scotch tape and
Table 1. Slit dimensions measured by AFM
Slits after 1 min plasma treatment
Type Small slits Giant slits
Height 140 ± 20 nm 1.5 ± 0.05 !m Width 600 ± 20 nm 10 ± 0.05 !m Separation 750 ± 20 nm 15 ± 0.05 !m
the underlying polycarbonate was rinsed with ethanol to re-move the chemicals present on its surface.
Replica molding
The microfluidics devices used to laterally confine the DNA molecules during the deposition process were fabricated by replica molding of the suitably realized masters. Poly-dimethylsiloxane (Sylgard 184) and its curing agent were mixed in ratio 10:1, degassed and poured on top of the polycarbonate/SU8 master. Curing was performed at 80◦C
for 8 h, in a standard thermostatic oven. After peel-off, the PDMS replicas were rinsed and stored in deionized water. PDMS slits
In order to clean the PDMS slits and make the surface hydrophylic, before every experiment all slits were treated with a low intensity plasma stream (Harrick basis plasma cleaner) at 500 m Tor. Duration and the intensity of the plasma stream strongly changed the initial height of the slits, therefore we kept the plasma exposure to 1 min (Fig-ure1and Supplementary Figure S1). Straight after plasma treatment the slits were placed and gently pressed with a Teflon clamp on a freshly cleaved mica surface.
The PDMS slit dimensions (measured by AFM) are given in Table1.
The effective persistence length
We measured the persistence length lp of DNA using the
bond correlation function for polymers in 2D (since the DNA adsorbed on the mica surface adopts a 2D confor-mation):
<cos(θ) >= e−s/(2lp) (1) where " is the angle between the tangent vectors to the chain at two points at arc length distance s and lp is the
persis-tence length (37). Since the persistence length of DNA was obtained by treating the rings as if they were free of defects and their mechanical properties were uniform, we denote it as the effective persistence length.
Asphericity
Typical shape measurements for circular DNA included the asphericity A2, defined as the combination of the small (Rg1)
and large (Rg2) principal axes of the radius of gyration
ten-sor Rg2(38). A2= ! "R2 g1− R2g2 #2 " R2 g1+ R2g2 #2 $ (2)
The circular DNA can be fitted with an ellipse and the ma-jor a and minor b axes lengths are given by
a = 2%2R2
g2, b = 2
% 2R2
g1
which are quantities representing more explicitly the extent of the circular DNA.
DNA Analysis software and procedures
The contour length, the radius of gyration and the bond-bond correlation function were calculated by tracing DNA molecules using the ‘DNA Trace’ analysis software that has been described elsewhere (39).
Computational methods: The model
Circular DNA molecules confined within slits, described by two impenetrable walls placed respectively at z = 0 (bottom) and z = H (top), are modelled as semiflexible self-avoiding rings of N spherical beads of diameter #. To take into ac-count the connectivity, self-avoidance and bending energy of the chain we consider respectively the three potential en-ergies UFENE, ULJ, Ubendwhose explicit parametrization are
given by UF ENE= − N−1& i 15ε'R0 σ (2 ln ) 1 −"di,i+1 R0 #2* Ubend = N−1& i=2 ε "lσp# +1 − ,→−bi−1·−→bi , ,−→bi−1,,,,,,−→bi , , , -ULJ = N & i, j>i 4ε)" σ di, j #12 −" σ di, j #6 +14 * · θ(21/6σ − di, j)
where −→bi ≡ ⃗ri+1− ⃗riis the ith chain bond, di, j = |⃗ri− ⃗rj| is
the distance of the bead centers i and j, R0= 1.5# is the
max-imum bond length and $, the characteristic unit of energy of the system is set equal to the thermal energy, kBT. Finally,
"is the Heaviside function. Note that, since we are consid-ering nicked DNA molecules, whose twist energy can relax along the chain, we do not take into account a twist po-tential energy into the model. In order to enforce the steric hindrance with the top wall of the slit placed at height H, we add the shifted Lennard–Jones (hence purely repulsive) potential energy Uwtopall= N . i 4ε /+ σ δi -12 − + σ δi -6 +14 0 · θ(21/6σ− δi)
where δi ≡ σ2 − &i and &i is the distance of the i-th bead
from the top wall. Finally, to mimic attraction on the bot-tom wall we add a full Lennard–Jones potential (i.e. repul-sive at very short distance and attractive at long distances)
Ubottom wall = N . i 4εa /+ σ ri -12 − + σ ri -60 · θ(1.5σ − ri)
where ri is the distance of the i-th bead from the bottom
wall. The wall-particle potential is shifted so that it is 0.0 at the cutoff distance.
com-Figure 2. Different steps of sample preparation. Schematic representation of: (A) the Teflon clamp where the plasma treated slits are gently pressed on the
surface of the mica, (B) the sample deposition and the zoomed image showing the translocation of circular DNA inside the slits, (C) an AFM tip scanning the mica surface, (D) a typical AFM image showing circular 2.7 kb DNA migrating into giant slits. The orientation of the slit is indicated by the dashed arrow. Scale bar: 1 !m.
plete screening of its electrostatic charge as appropriate for solutions with sufficiently high ionic strength and neglect-ing hydrodynamic interactions) and hence set # = 5.0 nm, with either lp= 50 nm or lp= 60 nm.The system dynamics
is described within a Langevin scheme:
m¨⃗ri = −γ ˙⃗ri− ∇U + ⃗η
where γ is the friction coefficient and ηsolis the stochastic
delta-correlated noise. The variance of each Cartesian com-ponent of the noise, σ2
η satisfies the usual fluctuation
dissi-pation relationship σ2
η = 2γ kBT
As customary, we set m/γ = 2τLJ, with τLJ = σ√m/ε =
σ√m/kBT being the characteristic simulation time. From
the Stokes friction coefficient of spherical beads of diame-ters σ we have: γ = 3πηsolσ where η is the solution
viscos-ity. By using the nominal water viscosity, ηsol= 1cPat all
slit widths and setting T = 300 K and σ = 5.0 nm, one has τLJ = 6πηsolσ3/ε∼ 600ns.
The Langevin equation is integrated numerically with the LAMMPS simulation package with an integration time step of 0.01τLJ ∼ 0.8ns. The starting point of the various
simulations is a perfect circular configuration lying on the bottom wall. To allow the equilibration of the system from this initial state, the first 2 × 10⁶integration time steps are
disregarded from the analysis of any observables. All rele-vant observables are calculated on hundreds of snapshots of the systems taken every 105integration time steps.
RESULTS
The main goal of the presented experiments is to address the effect of confinement on single DNA molecules of dif-ferent lengths using slits of various widths. For this purpose, we used two types of slit widths, i.e., ∼600 nm or ∼10 !m (Table 1). We can expect a circular DNA molecule to be affected by slit confinement when the average length of its major axis of inertia in free space (2D in our case) is com-parable to the slit width (major axis a∼slit width). Accord-ingly, because the average major axis of the longest, 8.4 kb-long, DNA filament considered here is a8.4 kb= 610 nm, we
can expect that the ‘giant’ slit that is 10 !m-wide should not affect its properties. The giant slit will therefore be used as a control to exclude experimental artifacts (experimen-tal steps such as capillary drag, removal of slits, rinsing and drying).
The sample preparation followed the scheme depicted on Figure2, left panel and for DNA adsorption on mica we followed our previously described set up (28,40). The whole experimental procedure consisted of several steps: treatment of PDMS slits with plasma stream (to make them hydrophilic), their deposition on a mica surface, DNA dif-fusion inside the slits, DNA adsorption on mica surface and finally AFM imaging (schematically represented in Figure 2). The approach was complementary to the ones previ-ously used (28,40), in that the AFM probes offered an un-precedented resolution of single DNA conformations inside the slits. There are clear differences between our present
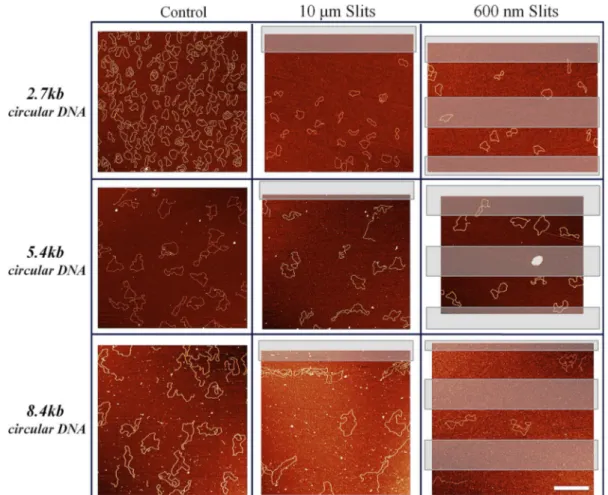
ex-Figure 3. Large scale AFM images of three types of circular DNA (2.7, 5.4 and 8.4 kb) versus slit size. Left column shows control measurements; middle
column shows DNA inside 10 !m giant slits; right column shows DNA inside 600 nm small slits. Transparent rectangles represent places where the slits were placed. DNA molecules outside the slits were not included in the statistics. Scale bar: 1 !m.
perimental procedure and the previously published meth-ods to evidence confinement effect. There is no need for us-ing either an external electrical field (6,17,41), or a pressur-ized flow cell to ‘pull’ the DNA inside the slits. The DNA translocation was based on the Laplace pressure and the DNA diffusion inside hydrophilic PDMS slits. Although the AFM measurements could only be taken after the con-fining matrix was removed (42–44), the biggest advantage though was the use of non-stained DNA in our studies. DNA properties such as the charge, contour length and the persistence length can be significantly affected upon bind-ing of fluorescent dyes (45–47).
The role of DNA size for confinement: 2.7–8.4kb DNA Our first experiments were performed on 2.7 kb nicked cir-cular DNA. We measured different shape parameters, such as the persistence length, the asphericity (A2) of molecules
trapped inside giant (i.e. width, 10 !m) and small slits (600 nm width) and then compared them to the values of un-constrained molecules outside the slits. As expected, for the smallest 2.7 kb DNA, the statistical parameters for control and trapped molecules did not differ. The 2D measured av-erage major axis for 2.7 kb DNA was a2.7 kb= 265 ± 25 nm,
whereas the confining dimensions of slits were much larger. Even the smallest 600 nm slits were too large for DNA to
experience any confinement (Figure3and Supplementary Figure S2). The effective persistence length for 2.7 kb DNA outside the slits was ∼50 nm (Table2), in very good agree-ment with the expected value (28,40). All above mentioned results confirmed that, there was no confinement effect of slits on 2.7 kb DNA. Molecules could freely diffuse inside slits and adopt a relaxed, largely adsorbed, conformation (Supplementary Figure S3).
The results changed once we used the larger, 5.4 kb long, circular DNA whose 2D average major axis is a5.4 kb= 450
± 30 nm. The morphology of the DNA, was clearly affected inside the 600 nm slits, as clearly seen on Figure3and in the zoomed images on Figure4. The change in the global shape of the molecules resulted in higher values for the effec-tive persistence length and the asphericity (A2). The closer
the value of asphericity is to 0 the more circular the object is, whereas if A2 = 1, the object is linear. For 5.4 kb
circu-lar DNA, the value changed from A2,cont= 0.27 ± 0.03 to A2,600 nm= 0.34 ± 0.03, where A2,contis the asphericity for
control and A2,600nmfor 5.4 kb DNA confined inside 600 nm
slits.
The molecules inside small slits adopted much more elon-gated shapes compared to those inside giant slits or the control ones, thus revealing the effects of spatial confine-ment. The shape of the correlation function for molecules
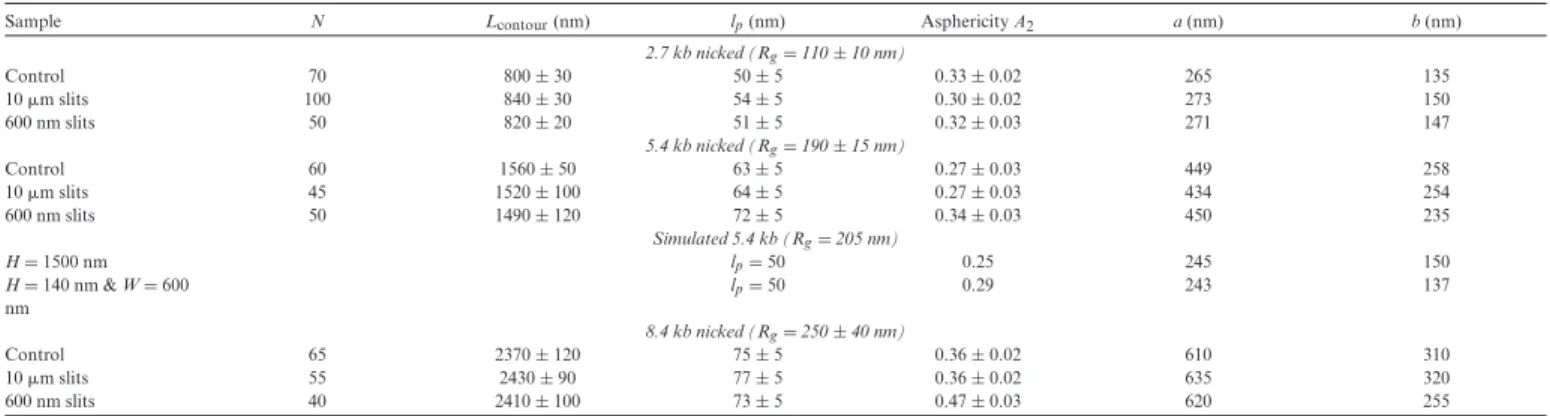
Table 2. Experimentally measured quantities of nicked circular DNA of various sizes
Sample N Lcontour(nm) lp(nm) Asphericity A2 a (nm) b (nm)
2.7 kb nicked (Rg= 110 ± 10 nm) Control 70 800 ± 30 50 ± 5 0.33 ± 0.02 265 135 10 !m slits 100 840 ± 30 54 ± 5 0.30 ± 0.02 273 150 600 nm slits 50 820 ± 20 51 ± 5 0.32 ± 0.03 271 147 5.4 kb nicked (Rg= 190 ± 15 nm) Control 60 1560 ± 50 63 ± 5 0.27 ± 0.03 449 258 10 !m slits 45 1520 ± 100 64 ± 5 0.27 ± 0.03 434 254 600 nm slits 50 1490 ± 120 72 ± 5 0.34 ± 0.03 450 235 Simulated 5.4 kb (Rg= 205 nm) H = 1500 nm lp= 50 0.25 245 150 H = 140 nm & W = 600 nm lp= 50 0.29 243 137 8.4 kb nicked (Rg= 250 ± 40 nm) Control 65 2370 ± 120 75 ± 5 0.36 ± 0.02 610 310 10 !m slits 55 2430 ± 90 77 ± 5 0.36 ± 0.02 635 320 600 nm slits 40 2410 ± 100 73 ± 5 0.47 ± 0.03 620 255
N is the number of molecules included in the averages, L the average contour length measured by AFM, lpthe effective persistence length, A2the asphericity, while a and b are the average major and minor
axis of the ellipse fitting the molecular trajectory.
Figure 4. Snapshots of 5.4 kb DNA in experiment (top panels) and
simu-lations (bottom panels): (A) control, (B) elongated, (C) hairpins (indicated by white arrows), (D) Interwound (indicated by red arrow). Evidently no hairpins were observed for simulations. Scale bar 100 nm.
Figure 5. (A) Experimentally measured bond correlation function of 5.4
kb circular DNA for control (black squares), Inside giant slits (red spheres) and inside small slits (blue triangles). (B) Experimental versus calculated bond correlation function for 5.4 kb circular DNA. Here, we show the ef-fect of A2on the bond-bond correlation function for chains in small slits.
As the bond–bond correlation function is computed for the set of con-figurations with A2 ≥ 0.5, the agreement with the experimental data is
much better (experimental data blue triangles and simulated data contin-uous blue line).
inside small slits (Figure5A) changed too. Once the DNA migrated and relaxed inside the slits, the initial part of the correlation function decayed more slowly, indicating longer correlated DNA segments and hence larger persis-tence lengths. The minimum of the correlation function was also lower, compared to the correlation function of non-confined DNA (Figure5A). The initial value of the effective persistence length lp= 63 ± 2 nm increased by as much as
∼15%, reaching the value lp= 72 ± 2 nm (Table2). All of
the measurements suggesting that 5.4 kb circular DNA ex-perienced mild lateral confinement once translocated inside 600 nm slits but not inside the 10 !m slits.
The most significant effect though was measured for 8.4 kb DNA trapped inside the 600 nm slits (2D a8.4 kb= 610 ±
80 nm). Confined molecules adopted strongly anisotropic shapes with many self-crossings (Figure3and Supplemen-tary Figure S4). The measured asphericity increased from
A2,cont= 0.36 ± 0.02 to A2,600 nm= 0.47 ± 0.03 (Table2).
We also observed a tendency for the molecules to orient inside the slits, compared to the random orientation out-side the slits (Supplementary Figure S5). The shape of the bond–bond correlation was also affected by the global con-finement acting on single molecules. Our measurements in-dicated that 8.4 kb circular DNA experienced strong lateral confinement inside the 600 nm slits, which resulted in de-tectable changes of physical properties, such as the bond ori-entation correlation function (Supplementary Figure S6).
Interestingly the persistence length of the largest molecules was not affected by the confinement. Even for the confined sample, it was comparable to the value obtained for control sample ∼lp = 75 nm (Table 2). We
noticed that the persistence length was increasing with DNA contour length. We believe that this correlation can be explained by a partial B-form to A-form DNA conformational change observed previously for linear DNA deposited with low concentrations of divalent cations (48,49). The A-form DNA is more compact and has a higher persistence length (50). This also explains why shorter (than expected for the B-form DNA) contour lengths of the molecules are estimated (Supplementary Table S1).
Computer simulations
To better understand the processes governing the DNA con-finement we performed computer simulations on the equi-librium properties of a model of circular DNA adsorbed on a surface and confined within slits of various dimensions.
In Figure5the bond–bond correlation function of the 5.4 kb DNA rings measured experimentally are compared with the corresponding estimates based on the simulations of semi-flexible rings of the same length and with persistence
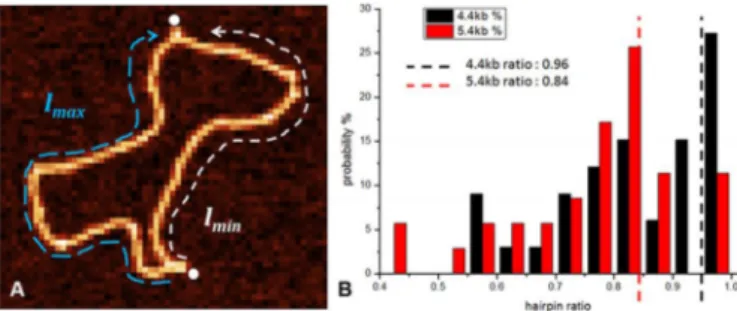
Figure 6. (A) Defining DNA hairpin ratio by measuring the ratio between
the minimal and the maximal arc length along the DNA between two hair-pins. (B)The hairpin arc ratio distribution for 4.4 kb (black bars) and 5.4 kb (red bars) nicked DNA. Red and black dotted lines represent the positions of the nicked sites.
length lp= 60 nm. A similar comparison for unconstrained
DNA rings of length 2.7 and 5.4 kb is reported in Supple-mentary Figure S2, Figure S3 and Figure S5 in Supplemen-tary data. The good agreement observed for both lengths ei-ther for giant (10 !m, red circles) or small (600 nm, blue tri-angles) slits suggests that the experimental adsorption pro-cess of DNA on mica is an equilibrium one. Moreover, the configurations are strongly adsorbed on the surface with practically no excursions along the z (i.e. slit height) direc-tion. This explains why they are weakly affected by the con-finement along z, even for the smallest slit height considered (Hslit = 140 nm). Hence, the main physical parameter
af-fecting the DNA conformational properties is the width of the slits. Once the average extension of unconstrained DNA rings were comparable to the slits’ width, confinement along this direction can be important and affect the shape of the adsorbed molecules.
It is crucial to notice that, in order to achieve the best agreement between experimental and numerical data anal-ysis had to be restricted to sampled configurations with a sufficiently high anisotropy. In particular if we restrict the computation of the bond-bond correlation function to the subset of sampled rings with asphericity A2≥ 0.5 agreement
with the experimental data is extremely good (see blue curve in Figure5B).
DNA hairpins and interwound regions
To understand why 5.4 and 8.4 kb DNA configurations ad-sorbed on mica and confined within small slits are more anisotropic than expected by equilibrium considerations, we looked more closely at the conformational properties of individual rings. The high resolution of AFM enabled us to observe nanometer long defects in the forms of hairpins (Figure4C) and interwound structures (Figure4D) for cir-cular DNA of sizes from 4.4 up to 8.4 kb. These nanometer size structures are clearly influencing the average values of the DNA shape parameters, resulting in more anisotropic conformations (Supplementary Figure S8). AFM enabled us to characterize in detail the relative position, the length and the frequency of the hairpins along the circular DNA (Table3and Figure6).
A way to quantify the relative position of the hairpins along the ring backbone is to compute the ratio between the contour lengths of the minimal (white dotted line) and
the maximal arc (light blue dotted line) delimited by two hairpins located along the DNA backbone (see Figure6A):
Hairpin arc ratio = llmin
max (3)
When we analysed the positions of the hairpins along the 5.4 kb DNA, we inferred that they were located in prox-imity of the nicked sites of the molecule. To confirm this hypothesis, we repeated the experiments with a molecule of comparable size, 4.4 kb DNA, which had nicked sites at dif-ferent positions with respect to the 5.4 kb DNA. We mea-sured the distributions of the arc length for both 4.4 and 5.4 kb and observed a clear difference between them. The arc ratio was clearly dependent on the construct used; agreeing well with the theoretically predicted position of the nicked sites (Figure6B).
Next, we measured the linear length of the DNA hair-pins (<Length Lh>in Table3). The length of the hairpins
was slightly increasing with the longer DNA size, ranging from 50 ± 25 nm for 4.4 kb DNA up to 70 ± 35 nm for 8.4 kb DNA. Interestingly, despite this increase, the relative amount of the total DNA length stored in these structures was little affected, being between 6 and 9% of the total con-tour length (Total DNA stored in Table3).
Next, we computed the hairpin occurrence probability for the confined molecules. To do so, we calculated the number of molecules having at least one hairpin relative to the total number of molecules (Hairpin Frequency in Ta-ble3). For control, unconfined molecules the frequency of the hairpins was always below 15%, whereas for confined molecules the value increased significantly (Table3), reach-ing 90% for 5.4 kb sized DNA. Interestreach-ingly, nicked DNA molecules which had hairpins, on average showed ∼2 hair-pins per DNA structure. In order to test the influence of the single strand breaks on the formation of hairpins, we repeated the experiments with non-nicked DNA (Supple-mentary Figure S9). Re-ligating the nicked sites in the DNA resulted in strong decrease in the hairpin frequency as well as the hairpin length. When we repeated the experiment with re-ligated 5.4 kb DNA (Table3), the frequency of the hairpins dropped 6-fold compared to the nicked molecules and the total length of the DNA stored inside the hairpin decreased by ∼40%. The average number of hairpins per DNA molecules (which had hairpins) also decreased, mean-ing that non-nicked molecules on average had only one hairpin/DNA. For the smallest confined 2.7 kb DNA, we did not observe any significant number of hairpins (<10%), once again indicating no lateral confinement for these small molecules (Supplementary Figure S10). We observed simi-lar tendency for the interwound regions, forming more fre-quently for larger confined molecules (up to 60% for 8.4 kb DNA). Similarly as for the hairpins, re-ligating the DNA nicked sites was significantly decreasing the total length as well as the frequency of the observed structures.
DISCUSSION
In this work, we describe a new experimental method for studying the effects of spatial confinement on the configura-tional and metric properties of DNA. By combining atomic
Table 3. Characteristics of DNA hairpins and interwound structures formed in the small slits Hairpins DNA N <Length Lh(nm)> Total DNA stored Theoretical hairpin
arc ratio <Experimental arc ratio> <NHairpin/DNA>
Hairpin frequency (%) 4.4 kb nicked 45 50 ± 25 nm 8% 0.96 0.85 1.8 70% 5.4 kb nicked 50 65 ± 25 nm 9% 0.84 0.77 2.0 90% 5.4 kb non-nicked 25 40 ± 20 nm 5% / / 1.2 15% 8.4 kb nicked 20 70 ± 35 nm 6% / / 1.6 50% 8.4 kb non-nicked 20 60 ± 25 nm 5% / / 1.05 20% Interwound
DNA N <Length Li(nm)> Total DNA stored <NInterwound/DNA> Interwound frequency (%)
4.4 kb nicked 20 65 ± 30 nm 10% 1.1 15%
5.4kb nicked 20 115 ± 65 nm 15% 1.2 25%
5.4 kb non-nicked 20 65 ± 30 nm 9% 1.1 20%
8.4 kb nicked 30 90 ± 40 nm 7% 1.7 60%
8.4 kb non-nicked 25 55 ± 25 nm 5% 1.3 25%
N is the number of molecules included in the averages, <Length Lh>and <Length Li>are respectively the average contour length of the hairpin and interwound structures measured by AFM, Total DNA stored is the percentage of the DNA contour length stored in the hairpin or interwound structures, Theoretical arc ratio is the theoretical ratio between the contour lengths of the minimal and the maximal arc along the circular DNA backbone between two nicked sites, <Experimental arc ratio> is the average ratio between the contour lengths of the minimal and the maximal arc along the circular DNA backbone delimited by two hairpins measured by AFM, <NHairpin/DNA>and <NInterwound/DNA> is respectively the average number of hairpins and interwound structures per DNA molecule which had hairpins, Hairpin and Interwound Frequency is respectively the frequency of hairpins and interwound structures among all measured DNA.
Figure 7. Schematic representation of DNA molecules under various levels of confinements with nicked region represented as a yellow dot. From left to
right: no confinement, weak confinement and strong confinement. Under strong confinement nicked sites in the DNA is co-localized with DNA hairpin.
force microscopy with conventional micro and nanofabri-cation tools, we show that it is possible to image and study individual DNA molecules subject to spatial confinement with nanometer resolution. The DNA profiling method in-troduced here, requires a very small amount of sample and does not rely on DNA staining. This gives us the possibil-ity to study DNA molecules of various sizes, topology and shape, by directly visualizing them. We believe that the pos-sibility to easily fabricate confining structures of tuneable dimensions opens new possibilities for experimental stud-ies, which will shed new insights on biopolymers behavior under confinement.
We performed experiments with various sized circular DNA and observed quasi-2D confinement for the 5.4 and 8.4 kb DNA rings when translocated inside the 600 nm slits. Our experimental findings were supported by molecular dy-namics simulations, capturing well the change in the bond-bond correlation function and the tendency for DNA rings to have higher anisotropy. With the help of simulations, we also revealed that the molecules could be well described by an equivalent model of DNA in equilibrium on an attractive surface in the presence of mild lateral confinement.
Most importantly, we observed nanometer sized local defects in the DNA molecules subject to the strongest slit confinement. These defects had direct bearing on the anisotropy of the rings, with their location overlapping with nicked regions in the DNA sequence. Strikingly, the presence of these hairpins was directly linked to the de-gree of DNA confinement. For non-constrained nicked
molecules the hairpin frequency was typically below ten percent (<10%), whereas for confined nicked molecules it reached up to ninety percent (∼90%). Our results are con-sistent with previously reported data on simulated DNA molecules in crowded or confined space (51–53), showing structural defects in the form of inter-winding of the DNA duplex. To our knowledge, the possibility that spatial con-finement can induce the formation of hairpins in nicked circular DNA has not been previously reported. We sur-mise that these effects could have relevant implications for the in vivo processing of DNA. In fact, early detection of nicked sites in the genome is crucially important for genome stability and the proper functioning of repair mechanism (29,30,54). Previously, it has been observed, that DNA de-fects in the form of hairpins can interfere with DNA tran-scription by stalling the trantran-scription machinery (32) and have a regulatory influence. Considering that in living bac-teria, the DNA is highly confined in space with the help of condensing agents, proteins and high levels of supercoiling (13,14), we propose that the quasi-2D confinement helps ex-pose thermodynamically weak positions by forming hair-pins and interwound regions (Figure7), which themselves can act as structural markers for different biological pro-cesses (29,31–33,55).
SUPPLEMENTARY DATA
ACKNOWLEDGEMENTS
The authors thank Prof. Georgi Muskhelishvili for valuable discussions and feedback. A.J. is grateful to Dr Tomasz Ju-rkowski for generous gift of 8.4 kb DNA and Caroline Mail-lard for her help with setting up the experiments.
FUNDING
Swiss National Science Foundation [P2ELP2 168554]; Ital-ian Ministry of Education [PRIN 2010HXAW77]. Fund-ing for open access charge: Laboratory of Physics of LivFund-ing matter EPFL.
Conflict of interest statement. None declared.
REFERENCES
1. Bonthuis,D., Meyer,C., Stein,D. and Dekker,C. (2008) Conformation and dynamics of DNA confined in slitlike nanofluidic channels. Phys. Rev. Lett. 101, 108303.
2. Kounovsky-Shafer,K.L. et al. (2013) Presentation of large DNA molecules for analysis as nanoconfined dumbbells. Macromolecules
46, 8356–8368.
3. Jones,J.J., van der Maarel,J.R.C. and Doyle,P.S. (2013) Intrachain dynamics of large dsDNA confined to slitlike channels. Phys. Rev. Lett. 110, 068101.
4. Manneschi,C. et al. (2013) Conformations of DNA in triangular nanochannels. Macromolecules 46, 4198–4206.
5. Strychalski,E.A., Geist,J., Gaitan,M., Locascio,L.E. and Stavis,S.M. (2012) Quantitative measurements of the size scaling of linear and circular DNA in nanofluidic slitlike confinement. Macromolecules 45, 1602–1611.
6. Fanzio,P. et al. (2012) Modulating DNA translocation by a controlled deformation of a PDMS nanochannel device. Sci. Rep. 2 ,791. 7. Micheletti,C. and Orlandini,E. (2012) Knotting and metric scaling
properties of DNA confined in nano-channels: a Monte Carlo study. Soft Matter 8, 10959–10968.
8. Micheletti,C. and Orlandini,E. (2012) Numerical study of linear and circular model DNA chains confined in a slit: Metric and topological properties. Macromolecules 45, 2113–2121.
9. Odijk,T. (1983) The statistics and dynamics of confined or entangled stiff polymers. Macromolecules, 16, 1340–1344.
10. Tegenfeldt,J.O., Prinz,C., Cao,H., Chou,S., Reisner,W.W. et al. (2004) From the cover: The dynamics of genomic-length DNA molecules in 100-nm channels. Proc. Natl. Acad. Sci. U.S.A., 101, 10979–10983. 11. Reisner,W., Morton,K.J., Riehn,R., Wang,Y.M., Yu,Z., Rosen,M., Sturm,J.C., Chou,S.Y., Frey,E. and Austin,R.H. (2005) Statics and dynamics of single DNA molecules confined in nanochannels. Phys. Rev. Lett., 94, 1–4.
12. de Gennes,P.G. (1979) Scaling Concepts in Polymer Physics. Cornell University Press.
13. Sherratt,D.J. (2003) Bacterial chromosome dynamics. Science, 301, 780–785.
14. Travers,A. and Muskhelishvili,G. (2005) Bacterial chromatin. Curr. Opin. Genet. Dev., 15, 507–514.
15. Castillo-Fernandez,O. et al. (2011) Electrokinetic DNA transport in 20 nm-high nanoslits: evidence for movement through a
wall-adsorbed. Electrophoresis, 32, 2402–2409.
16. Lin,P., Hsieh,C.-C., Chen,Y.-L. and Chou,C.-F. (2012) Effects of topology and ionic strength on double-stranded DNA confined in nanoslits. Macromolecules 45, 2920–2927.
17. Yeh,J.-W., Taloni,A., Chen,Y.-L. and Chou,C.-F. (2012) Entropy-driven single molecule tug-of-war of DNA at micro-nanofluidic interfaces. Nano Lett. 12, 1597–1602. 18. Orlandini,E. and Micheletti,C. (2013) Knotting of linear DNA in
nano-slits and nano-channels: a numerical study. J. Biol. Phys., 39, 267–275.
19. Dekker,C. (2007) Solid-state nanopores. Nat. Nanotechnol., 2, 209–215.
20. Schneider,G.F., Kowalczyk,S.W., Calado,V.E., Pandraud,G., Zandbergen,H., Vandersypen,L.M.K. and Dekker,C. (2010) DNA
translocation through graphene nanopores. Nano Lett., 10, 3163–3167.
21. Keyser,U.F., Koeleman,B.N., van Dorp,S., Smeets,R., Lemay,S.G., Dekker,N.H. and Dekker,C. (2006) Direct force measurements on DNA in a solidstate nanopore. Nat. Phys., 2, 473–477.
22. Suma,A., Rosa,A. and Micheletti,C. (2015) Pore translocation of knotted polymer chains: How friction depends on knot complexity. ACS Macro Lett., 4, 1420–1424.
23. Rosa,A., Di Ventra,M. and Micheletti,C. (2012) Topological jamming of spontaneously knotted polyelectrolyte chains driven through a nanopore. Phys. Rev. Lett., 109, 118301.
24. Persson,F., Utko,P., Reisner,W., Larsen,N.B. and Kristensen,A. (2009) Confinement spectroscopy: probing single DNA molecules with tapered nanochannels. Nano Lett., 9, 1382–1385.
25. Jo,K. et al. (2007) A single-molecule barcoding system using nanoslits for DNA analysis. PNAS 104, 2673–2678.
26. Micheletti,C. and Orlandini,E. (2014) Knotting and unknotting dynamics of DNA strands in nanochannels. ACS Macro Lett, 3, 876–880.
27. Krishnan,M., M¨onch,I. and Schwille,P. (2007) Spontaneous stretching of DNA in a two-dimensional nanoslit. Nano Lett., 7, 1270–1275.
28. Witz,G., Rechendorff,K., Adamcik,J. and Dietler,G. (2011) Conformation of ring polymers in 2D constrained environments. Phys. Rev. Lett. 106, 248301.
29. Fukui,K. (2010) DNA mismatch repair in eukaryotes and bacteria. J. Nucleic Acids, 2010, 1–16.
30. Han,W.H., Lindsay,S.M., Dlakic,M. and Harrington,R.E. (1997) Kinked DNA. Nature, 386, 563.
31. Green,S.J., Lubrich,D. and Turberfield,A.J. (2006) DNA hairpins: fuel for autonomous DNA devices. Biophys. J., 91, 2966–2975. 32. Voineagu,I., Narayanan,V., Lobachev,K.S. and Mirkin,S.M. (2008)
Replication stalling at unstable inverted repeats: interplay between DNA hairpins and fork stabilizing proteins. PNAS, 105, 9936–9941. 33. Racko,D., Benedetti,F., Dorier,J., Burnier,Y. and Stasiak,A. (2015)
Generation of supercoils in nicked and gapped DNA drives DNA unknotting and postreplicative decatenation. Nucleic Acids Res., 43, 7229–7236.
34. Mason,D.J. and Powelson,D.M. (1956) Nuclear division as observed in live bacteria by new technique. J. Bacteriol., 71, 474–479. 35. Cairns,J. (1963) The chromosome of Escherichia coli. Cold Spring
Harb. Symp. Quant. Biol., 28, 43–46.
36. Neˇcas,D. and Klapetek,P. (2012) Gwyddion: an open-source software for SPM data analysis. Open Phys. 10, 181–188.
37. Rubinstein,M. and Colby,R.H. (2003) Polymer physics. 38. Camacho,C.J. and Fisher,M.E. (1990) Tunable fractal shapes in
self-avoiding polygons and planar vesicles carlos. Phys. Rev. Lett. 65, 9.
39. Mikhaylov,A., Sekatskii,S.K. and Dietler,G. (2013) DNA trace: a comprehensive software for polymer image processing. J. Adv. Microsc. Res., 8, 241–245.
40. Witz,G., Rechendorff,K., Adamcik,J. and Dietler,G. (2008) Conformation of circular DNA in two dimensions. Phys. Rev. Lett.
101, 148103.
41. Stein,D., Deurvorst,Z., Van Der Heyden,F.H.J., Koopmans,W.J.A., Gabel,A. and Dekker,C. (2010) Electrokinetic concentration of DNA polymers in nanofluidic channels. Nano Lett., 10, 765–772.
42. Bystrenova,E., Facchini,M., Cavallini,M., Cacace,M.G. and Biscarini,F. (2006) Multiple length-scale patterning of DNA by stamp-assisted deposition. Angew. Chem. - Int. Ed., 45, 4779–4782. 43. Vonh¨oren,B., Langer,M., Abt,D., Barner-Kowollik,C. and Ravoo,B.J.
(2015) Fast and simple preparation of patterned surfaces with hydrophilic polymer brushes by micromolding in capillaries. Langmuir,31, 13625-13631
44. Gentili,D., Valle,F., Albonetti,C., Liscio,F. and Cavallini,M. (2014) Self-organization of functional materials in confinement. Acc. Chem. Res., 47, 2692–2699.
45. Japaridze,A., Benke,A., Renevey,S., Benadiba,C. and Dietler,G. (2015) Influence of DNA binding dyes on bare DNA structure studied with atomic force microscopy. Macromolecules, 48, 1860–1865. 46. Kundukad,B., Yan,J. and Doyle,P.S. (2014) Effect of YOYO-1 on the
47. G¨unther,K., Mertig,M. and Seidel,R. (2010) Mechanical and structural properties of YOYO-1 complexed DNA. Nucleic Acids Res.
38, 6526–6532.
48. Japaridze,A., Vobornik,D., Lipiec,E., Cerreta,A., Szczerbinski,J., Zenobi,R. and Dietler,G. (2016) Toward an effective control of DNA’s submolecular conformation on a surface. Macromolecules, 49, 643–652.
49. Rivetti,C. and Codeluppi,S. (2001). Accurate length determination of DNA molecules visualized by atomic force microscopy: evidence for a partial B- to A-form transition on mica. Ultramicroscopy, 87, 55–66. 50. Charney,E., Chen,H.H. and Rau,D.C. (1991) The flexibility of
A-form DNA. J. Biomol. Struct. Dyn., 9, 353–362.
51. Lim,W., Ng,S.Y., Lee,C., Feng,Y.P. and Van Der Maarel,J.R.C. (2008) Conformational response of supercoiled DNA to confinement in a nanochannel. J. Chem. Phys., 129, 1651021–1651026.
52. Zhu,X., Ng,S.Y., Gupta,A.N., Feng,Y.P., Ho,B., Lapp,A., Egelhaaf,S.U., Forsyth,V.T., Haertlein,M., Moulin,M. et al. (2010)
Effect of crowding on the conformation of interwound DNA strands from neutron scattering measurements and Monte Carlo simulations. Phys. Rev. E, 81, 061905.
53. Benedetti,F., Japaridze,A., Dorier,J., Racko,D., Kwapich,R., Burnier,Y., Dietler,G. and Stasiak,A. (2015) Effects of physiological self-crowding of DNA on shape and biological properties of DNA molecules with various levels of supercoiling. Nucleic Acids Res., 43, 2390–2399.
54. Kuzminov,A. (1999) Recombinational repair of DNA damage in Escherichia coli and bacteriophage lambda. Microbiol. Mol. Biol. Rev., 63, 751–813.
55. Sobetzko,P., Glinkowska,M., Travers,A. and Muskhelishvili,G. (2013) DNA thermodynamic stability and supercoil dynamics determine the gene expression program during the bacterial growth cycle. Mol. BioSyst., 9, 1643–1651.