Preface
The research presented in this dissertation was made possible by the Institute of Atmospheric Pollution Research - Division of Rende, of the Italian National Research Council (IIA-CNR). Additional scientific teachings during the first period of my PhD studies were provided by the Department of Informatics and System (DEIS), University of Calabria, Rende. I am sincerely grateful for the support provided by the following various groups throughout the time I spent as a PhD student.
Particularly, I would like to acknowledge my supervisor and chair, Prof. Domenico Talia, that has given to me the opportunity to ”touch” the fas-cinating world of scientific research and that I am honoured to have as a guide.
I would like to thank especially my outstanding mentor, Dr. Sergio Cinnirella, for the insightful comments and thoughtful conversations that helped to en-hance the quality of this research. His guidance supported me in all the time of research and writing of this thesis.
I am also grateful to my colleagues for their friendship and for the valuable help in all aspect of my work.
In particular, I want to thank Mariantonia Bencardino, Laura Fantozzi, Gio-vanni Manca and Lynne Gratz for their support over the years in the office at CNR-IIA.
Lastly, I would like to thank my family for all their love and encouragement. For my parents who raised me with a love of science and supported me in all my pursuits.
Francesco D’Amore Rende,
Contents
Part I A Spatial Data Infrastructure and Geo Data Management
1 An Air Quality Spatial Data Infrastructure . . . 3
1.1 Introduction . . . 3
1.2 Air Quality and Spatial data Infrastructure . . . 6
1.3 Development of Spatial Data Infrastucture for Air Quality Theme under GIIDA . . . 8
2 ICT Methodologies and Spatial Data Infrastructure . . . 13
2.1 The SDIs role in Air Quality information Management . . . 13
2.2 The SDI Architecture and Implementation . . . 14
2.3 GeoInt . . . 22
2.4 System Integration . . . 26
2.5 Geo Services Factory . . . 27
Part II The Global Mercury Observation System 3 The GMOS Project . . . 31
3.1 GMOS Interoperable System . . . 33
4 Architecture definition and development of data exchange system . . . 37
4.1 ICT techniques in the SDI design . . . 37
4.2 The SDI architecture and implementation . . . 37
4.3 Information Viewpoint . . . 38
4.4 Enterprise Viewpoint . . . 40
4.5 Computational Viewpoint . . . 43
4.6 Technology Viewpoint . . . 45
5 Definition of metadata and standards with respect to
INSPIRE . . . 53
5.1 Metadata and Data Sharing . . . 53
5.2 Rules for application schemas . . . 54
5.3 Coordinate reference system, projection and units . . . 62
5.4 Identifier management . . . 65
5.5 Multi-lingual text and cultural adaptability . . . 65
5.6 Data consistency . . . 66
6 Server and databases . . . 67
6.1 SDI implementation . . . 67
6.2 Main characteristics of the user-friendly interface . . . 69
6.3 Main characteristics of collected information . . . 70
7 Communication and networking for data retrieval . . . 73
7.1 Configuration of all GMOS ground-based sites . . . 73
7.2 Raw output files from monitoring instruments . . . 73
7.3 Scenarios . . . 74
7.4 Data Format and Data Protocol . . . 77
7.5 Data Storage . . . 78
7.6 Data Visualization . . . 78
7.7 Data Policy . . . 78
8 Implementation of tools for data fusion . . . 81
8.1 GI-cat clients . . . 81
9 Implementation of GMOS Portal . . . 85
9.1 Public portal services . . . 85
9.2 Private portal services . . . 86
9.3 Download format . . . 88
9.4 Additional services . . . 88
10 GMOS Data Policy . . . 89
10.1 GEOSS Data Sharing Principles . . . 89
10.2 Definitions of Terms . . . 90
10.3 The GMOS Spatial Data Infrastructure . . . 92
10.4 Policy for Data Usage . . . 93
10.5 Policy for Data Contributions . . . 95
11 Conclusion . . . 101
Part I
A Spatial Data Infrastructure and Geo Data
Management
1
An Air Quality Spatial Data Infrastructure
1.1 Introduction
Health diseases caused by environmental pollution are a growing concern worldwide, which in recent years addressed more studies on causal links be-tween environmental pollution and health at regional and global levels [1] [2]. A greater understanding is thus needed of the links between exposure to pollution and its effect on health, as well as the long term impact on health of chemical substances, biological organisms and physical changes in the environment. Monitoring and modelling are, therefore, a crucial activity for identifying the key pressures on the environment, the condition or state of the environment, and the level of environmental quality being achieved by society [3]. Monitoring and modelling are inevitably challenging, not only from a technical point of view but also due to the complexity of the prob-lems being addressed, originating in the interaction of multiple parameters at various levels of organization (anthropogenic or biological, individual or population) and scale (from global to local). Using the information collected through monitoring provides big challenges in integrating and connecting the various information sources used and the technologies implemented. A num-ber of initiatives already exist to link different types of environmental data for various purposes, including efforts from the EEA (EIONET), the WMO (IGACO), the OECD (ECOSANTE), UNECE (EMEP), AC (AMAP), the EU and ESA (GMES) and the EU information system (INSPIRE). These monitoring actions involve several monitoring networks, a wide range of ob-servational platforms and the use of techniques for data harmonization (also called data assimilation), interconnectivity and linkage. Integrated health as-sessment is not the main purpose of these monitoring networks, nevertheless it requires both routinely available and by-project collected dataset, combined in multiple ways.
Data and model simulations are, therefore, crucial to support policy makers and public participation within any environmental decision making process as well as for a broad understanding of the environment. However, these data
are not always available to the public and are not usually in a format that is understood by all the different stakeholders [4] [5].
Also, monitoring systems show relevant discrepancies in terms of spatial and temporal trends, as they do not cover appropriate regions, are discontinue along years and are often application-oriented. To fulfil the gap Spatial Data Infrastructures (SDIs) have been developed. An SDI is a framework of poli-cies, institutional arrangements, technologies, data and people which enables the sharing and effective usage of geographic information [6]. For example, the Canadian Geospatial Data Infrastructure (CGDI) was implemented as an easy-to-use, advanced, online information resource for offering valuable bene-fits to decision makers in four priority areas [7], which are:
• public safety: to share maps of roads, bridges, electrical grids, water sys-tems, buildings, and the like, to better plan for and respond to emergencies and disasters;
• public health community: to share location-based information securely to track pandemics, analyse trends, and monitor population health;
• local population community: to connect people and communities, map the future, and realize opportunities; and
• environment and sustainable development: to better manage land and wa-ter, assess the environment, and monitor ecosystems.
In order to overcoming inconsistencies in spatial data collection, lacking of documentation, incompatibility of spatial data sets, barriers to share and re-use of existing spatial data and incompatibility of geographic information initiatives, the EU adopted the INSPIRE Directive, which was developed to enable effective sharing of geographical data locally, and across borders [8]. The overall objective of INSPIRE is to make harmonized and quality spatial information readily available to support environmental policies and policies or activities which may have a direct or indirect impact on the environment in Europe. The INSPIRE proposal lays down general rules for the establishment of an SDI in Europe based on infrastructures for spatial information estab-lished and operated by the Member States. The component elements of those infrastructures include: metadata; key spatial data themes and spatial data services; network services and technologies; agreements on sharing, access and use; co-ordination and monitoring mechanisms; process and procedures.
In addition, the Group on Earth Observations(GEO) launched a program to coordinate efforts to build a Global Earth Observation System of Systems (GEOSS) aimed to obtain benefit in a broad range of societal benefits ranging from human health to biodiversity loss throughout resource’s management, cli-mate prediction, weather forecast and ecosystems protection. GEO provided a web-based interface (GEO Portal) for searching and accessing the data, infor-mation, imagery, services and applications available through the Global Earth Observation System of Systems (GEOSS) [10].
1.1 Introduction 5
At Italian National level, some regions have built SDI projects, with dif-ferent platforms, difdif-ferent costs and difdif-ferent data (e.g. Lombardia, Sardegna, Piemonte) or are developing projects concerning spatial data and integrated information services (Abruzzo, Puglia, Calabria, Sicilia, Molise, Sardegna, Campania). Also the Department of Civil Protection and the Department of Environment of the Italian Environment Ministry have portals respectively oriented to risk prediction/mitigation and collection of a vast Remote Sens-ing Plan for multi spectral data. Also the Comando Carabinieri per la Tutela dellAmbiente (Environmental Protection Command of Carabinieri Corp) has developed an important project for the control of crimes against the envi-ronment, with a wide collection of spatial data, including many iperspectral coverage as well as the Department of Demanio Marittimo has rebuilt and up-dated cadastral maps of all the Italian coasts. Spatial datasets are, therefore, a basic part of the information systems of the public administrations and the aforementioned projects are connected with the mission of the public admin-istration, but they are hardly ever aimed at achieving an SDI. Most of the projects use standards for interoperable data and network services and often have a web geo-portal, but there is no uniform SDI that covers all of Italy [11]. In this work we present methodologies used in two projects oriented to geo data management in environmental fields: GIIDA and GMOS.
To coordinate national earth and cross-disciplinary systems for promoting GEOSS and to support INSPIRE implementation, the Italian National Re-search Council (CNR) promoted the GIIDA project (Integrated and Interop-erable Management of Environmental Data) [12]. GIIDA aims to ”implement the Spatial Information Infrastructure (SII) of CNR for Environmental and Earth Observation data”. It was also aimed to design and develop a multidis-ciplinary cyber infrastructure for the management, processing and evaluation of Earth and environmental data. This infrastructure will contribute to the Italian presence in international projects and initiatives, such as: INSPIRE, GMES, GEOSS and SEIS.
GIIDA was divided in seven main thematic areas/domains: Biodiversity, Climate Changes, Air Quality, Soil and Water Quality, Risks, Infrastructures for Research and Public Administrations, Sea and Marine resources following the main research areas of the CNR. CNR-Institute of Atmospheric Pollution Research (CNR-IIA) leads the Working Group on Air Quality, which devel-oped i) a specific Web Portal; ii) a thematic catalog service; iii) a thematic thesaurus service; iv) a thematic Wiki; v) standard access and view services for thematic resources such as: datasets, models, and processing services; vi) a couple of significant use scenarios to be demonstrated.
The Global Mercury Observation System (GMOS) project was es-tablished in support of the Group on Earth Observations (GEO) 2012-2015
work plan and the task HE-02-C1,”Global Mercury Observation System”. This task supports the achievement of the goals of GEOSS and other on-going international programs, including the UNEP Mercury Program, as well as major international conventions, such as the UNECE-LRTAP TF HTAP. The overall goal of GMOS is to develop a coordinated global observation sys-tem for mercury, including ground-based stations at high altitude and sea level locations, ad-hoc oceanographic cruises over the Pacific, the Atlantic and the Mediterranean, and free tropospheric mercury measurements. This will provide high quality data for the validation and application of regional and global scale atmospheric models, to provide concrete findings that can be used to support future policy development and implementation.
In the first part, we present Software Architectures and methods for geo data management. Next, we present GMOS project as use case of such methodologies.
1.2 Air Quality and Spatial data Infrastructure
1.2.1 Introduction to Air Quality Management
The goal of air quality management is to protect and enhance air quality for preserving human health and ecosystems. To accomplish the goal numer-ous regulations and standards, a broad suite of management tools, and several monitoring networks to track progress have been established (e.g. AERONET, EMEP, GAW). All of these components depend on robust and up-to-date sci-entific and technical input, which includes an understanding of relationships between air pollutant levels and impacts on human health, ecosystems, at-mosphere composition and materials. At this level a SDI is fundamental as repository but also as interface between science and management as well as policy.
1.2.2 Role of SDI in Air Quality Management
A SDI oriented to Air Quality Management is a framework that should collect air quality information at both dataset and metadata level, store them in a database and make them accessible through a web-interface. The idea is to connect heterogeneous databases at different locations and access them from a simple web interface such that they appear as one, virtual database for the end user. Through a data catalogue (metadata) the users requests can be directed towards the appropriate database server(s). The results of such a query can then be downloaded from a central server or emailed to the customer. Large collections of air quality observation and simulation data can be made available through the cooperation of as many data centres as possible, and the physical location of these datasets becomes irrelevant. The only real
1.2 Air Quality and Spatial data Infrastructure 7
problem to be overcome is the different data policies, but this is changing owing to a European Directive (Directive 2003/4/EC) on public access to environmental information [9].
1.2.3 Metadata and Interoperability in Air Quality Management Storing and organizing data needs to contextualize data themselves in order to give information on collection methodology,lineage, spatial and temporal domain, copyright, context of use, etc. Such documentation is called meta-data. Metadata helps organise and maintain data and provides information about an organisations data holdings in catalogue form; avoids duplication of effort by ensuring the organisation is aware of the existence of data sets; helps users to locate all available geospatial and associated data relevant to an area of interest; builds upon and enhances the data management procedures of the geospatial community; promotes the availability of geospatial data beyond the traditional geospatial community; advertise and promote the availability of their data and potentially link to on line services [6].
Though air quality data are important inputs to simulation models and decision-making systems, they are highly distributed and heterogeneous, and thus difficult to access in a coordinated manner. The first step to make them interoperable is to produce a spatial and temporal metadata registry that enables the science community to more easily use and exchange data and ser-vices. Metadata are very important for interoperability and systems integra-tion, because with metadata is possible to define a common standard between systems. Use metadata is the main step for building complex geo-system where interoperability is a common target. The second step is to produce data in common formats following internationally accepted content standards by gov-ernment agencies, academic institutions, and commercial companies around the world. The central management and storage of air quality data and meta-data enable the interoperable meta-data access at all levels of this framework by integrating in a central database data retrieved in most common format, in-cluding netCDF, ESRI c shapefile and Microsoft c Excel.
1.2.4 Users of SDI in Air Quality Management
From the perspective of an End User, a SDI should organize information and resources and distributes them, providing their services via a single access point, often online. The resources managed by a SDI should be Geo Por-tals or catalogs of Geographic Web Services oriented to users. In both cases, through the access points to the SDI, the end user should find the resources searching among metadata.
Users accessing an air quality SDI can be a human operator or a Service Client, often a Web Service Client. In the first case, the SDI is used by operators that can be data readers or users that create data and metadata. Among them, the decision makers in public administration and researchers interested in the Air
Quality are fundamental. In order to match the requirements for this kind of users is important create tools to search geographic data, necessarily based on metadata, allowing the detection of geographical data based on keywords and the geographic location. The data visualization during the search phase has no a fundamental impact on the user (reference), but a minimal visualization tool for performing research based on geographic localization is needed. After this phase, visualization is a critical requirements in Air Quality man-agement, and the visualized products should be different as result of a different use of data. Resulting metadata must indicates access points related to data use.
Data producer has different needs from data reader, as he should create data and metadata. It is important to use a unique standard and a single access point to metadata, in order to manage standard and access policy. Often the access point for metadata is a Web Application, with metadata editor and an end point for metadata catalog service.
Data and metadata entered must be reached even by non-human clients, typ-ically Web Service Clients. This is an important requirement to ensure the scalability of the system towards systems of systems such as GEOSS or GI-IDA.
In the first part of this work will be presented methodologies used in order to develop frameworks and process for Spatial Data Infrastructure. In the sec-ond part such methodologies will be used in order to build a Data Sharing Framework for the Global Mercury Observation System (GMOS) network. GMOS is an Observing System aimed to collect and share data about mer-cury pollution. Data will be collected by different provider by means of sharing architectures oriented to geo data management.
1.3 Development of Spatial Data Infrastucture for Air
Quality Theme under GIIDA
1.3.1 Data Analysis and state of the art
Data and state of the art analysis is crucial to understand what kind of SDI to create. In our case, data are related to pollutants holding geographical in-formation (i.e. latitude, longitude, elevation, pollutant concentration or emis-sion). Data are gathered from monitoring systems and numerical simulations running on a parallel computing cluster. Simulations outputs are often in netCDF format, which is a binary format used for its flexibility and widely used as a container for scientific information (reference). Both measurements and simulations must be integrated into the SDI by considering work method-ologies. Some data are or have been collected in geographical containers (e.g. ESRI c shapefile or NetCDF) and come from previous studies that have pro-duced geographic data. They represent an essential background for the startup the Air Quality SDI.
1.3 Development of Spatial Data Infrastucture for Air Quality Theme under GIIDA 9
1.3.2 SDI Architecture and used technologies
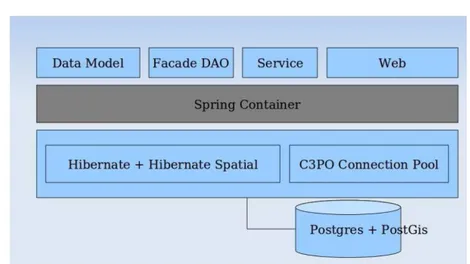
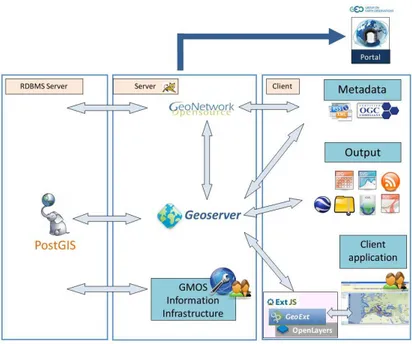
The Architecture of the Air Quality SDI aims to provide geographic services for integration into a Service Oriented Architecture (SOA) as GIIDA and GEOSS. SOA is the main orientation of further development within the en-vironmental sector. The core of the system is represented by the PostGIS geographic database, which holds vector information (Figure 1.1). PostGIS, an extension of PostgreSQL DBMS, is a de facto standard in the panorama of open source software for storage of vectorial geographic data, but its current limit concern raster data storage in comparison with not-free competitors (e.g. Oracle).
Fig. 1.1. The Architecture of the Air Quality Spatial Data Infrastructure
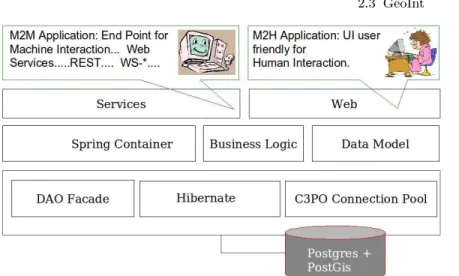
Data are stored into the database with a dedicated tool, the Data Man-agement System (DMS), developed at CNR-IIA. The DMS receives as input the results of numerical models or measurement data, reads the content and persists them in the central database. Data input is in the format of XML meta-language, netCDF or shapefile. The DMS was developed with a modular architecture that allows to change the functionality to meet futures require-ments. The goal is to use the DMS as an information platform for the man-agement of vector data coming from measurements and numerical models. As shown in Figure 1.2, the DMS enables the persistence of vector data us-ing Hibernate as Object relational mappus-ing (ORM) directly connected to the PostGis database. The system has a Web interface that allows interaction with the end-user. We are studying the way to integrate the DMS with used models (e.g. Weather Research and Forecasting Model, WRF) in order to minimize human interactions and enhance integration and interoperability.
Fig. 1.2. The Data Management System (DMS) Architecture, developed at CNR-IIA
ESRI c shapefiles are de facto a standard for spatial data and represent the product of previous works but they are often distributed in several personal computers making data redundancy and not interoperable. As consequence, these vector files have been converted and stored in the database as our goal is to store all geographic data in the central DBMS. A problem remains for raster data that currently are not supported by PostGis. In the SDI they are handled directly by Geoserver and stored in the File System. Nevertheless, we are studying ways to store raster data on the PostGIS database by using mechanisms similar to those used for vectorial data (WKTRaster).
Geoserver is a map server that exports the data by creating Geographic Web Services, complaint with OGC (WMS, WFS, WCS).
These services can be used directly by end-users in complex systems SOA com-pliant, or geoportals built with Web technologies. The OGC services are also used by GeoNetwork for integrate metadata with maps and other geographic data. GeoNetwork is a tool used by Air Quality SDI for the creation and man-agement of metadata based on INSPIRE directive (http://cartoserver.iia.cnr.it/). The metadata is stored in central database, as illustrated in Figure 1.2, which thus represents the central unit of storage both for data and metadata. The metadata managed by GeoNetwork are exported via the CSW 2.0.2. This ser-vice is the basis for integration of Air Quality SDI in complex systems such as GIIDA, as explained in 1.3.5.
1.3.3 Metadata Editor: Standard and Metodologies
In the Air Quality SDI the Geonetwork tool is successfully employed to create and manage metadata for geographic data. This tool allows users to create metadata compliant with European and international standard, such as ISO
1.3 Development of Spatial Data Infrastucture for Air Quality Theme under GIIDA 11
19139 and INSPIRE Directive. The tool allows validation and check of created metadata and links with Geographical Services such as WMS, correlation with differents, and even not structured, data sources. Metadata managed by Geonetowrk are stored in a Postgres DBMS as showed in 1.1.
To improve interoperability, Geonetowrk exports metadata with the protocol CS-W. This feature permits the creation of complex Systems of Systems by federating different nodes. In our Air Quality SDI this feature is exploited by Gi-cat in order to integrate our SDI with GIIDA as explained in 1.3.5.
1.3.4 Metadata Editor: Standard and Metodologies In Air Quality SDIs, are important three types of clients:
1. Web based clients, oriented to specific products and projects related to Air Quality theme;
2. DektopGIS oriented to researcher and operators in data elaboration; 3. Web Services, compliant with standard OGC and designed for system
integration and interoperability.
The DesktopGIS systems can access information in two ways: by connect-ing directly to the geographic database or at Geoserver services, usconnect-ing WMS. Connecting directly to the database, the user of DesktopGIS that has the credentials to do so, can modify and work on the data. These changes will be made available directly to all services that use the data, given the centrality of the database in our architecture.
The web-based systems are used by end-users by means of geoportals, in which geographic data are used to create high level services and specific projects and are related to particular areas of interest such as monitoring the ozone precursors emission from facilities, or simply view a list of information layers contained in the Air Quality SDI. The web based systems are therefore the ideal tool to realize information systems that reach a wide range of users. The technologies used for the realization of these systems are based mostly on javascript frameworks as Openlayers, which allow to develop GIS applica-tions with AJAX support. Openlayers is a very effective tool that allows a connecttion directly to a WMS service in order to develop WebGis effective and easy to use. These methodologies currently represent the most used tech-nique in the area of opesource WebGis products and offer excellent results. However, new methodologies for creating Web- based applications are avail-able in the marketplace that allow to overcome the development approach based on Javascript, as building, reusing, and maintaining large JavaScript code bases and AJAX components can be difficult and fragile. For our pur-poses, GWT a technology integrated with Openlayers, which directly uses
Java or similar Software Engineering techniques, was adopted.
1.3.5 Integration of Air Quality SDI in GIIDA
Interoperability and systems integration has become important in geographic systems and SOA architectures become popular even in geo-systems area. The Air Quality SDI was created having in mind the more high level system, GIIDA. The integration of Air Quality SDI with GIIDA occurs primarily through the use of OGC CSW protocol that supports the ability to publish and search collections of metadata about geospatial data, services and related resources. It is therefore an integration based on common use of metadata standards according to the INSPIRE directive. The Air Quality SDI exports metadata entered through Geonetwork, using the protocol CSW. The end point for CSW is the catalog Gi-cat that collects data from Geonetowork. The information carried from CSW are linked to GIIDA which can acts as a collector of geographic information. Similarly, other participants to GIIDA can incorporate information coming from their SDIs using CSW protocol, creating thus a complex system of systems that offers integrated services to users.
2
ICT Methodologies and Spatial Data
Infrastructure
2.1 The SDIs role in Air Quality information
Management
The goal of air quality information management is to protect and enhance air quality to preserve human health and ecosystems [15]. To accomplish the goal, several regulations and standards have been established, and these have utilized a broad suite of management tools and monitoring networks to track progress (e.g. AERONET, EMEP, GAW, GMOS). All of these components depend on robust and up-to-date scientific and technical inputs, which in-clude the most advanced knowledge of relationships between air pollutant levels and their impacts on human health, ecosystems, atmosphere composi-tion, and cultural heritage sites. At this level an SDI is not only a repository, but an intermediary mechanism that provides raw data for science, manage-ment, and policy.
An SDI oriented to air quality information management is a framework that should collect air quality information at both dataset and metadata levels, store it in a database, and make it accessible through a web-interface. The SDI can also integrate a component that connects external and heteroge-neous databases, enabling access to a single user-friendly web interface that makes both appear as one, virtual database to the end-user. Therefore, ex-ternal databases can be exported as a single data warehouse by using a data catalog component, making these databases available within the SDI. By in-corporating this component, user’s requests can be forwarded to appropriate dataset(s). Results of such a query can then be downloaded from a central server or emailed to the customer. Large collections of air quality observa-tion and simulaobserva-tion data can be made available through the cooperaobserva-tion of as many data centres as required, and the physical location of these datasets becomes irrelevant. The only real problem to be overcome is the differing data policies established by data owners, but even this problem is changing as new approaches to public access regarded environmental information are adopted (e.g. the European Directive 2003/4/EC) [9].
2.1.1 ICT methodologies to construct the SDI
In an SDI, additional ICT tools and frameworks are more often required. These tools manage Web Sensors, Data Notification, Processing, and com-plex data Visualization. Furthermore, an SDI may manage a huge amount of data and processes like atmospheric chemical models that are coupled with meteorological models, for which the integration of a complex computational framework is required.
The importance of integration between different tools is also supported by the Open Geographic Consortium (OGC), which released standards like Sensor Web Enablement [13] or Web Processing Services [14] in order to integrate results coming from different processes.
The integration of such technologies requires a different approach in devel-oping an SDI, for example by using ICT methodologies often adopted in e-business. This flexible Information Infrastructure solves integration issues among SDI components by hiding the complexity of geographic systems to final users [16], who are often scientists or decision makers but often not IT experts. Moreover, they cannot always rely on having access to the full-time technical staff that is administrating these complex IT infrastructures, and hence, using an SDI allows them to remain focused on their area of expertise.
2.1.2 Type of data to be handled in the SDI
The SDI can handle information on air quality that is diverse yet unique to any particular project. In this case, the included data ranged from concentration of contaminants emitted into the atmosphere (or released to water and/or soil), to concentration of contaminants measured at permanent sites (as well as along dedicated monitoring campaigns). These meteorological parameters are the input for transport models aimed to draw chemical weather.
Outputs from models can be included in the SDI, and hence they can be used by policymakers to evaluate mid and long-term scenarios.
2.2 The SDI Architecture and Implementation
With the above parameters in mind, we developed and implemented an SDI as the cornerstone of a project with an integrated architecture, so that additional components could be plugged in as necessary [21]. Open-source components were used in building the Air Quality SDI. Postgis, Geoserver and Geonetwork were utilized for geographic data storage, export geographic web services, and managing metadata, respectively, whereas Javascript libraries embedded in OpenLayers [26] were used to display geographic information. These tools effectively made the SDI a pluggable system (a system built through com-ponents plugged together), and required additional effort to integrate the different components. To this end, both an effective client application and a
2.2 The SDI Architecture and Implementation 15
flexible software middleware were fundamental in crafting a common interface for the components involved in the SDI. Services and processes provided are now controlled through an Information Infrastructure (GeoInt), designed and developed at CNR-IIA, which wraps most useful processes in order to pro-vide high-level services (e.g. data integration and management) to final users. GeoInt, described in section 2.3, acts as middleware between users and the SDI in order to provide a more friendly interface to the data and processes managed by the Air Quality SDI.
The architecture of the Air Quality SDI was designed to provide geographic services for integration into a Service Oriented Architecture (SOA) like GI-IDA and GEOSS. SOA is now the primary orientation for development within the environmental sector.
Hereafter, the SDI Architecture is described through different viewpoints by using the terminology of the Reference Model of Open Distributed Processing (RM-ODP) (ITU-T Rec. X.901-X.904 — ISO/IEC 10746) [16] [27]. RM-ODP is a model used to describe complex ICT systems. The following RM-ODP viewpoints have been considered:
• Enterprise • Information • Computational • Engineering • Technology 2.2.1 Enterprise Viewpoint
The enterprise viewpoint focuses on the purpose, scope, and policies of a system. It provides the context and the overall environment within which the system will be built, and therefore indicates constraints and obligations that must be applied to all other viewpoints, therefore representing the global requirements that the SDI must respect. Through the Enterprise Viewpoint, the SDI quality is described from a stakeholder’s point of view.
2.2.1.1 Actor and Users
From the perspective of an end-user, an SDI should both organize information and resources and distribute them by providing their services via a single access point, often on line. Resources managed by an SDI should be geo-portals or catalogs of geographic Web Services oriented to users. In both cases the end-user should find resources through the access point by searching metadata.
Users accessing an SDI can be human operators or they can be Service Clients, namely Web Service Clients. With human operators, the SDI is used by data readers or data and metadata creators. In order to match requirements for this user category it is important to create tools to search geographic data
(necessarily based on metadata), allowing for detection based on keywords and geographic location.
In summary, three types of clients have been considered for the Air Quality SDI:
• Web based, oriented to specific products and projects related to the air quality theme or dedicated to decision makers in public organizations. • Desktop GIS, oriented to researchers, operators and data providers. • Web Service, compliant with a standard and designed for system
integra-tion and interoperability.
2.2.1.2 Functional requirements
In air quality information management data are the cornerstone for simula-tion models and decision-making systems. They are both widely distributed and heterogeneous, and so they are difficult to access in a coordinated way. The first step in making systems truly interoperable is to adopt agreed stan-dards for data storage, searching and distribution. Metadata will also enable the community to get information on the data within the SDI.
The second step is to produce data in a commonly recognized format. Hence, data storage can be virtual or even on a physical device, but it must be re-engineered and harmonized in order for more services to be produced from it. In many organizations, environmental information is based on proprietary formats and stored in local computers without any kind of metadata. This in-formation must be harmonized in order to foster multidisciplinary approaches and advanced analysis. An essential requirement of any SDI is a database that holds harmonized data and related metadata.
From the users point of view, creating metadata can be a tedious task, and the management of large XML files with verbose descriptions may discourage some operators. Organizations that manage large datasets need some tools that assist with the creation of metadata and its storage in a database. An additional point that discourages operators is the necessity of following stan-dards that are often updated or changed.
Metadata stored in the database will be used to search data. After this initial phase, visualization is the next critical requirement and visualized products should differ as a result of a different use of data. Here, metadata must indi-cate the access point related to data use. For example, web-based systems are browsed by end-users by means of geo-portals, in which geographic data are used to create high-level services in specific projects. These geo-portals are related to particular areas of interest, such as the monitoring of ozone pre-cursor emissions from facilities, or simply viewing a list of information layers contained in the SDI. Therefore, web-based systems are the preferred tools for realizing information systems that reach a wide range of users. Users need to interact with an SDI in all phases of data management: data and metadata creation, process management, data access, data searching, and, finally, visu-alization. To these ends, many tools have been developed that show data in
2.2 The SDI Architecture and Implementation 17
a user-friendly way (e.g. Openlayers). Still, an additional Information Infras-tructure that hides the complexity of the SDI and helps the data provider can be useful. Middleware, like GeoInt, help users add data and metadata without any direct interaction with the complex interface of the SDI.
2.2.1.3 Non-Functional requirements
In order to match new requirements that arise from new and changing sce-narios in e-Science and geomatic (Sensor integration, 3D supports), the SDI has crafted a modular approach, where each component implements a single feature and then talks with the others in order to perform the required ser-vices. With this approach a change in a functional component has a minimal impact on the system as a whole, because components are only loosely cou-pled. This architectural design allows for an easier system upgrade, and it adds scalability as new modules can be added to balance the load.
2.2.1.4 Integration Constraints
Interoperability and systems integration have become important in geographic systems, and SOA architectures have become popular even in geo-system ar-eas. The Air Quality SDI was created with the higher level GIIDA domain in mind.
The integration of the Air Quality SDI with GIIDA occurs primarily through the use of the OGC CS-W protocol, a protocol that allows for the ability to publish collections of metadata, geospatial data, and services and related resources. Thus, it is an integration based on the common use of metadata standards according to the INSPIRE directive. Interoperability enables data harmonization by linking more systems in a complex and robust distributed system, like in GIIDA or GEOSS.
2.2.2 Information Viewpoint
The information viewpoint is focused on the information semantics and in-formation processing that is performed. It describes the inin-formation managed by the system and the structure and type of content of the supporting data. It then describes the system in terms of data managed.
2.2.2.1 Data analysis and state of the art
Data analysis and infrastructure state of the art are crucial in understand-ing which kind of SDI to create. In the case of the CNR-IIAs project, data are related to contaminants holding geographical information (i.e. latitude, longitude, elevation, depth, chemical concentration), which are gathered from monitoring systems and numerical simulations running on parallel computing
clusters or existing datasets. Measurements, simulations and datasets must be integrated into the SDI by considering working methodologies. For example, some data have been collected in geographical containers (e.g. ESRI Shape-file). Data coming for past work represent essential background information for the planning and implementation of the Air Quality SDI.
GeoInt wraps any data source and provides an interface for final users in order to upload data and metadata in SDI databases. Data Sources can be managed by user (data file) or automatically managed in the data acquisition processes. To this end, it is strategic to provide integration between hardware and software components within the SDI, to minimize human actions in the data acquisition. This kind of integration is possible only with a flexible soft-ware middlesoft-ware, integrated directly into the SDI, where any source can be wrapped with a specific Software Layer.
2.2.2.2 Metadata: The knowledge description
Description of data stored in an SDI is as fundamental as the data themselves. Storing and organizing data requires it to be contextualized in order to give information on any collection methodology, lineage, spatial and temporal do-main, copyright, context of use, etc. Such documentation is called metadata. Metadata helps to organize and maintain data in order to:
• provide information on an organizations data hold in a catalogue form; • avoid duplication of efforts by ensuring the organization is aware of the
existence of data sets;
• help users to locate all available geospatial and associated data relevant to an area of interest;
• build upon and enhances the data management procedures of the geospa-tial community;
• promote the availability of geospatial data beyond the traditional geospa-tial community;
• advertise and promote the availability of their data and potentially link them to on-line services [6].
2.2.2.3 Thesaurus Integration
The Air Quality SDI was constructed with a thesaurus developed at CNR-IIA [18]. Indexing and searching by thesaurus to provide access to geo-information resources is still a quality issue in the Internet world. Nothing can be more frustrating than searching by subject when no indexing strategy is present: each searching session has to face all the uncertainties of natural language (synonymy, polysemy, homonymy) combined with all the uncertainties of a full text search (no relevance control on the retrieved occurrences). Moreover, most people realize that an indexing strategy itself is not enough, especially when we have to face either broad classification systems or indexing by using
2.2 The SDI Architecture and Implementation 19
natural language. With regard to broad classification systems, navigation in wide virtual ’containers’ is often a time-wasting operation; whereas in natural language indexing synonyms, polysemes, or homonyms limit and/or delay ef-ficient and effective information retrieval. These problems grow exponentially when large numbers of documents and multilingual contexts are involved. Adopting a thesaurus:
• guarantees the effective control of the indexing language, covering each se-lected concept with a preferred term (in each language, in the case of mul-tilingual thesauri) and ensuring inter-language equivalence among these descriptors;
• provides a systematic display of the descriptors, making navigation through the terminology easier;
• allows indexing and searching by combining several descriptors ex post, in order to refine and personalize both the semantic description and the information retrieval.
In this way, adopting a thesaurus creates results that balance the number of retrieved documents with their relevance. This was the reason behind the implementation of EARTh [18], a thesaurus oriented towards environmental issues that included a specific section for GIS terminology.
2.2.3 Computational Viewpoint
The computational viewpoint enables distribution through functional system decomposition into objects that interact by interface. It describes the architec-ture of an SDI by means of its components. This SDI has a classical three-layer architecture (shown in Figure 2.1) with a Data Storage Layer (DSL) connected to a Business Logic Layer (BLL), hosted in a Tomcat Server that is linked to the Application Layer (AL).
The core of the system is represented by the DBMS, which holds vector in-formation and functional data. The DBMS represents the DSL in the SDI ar-chitecture, and stores metadata and geographic data in separate databases to maintain a different logic structure for each type of data. Additional databases are dedicated to functional tasks and to information coming from web sensors. In detail, the following databases are contained in the DSL:
• g container: used to store geographic information;
• g metadata: used by Geonetwork for metadata stored in g container; • geoint: used by GeoInt to perform functional tasks;
• sos database: which contains data coming from web sensors.
The latter was a database designed by 52North [23] in order to match Sensor Web Enablement (SWE) specifications, which is connected to 52north SOS components deployed in the BLL, and is used to export sensor informa-tion. In the BLL, server components are plugged in to perform the system
Fig. 2.1. SDI Architecture showing the Data Storage Layer (DSL), the Business Logic Layer (BLL) and the Application Layer
functionalities like metadata management, data and map creation, and data dissemination. The components related to this layer are:
• GeoInt: the data producer and Information Infrastructure, oriented to the Geo Infrastructure;
• Geoserver: the map server;
• Geonetwork: the metadata manager and catalog; • EARTh: the Thesaurus used by the metadata editor. • GiCat: the Service Broker. [20]
The AL represents a set of tools oriented towards final users. This container holds Desktop GISs, Web GISs, Metadata viewers and data downloaders. Each component is described in more detail in the Engineering Viewpoint, within section 2.2.4.
2.2.4 Engineering Viewpoint
The Engineering viewpoint focuses on interactions between the distributed components of the system. Each component installed in the BLL and AL is described hereafter. The communication channel between components is real-ized through web links and REpresentational State Transfer services (REST) [22]. Until now, only the Thesaurus has been physically installed in Geonet-work as the Simple Knowledge Organization System (SKOS) services has not
2.2 The SDI Architecture and Implementation 21
been implemented.
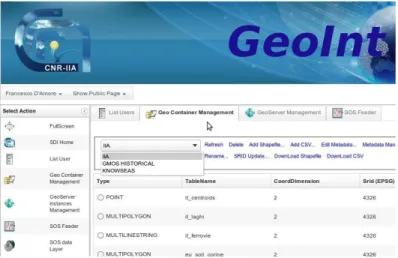
GeoInt (http://sdi.iia.cnr.it/geoint/) is the Information Infrastructure devel-oped at CNR-IIA that wraps the SDI in order to provide facilities related to data and metadata creation and harmonization to the final-user. With GeoInt, users can work with a set of tools that make using the SDI components easier, particularly with regard to data and metadata creation, sensors integration and process management. This tool allows users to create metadata that is compliant with European and international standards, like those detailed in the ISO 19139 and the INSPIRE Directive.
Geoserver (http://sdi.iia.cnr.it/geoserver) is a map server that exports data by creating Geographic Web Services, compliant with OGC (WMS, WFS, WCS). These services can be used directly by end-users in complex SOA sys-tems or geo-portals built with Web technologies. OGC services are also used by Geonetwork to integrate metadata with maps and other geographic data. Geonetwork (http://sdi.iia.cnr.it/geonetwork) is a tool used to manage meta-data. The metadata are exported via the CS-W 2.0.2 protocol, which is the basis for integrating the Air Quality SDI into complex systems. The tool allows links with Geographical Services such as WMS and correlation with different, even non-structured, data sources.
EARTh (http://ekolab.iia.cnr.it/earth.htm) is the Thesaurus linked within Geonetwork in order to support the metadata editing process.
GiCat (http://sdi.iia.cnr.it/gicat) [20] is a Service Broker used as a collector for Geographic Web Services. It supports several protocols like WMS, WFS, THREDDS, CS-W and accepts a wide variety of inputs, extracts informa-tion, and exports that information in a standardized protocol like CS-W. It is linked directly with Geonetwork to export metadata and to integrate the Air Quality SDI into a more complex System of Systems like those constructed within GIIDA or GEOSS. GiCat is a Service Broker developed at the ESSI-Lab (http://essi-lab.eu).
Some WebGISs (http://www.webgis.iia.cnr.it) were developed using services generated by Geoserver and are released to end-users by means of a geo-portal, where geographic data are used to create high-level services in specific projects related to particular areas of interest. The web-based systems are therefore ideal tools to realize information systems that reach a wide range of users.
2.2.5 Technology Viewpoint
The Technology Viewpoint is focused on the systems technology selection. It describes the technologies selected to provide processing, functionality and presentation of information. It examines products available in the market-place that are used to build the SDI. The SDI is based on the adoption of international standards. These are mainly OGC for data representation, and ISO19115 and INSPIRE, for metadata creation. Moreover, standards like WMS 1.1.1 and WFS 1.1.0 were adopted for data, and CS-W 2.0.2 was adopted for metadata dissemination through Geonetwork and GiCAT.
As outlined in the ISO 19139 standard, metadata are presented in an XML document. ISO 19139 defines Geographic MetaData XML (gmd) encoding, an XML Schema implementation derived from ISO 19115. XML is a mark-up language, widely used in ICT systems, aimed to describe any type of infor-mation regardless of the means by which this inforinfor-mation will be used or transmitted.
Geonetwork acts as a component plugged into the Air Quality SDI archi-tecture, so that metadata can be managed at all levels (metadata creation, storage, and management) and exported through OGC CS-W, the standard protocol used to describe it.
Data served by the SDI are often used in WebGISs. In order to develop such applications, javascript frameworks were used.
In our case we adopted Openlayers, which allowed us to develop applications with AJAX support. Openlayers is a very effective tool that can establish a connection directly to WMS services in order to develop effective, easy-to-use applications. These methodologies currently represent the most-used technique in the area of open-source WebGIS products and they offer excel-lent results. However, new methodologies for creating Web-based applications are available in the marketplace that can overcome a development approach based on Javascript.
2.3 GeoInt
GeoInt is the Information Infrastructure that was developed at CNR-IIA to provide data creation and harmonization. The architecture in Figure 2.2 shows interactions between the database, OGC services exported via Geoserver, and final users. GeoInt is an Enterprise Application, developed with Java and deployed in a Serverlet Container (Tomcat). The scope of this framework provides an infrastructure that centralizes data persistence, processes, services creation, processes control over geographic information, and geographic data storage management. It provides an AJAX web user interface in order to access features provided by the framework. The web interface of GeoInt was developed with ZK [24] in order to improve user friendliness and usability. ZK enables a declarative approach for web application and it can be very useful in order to develop complex web systems oriented towards data visualization. ZK is a Web Framework that allows to develop an AJAX interface without the direct use of Javascript. Figure 2.4 shows a screenshot of GeoInt during the selection of a DataSource.
In the following section we describe each component used in building GeoInt. 2.3.1 GeoInt Data Storage Management
As we described above, geographic data are stored in a Postgis database (see section 2.2). This database is managed through GeoInt by means of Data
2.3 GeoInt 23
Fig. 2.2. GeoInt Components Overview
Access Objects (DAOs). DAOs are patterns used in Software Engineering to decouple storage systems from software layers. In our case, there are DAOs objects that manage any given instance of data storage.
The DAO interface designed in GeoInt is the GContainerDAO. Few methods of the DAO interface are listed in the UML Class Diagram in Figure 2.3 GContainerDAO exports the CRUD (Create, Retrieve, Upload, Delete) op-eration on geographic objects stored in a vectorial storage device. DAO for raster data are in the development phase. In the next version of GeoInt, DAO interfaces for raster will be tested and deployed. GeoInt, without a DAO for raster, cannot handle this data directly. To date, raster data are stored in the File System and handled by Geoserver.
In the case of vectorial data, Postgis is the de facto open-source standard for geographical DBMS.
By using DAOs in GeoInt, we allow for the possibility of a switch from Postgis to a different storage system. In GeoInt, each vectorial data storage system can be activated by the implementation of a corresponding GContainerDAO. A user/developer that wants to enable a different storage strategy must pro-vide the specific implementation of GContainerDAO to obtain any selected strategy.
In addition, in GeoInt a specific DAO is used to perform user management and functional tasks, namely GeoIntDAO. GeoIntDAO defines a set of methods for user-notification, users roles, credentials on datasets and other functional tasks.
The design of the DAO system is described using UML (Figure 2.3). In each instance, the Postgis database, which is used and managed by GeoInt, is wrapped by an instance of PostgisContainerDAOImpl that implements the GContainerDAO in order to plug different Postgis Databases into GeoInt.
Developers with different user requirements will provide specific implementa-tions of GContainerDAO, such as OracleContainerDAOImpl, MySqlContain-erDAOImpl, and others, depending on the storage devices being used. The GContainerDAO and GeoIntDAO are collected in a Fa¸cade. Often used in Software Engineering, The Fa¸cade pattern is a very useful strategy for of-fering a direct interface into a complex system. In this case, components in the second layer of Figure 2.2 can manage any object by means of the method provided by the Fa¸cade. This approach demonstrates a more robust Software Architecture and a more flexible use of the underlying resources.
Fig. 2.3. Fa¸cade and DAO in GeoInt
For example, to switch from one Postgis database to another, a user must provide the Fa¸cade with the appropriate instance of PostgisContainer-DAOImpl, even at run time. This is possible through the GeoInt web interface (Figure 2.4), once the current user has the appropriate credentials to use the selected database. The Business Logic Component and other Software Layers that use the Fa¸cade can use the method without gaining awareness of the type and location of the new data storage. Furthermore, the Fa¸cade is used by components hosted in the higher-level layer of the GeoInt architecture, in order to manage different data sources.
2.3 GeoInt 25
Fig. 2.4. GeoInt. Select a DataSource
Spring [23] is used as IoC framework in GeoInt. IoC is a pattern that en-ables a flexible setup of complex enterprise applications, which are used as Application Context in order to setup any component (and the relationship between components). Spring is used to manage not only DAO components, but also Connections Pools (C3PO), JDBC Data Sources, Logging compo-nents (Log4j), and services like mail systems and application utilities. All components are linked together by means of the Spring framework, at startup in GeoInt.
2.3.2 OGC Service Creation with GeoInt: Geoserver Integration Figure 2.2 shows the Architecture wherein there is a layer that contains the business logic to perform data process and services. This layer, where appro-priate, is stored and by the Fa¸cade. This BLL can also contain services used to integrate GeoInt with additional software components.
The communication component between GeoInt and Geoserver is fundamental to exporting data stored in the geographic databases through OGC Web Ser-vices (OWS). For this we used the RESTfull endpoint provided by Geoserver, which helps to manage the map server thereby making it possible to add a new WMS/WFS service programmatically by means of a RESTfull operation. A UML sequence diagram showing the process is reported in Figure 2.5. Through GeoInt, users can select a Geodatabase and finally a georesource. They can create a OWS Service by means of GeoInt, which will send a com-mand to Geoserver and get a return end point of the service created. This end point is managed directly by GeoInt.
management to the final users of an SDI, as GeoInt can manage the creation of a resource and the creation of Geo Services compliant with OGC standards through a single interface.
Fig. 2.5. Service Creation with GeoInt
2.4 System Integration
The Air Quality SDI is federated in the GIIDA domain that acts as System of Systems (SoS). The Air Quality SDI, like all GIIDA SDIs, exports infor-mation by means of CS-W protocol or other standard protocols by means of a brokering catalog, namely GiCat.
The central node of GIIDA acts as a Brokering Service by utilizing GiCat. Data coming from different partners are then collected and processed in the central node. This Brokering Service allows final users to exploit data and ser-vices provided by multiple nodes as if they were coming from a unique data source. Therefore, the top-level GIIDA domain offers integrated services to end users or to a more complex SoS (E.g. GEOSS), as if it were a collection of data owned by GIIDA partners.
Fig. 6 shows the integration schema adopted by the Air Quality SDI within the GIIDA framework. Concurrent partners of GIIDA can implement different SDI architectures, but all of them interact with the central node by means
2.5 Geo Services Factory 27
of well-known data protocols managed by a GiCat instance installed in the central node.
Fig. 2.6. Integration of the Air Quality SDI within GIIDA domain
This service interface standardization enables the decoupling of the SDI implementation from the external world: the local architecture can be modified in some component without affecting interaction with final users. To this end, final users do not see internal changes and their approach to the SDI remains unaffected in terms of complexity. This allows for a high level of flexibility, which is essential when the SDI must be integrated into the SoS.
2.5 Geo Services Factory
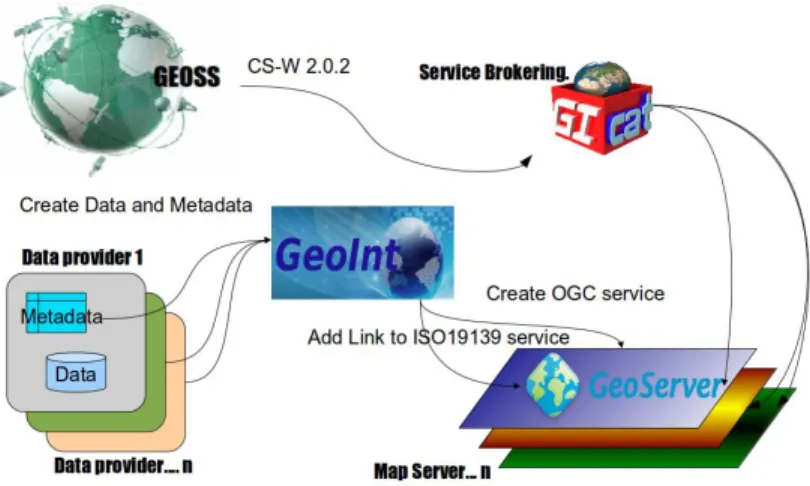
Fig. 1 shows the schema designed in order to improve GeoInt as Geo Service Provider. The idea is to minimize the numbers of component required by the SDI in order to match users requirements. Users can upload data and metadata in GeoInt by means of services provided by the middleware and its Web User Interface. GeoInt permits to upload many data format as CSV (Plain text) or Shapefile. For any dataset uploaded it is possibile to upload also a metadata related, using different formats. In this way users can use their own metadata editor in order to create a metadata. For particular projects
managed by GeoInt, the system can provide also an application form in order to create metadata. In both case, GeoInt store data and metadata, exposing metadata trough a REST link. GeoInt manages also GeoServer Instances, an open source map server capable to export OWS (OGC Web Service). Users can decide, by means of GeoInt, the Geoserver instances to use in order to export data as OWS service. OWS permit to include a link for Metadata and GeoInt will include in each OWS service, the REST link created before for metadata. Gi-cat, as service Broker, will collect any OWS, using the metadata link in order to create a set of information about data. The metadata collected will use by Gi-Cat in order to create a Web Geo Portal or to include information in complex System of System, such as GEOSS. Gi-cat is core stone of metadata process as it can collect metadata information from many type of data format and export trough different data protocol.
Fig. 2.7. The process schema that shows how data and metadata are uploaded in GeoInt, managed by Geoserver and Gi-cat and integrated in GEOSS
The design showed in Fig. 1 is a draft and currently only some of its features are implemented. We aim to create a complex middleware capable to minimize the efforts of users. In order to match this requirements, a workflows system as showed in Figure 2.7 is need, where few components interoperate toghether.
Part II
3
The GMOS Project
Mercury is emitted into the atmosphere from a variety of anthropogenic and natural sources. Of the anthropogenic sources, among the most important are fossil fuel combustion, smelting, cement production and waste incineration, while the oceans are the largest natural source of Hg to the atmosphere, vol-canism also makes an important contribution [15]. Most mercury emissions are of elemental Hg but anthropogenic emissions also include Hg in different chemical and physical forms. Mercury cycling between different environmen-tal compartments depends on the dynamic of chemical and physical processes (oxidation, dry deposition, wet scavenging) which influence its transport and residence time in the global environment. It has been suggested that due to intensified anthropogenic emission of mercury into the atmosphere since the beginning of industrialization this global Hg pool has increased in the past 150 years.
Evidence of long-term changes in the atmospheric mercury burden have been derived from chemical analysis of lake sediments, ice cores, peat deposits and firm air records [15]. These studies identify a peak in the atmospheric mer-cury concentration during the 70s in the Northern Hemisphere. A growing number of these records from both hemispheres demonstrate approximately a threefold increase of mercury deposition since pre-industrial times. In prin-ciple, an increase in the global atmospheric pool should also be reflected in the background concentration. However, since the first reliable measurement data were published just 30 years ago, it is extremely difficult to determine a global trend from the existing spatially and temporally inchoate air concen-tration data sets. For example, Asian mercury emissions are believed to have rapidly increased over the last decade, however, this is not reflected neither in the long-term measurement of Total Gaseous Mercury (TGM) at Mace Head, Ireland covering the period between 1996 to 2006, nor in the precipitation data of the North American Mercury Deposition Network (MDN).
Currently, there is no coordinated global observational network for mercury that could be used by the modelling community or to establish recommen-dations to protect human health and ecosystems on a global scale. Current
national/regional monitoring networks are inadequate: they lack, (1) observa-tions of all forms of Hg in the ambient air and in both wet and dry deposition samples; (2) long-term measurements of Hg and other air pollutants; (3) com-prehensive monitoring sites at altitudes which permit the sampling of free tropospheric air; and (4) measurement sites that allow a careful investigation of inter-hemispheric transport and trends of background concentrations. Recognizing that TGM and Hg in wet deposition are spatially heterogeneous, several studies have aimed to set up monitoring networks in order to compare trends between sites in the same region, between regions, and to determine the influence of local and regional emission sources. There is also interest in understanding the processes that contribute to Hg variability on a diurnal, weekly, seasonal, and annual basis. In 1995, Fitzgerald argued for and defined the basic requirements of an Atmospheric Mercury Network (AMNet). This has partly been accomplished on a regional scale within the Canadian Atmo-spheric Mercury Network (CAMNet), which may be considered as seminal in this respect. Part of the CAMNet contributes also to the Arctic Monitoring and Assessment Program (AMAP) under the Ministry Council of Circum Po-lar Countries and where there is also contribution from the Scandinavian coun-tries, e.g. on Greenland. Nevertheless, although the number of atmospheric Hg monitoring stations has increased, the database is sparse, especially in remote locations.
The Global Mercury Observation System (GMOS) project was estab-lished in support of the Group on Earth Observations (GEO) 2012-2015 work plan and the task HE-02-C1,”Global Mercury Observation System”. This task supports the achievement of the goals of GEOSS and other on-going interna-tional programs, including the UNEP Mercury Program, as well as major in-ternational conventions, such as the UNECE-LRTAP TF HTAP. The overall goal of GMOS is to develop a coordinated global observation system for mer-cury, including ground-based stations at high altitude and sea level locations, ad-hoc oceanographic cruises over the Pacific, the Atlantic and the Mediter-ranean, and free tropospheric mercury measurements. This will provide high quality data for the validation and application of regional and global scale atmospheric models, to provide concrete findings that can be used to support future policy development and implementation.
The specific objectives of GMOS are:
1. To establish a global observation system for mercury able to provide am-bient concentrations and deposition fluxes of mercury species around the world, by combining observations from permanent ground-based stations, and from oceanographic and tropospheric measurement campaigns. 2. To validate regional and global scale atmospheric mercury modelling
sys-tems able to predict the temporal variations and spatial distributions of ambient concentrations of atmospheric mercury, and Hg fluxes to and from terrestrial and aquatic receptors.
3.1 GMOS Interoperable System 33
3. To evaluate and identify source-receptor relationships and their tempo-ral trends for current and projected scenarios of mercury emissions from anthropogenic and natural sources.
4. To develop interoperable tools to allow the sharing of observational and models output data produced by GMOS, for the purposes of research and policy development and implementation as well as for enabling societal benefits of Earth observations, including advances in scientific understand-ing in the nine Societal Benefit Areas (SBA) established in GEOSS. In order to achieve these goals, a coordinated international scientific ef-fort is needed to enable users throughout the world to openly share and put to use vast quantities of global mercury data, thereby advancing scientific re-search in many disciplines, promoting technological and economical evaluation of abatement technologies implementation, facilitating impact assessment on environment and human health, establishing benefits in enhancing the quality of life of members of society. The importance of making mercury data openly available to all countries and individuals is underscored by various interna-tional agreements. Data-sharing in GMOS is an important way to increase the ability of researchers, scientists and policy-makers to analyse and trans-late data into meaningful assessments of mercury impact on environment and human health, reports and knowledge. Data sharing also discourages dupli-cation of effort in data collection reducing use of resources in data collection; encourages diverse thinking, as other researchers are able to use the data to answer questions that the initial data collectors may not have considered; en-courages accountability and transparency, enabling to validate one another’s findings; and allows for comparisons that cross national and regional bound-aries.
In the next sections will be described some components of the SDI developed for GMOS project and Air Quality Management [19].
3.1 GMOS Interoperable System
Within GMOS project will be developed tools (i.e. databases, catalogs, ser-vices) to collect GMOS datasets, harvest mercury databases, offer services like search, view and download spatial datasets from the GMOS portal (www.gmos.eu). The system will be developed under the framework of the In-frastructure for Spatial Information in the European Community (INSPIRE) Directive and the Directive 2003/4/EC on public access to environmental in-formation, which aim to make available relevant, harmonised and high quality geographic information to support formulation, implementation, monitoring and evaluation of policies and activities which have a direct or indirect impact on the environment. It is proposed to establish three data bases (emissions, field data and model results) which will be equipped with state-of-the-art and opensource software to allow highest performances. Web-based user interfaces
and prototype applications will be developed to demonstrate the potential of blending different data sets from different servers for environmental assess-ment studies.
Several services (i.e. catalog browsers, WMS and WCS services, web GIS services) will be developed to facilitate data integration, data re-use, and data exchange within and beyond the GMOS project. Different types of mea-surement and model datasets provided by projects partners and from other sources will be integrated in PostgreSQL-PostGIS, harmonized by creating metadata INSPIRE compliant and make it available to a larger community of stakeholders, policy makers, scientists, NGOs as well as other public and private institutions, as dictated by the Directive 2003/4/EC. Since interoper-ability is a central concept of the Global Earth Observation System of Systems (GEOSS), the Global Monitoring for Environmental and Security (GMES) and the INSPIRE Directive, the guidelines developed in these frameworks will be adopted. The use of standards is a key concern along the encoding process. International standards for data and spatial schemas (ISO19107, ISO14825), for metadata (ISO19115:2003, ISO/DTS19139:2005, ISO15836) and for ser-vices (WMS 1.1.1, WFS 1.0, SLD 1.0, GML 3.1) will be used. On the other side for data exchange XML together with SOAP, XSD, J2EE (for applica-tions development) and W3C for standard interfaces will be the reference standards.
With specific reference to GMES, the global database on mercury monitoring and the model output resulting from GMOS will be made available in terms of series of monitoring, forecast and reanalysis services. The GMOS operational services will hopefully contribute to the Monitoring Atmospheric Composition and Climate (MACC) project by providing access to atmospheric environmen-tal services.
In order to define a framework for data sharing in GMOS, the Work package 9 (WP9) will be structured in five Tasks:
• Task 9.1: System architecture definition
The goal of this task will be the definition of the overall system architec-ture. It will have an overview of existing architectural approaches in the framework of INSPIRE. The system architecture has to consider multi-level data communication and processing. The system architecture will integrate methods for data collection at the lower end, methods for data processing and data fusion on the middle layer, and methods for data pre-sentation and portal solutions on the top layer. All layers will have distinct requirements regarding communication models, time constraints, data for-mats and sizes, and security and access control as well as open-source software selection.
• Task 9.2 Data Collection tools development
The goal of this task is to develop the data collection tools and to set up of the communication and networking between the collection tools at the front end (monitoring sites and model outputs). This task has tight