a
Doctoral thesis in XXXII cycle
Burial evolution of sedimentary successions in the
Lurestan Basin, NW of Zagros Folded Belt, Iran
PhD candidate
Cobra Mahdikhani Sarvejahani
Supervisor Advisor Prof. Luca Aldega Dr. Mehdi Sarfi
Prof. Sveva Corrado
b
To my parents
c
Abstract
The main objective of this thesis is to unravel burial evolution and thermal-maturation history of the Mesozoic-Cenozoic sedimentary successions of the Lurestan basin in NW Zagros, Iran by integrating petrographic (e.g.vitrinite reflectance) thermal parameters and inorganic (e.g. illite content in mixed layers I-S) thermal parameters derived by the optical analysis of the organic matter dispersed in sediments and by XRD diffraction analysis of clay minerals. The integration of vitrinite reflectance and illite content in I-S may provide important pieces of information on heating rates that cannot be provided by a single indicator. Vitrinite can be used to estimate the degree of maturation of organic matter at low to high temperatures, even to the graphite-grade metamorphic facies. By the1D modeling provided, maximum temperature experienced by the Lurestan sedimentary and the amount of eroded material through time will be determined. Then thermal maturity and quality of source rocks providing insights for hydrocarbon generation and exploration will be determined by Rock-Eval pyrolysis results.
The samples collected from eight wells and two sections. Results obtained from organic and inorganic laboratory analysis have been described in the chapter 4 and then integrated for making 1D modeling by Basin Mod1 software and discussed in chapters 5 and 6.
Data obtained in this Ph.D. work, in fact, were used to characterize and discriminate the thermal evolution of the Mesozoic and Cenozoic sedimentary succession by focusing more on the Garau Formation as a main source rock in the Lurestan basin.
1D modeling indicate that illite content in I-S is a better paleothermal indicator than vitrinite reflectance in the Lurestan basin. Vitrinite reflectance showed a complex distribution of organic macerals with a wide range of values in most of the wells without a clear trend as a function of depth. In addition, organic thermal indicators often point to higher levels of thermal maturity than those recorded by clay minerals.
d This could be due to some reasons as following:
High vitrinte reflectance values are generally due to dishomogeneity of the organic matter surface, proximity to bright components such as pyrite, size of the particles, orientation of vitrinite fragments due to surface relief/irregularities, mixture of fragments (suppressed/reworked) with the indigenous population of vitrinites, and surfaces with imperfections or "noise" - scratches, (Borrego et al., 2006). Vitrinite macerals can also have different hydrogen contents that may affect thermal alteration. Hydrogen-poor and oxygen-rich vitrinites show higher levels of thermal maturity than those recorded hydrogen rich-vitrinite fragments. Also, vitrinite macerals can be reworked or organic matter can be used as additive during drilling procedure (NIOC personal communication) clouding the thermal signal due to burial.
Burial histories calibrated by inorganic thermal parameters revealed a decrease in levels of thermal maturity form the internal to the external part of the Zagros belt. In particular, in the internal part of the belt the Garau Fm experienced maximum sedimentary burials in the order between 3.95 km and 5.45 km and maximum temperatures between 124 and 169°C whereas lower burial conditions occurred in the external part (between 3.65 and 4.9 km) with associated temperatures in the range of 114 - 156°C. These values directly come from the 1D modeling. The onset of hydrocarbon generation for the Garau Fm. occurred before the folding stage of the Zagros belt, from Maastrichtian to early Eocene time. The thickness of eroded rock units decreases toward the external sectors as well from 1.8 - 3km to 1.2 - 2.4 km. Exhumation took place in late Miocene in the internal part of the belt and in early Pliocene time in the external part according to the age of growth strata in the Agha jari and Bakthiari Fms. The base age of the Agha jari Fm is Upper Miocene.
e
The thickness of the Garau Formation in internal part ranges between 577 and 799 m and in external ranges between 200 and 1000 m. The bigger thickness of the Garau Formation is in Kabir Kuh anticline.
The Garau Formation by the maximum burial indicate middle mature stage (the Huleylan #1, Mahi Dasht #1, Bankul #1, Samand #1 wells, and Kabir Kuh section), late mature (Baba Ghir #1, Darreh Baneh East #1 wells, and Tang-e Haft section) and overmature stages of hydrocarbon generation and main gas zone (North Shah Abad #1 well). The onset of hydrocarbon generation in the North Shah Abad #1, Baba Ghir #1, Samand #1 wells, and Kabir Kuh and Tang-e Haft sections occurred in the Late Cretaceous time (pre-folding stage), earlier than the other wells, and in the Bankul #1, Mah Dasht #1, Darreh Baneh East wells occurred in the Early Eocene time (pre-folding stage). The onset of hydrocarbon generation in the Huleylan well occurred later than the other wells in the Paleocene time occording the modeling.
Vitrinite reflectance data present the late mature and overmature stage of hydrocarbon generation for the wells and sections in internal and external part except Huleylan #1 well that vitrinite reflectance value ranging between 0.61% -0.89% that indicate the peak maturity level for producing of oil.
Clay mineralogy data define their paleo-temperatures as they provide a signal throughout the entire sedimentary succession. Respect to Merriman and Frey’ chart ( figure 3.2.1.1), all the samples belong to internal and external part of the Lurestan basin have a potential of producing of hydrocarbon except Darreh Baneh East #1 by random structure Ro and I% in Mixed layers I-S between 46 and 65%. The HI versus Tmax graphs also indicate that the sediments are of type III kerogen and gas prone and they are mature (early - late) and overmature. The TOC contents in all samples of the Garau Formation show a wide range of hydrocarbon potential from poor to excellent. The plot of S1 vs.TOC and show the presence of indigenous hydrocarbon in all samples.
f
Keywords: burial evolution, clay mineral assemblages, vitrinite reflectance, Rock-Eval, 1D modeling, Lurestan basin
g
Acknowledgement
The development and completion of this thesis would not have been possible without the input and support of several individuals. Firstly, I am most grateful to my supervisor, Prof Luca Aldega, Sapienza University, for giving me the opportunity to research under his leadership and guidance. Secondly, it is a pleasure to thank Prof. Ralf Littke for his kindness and hospitality and supporting throughout Lab working in Institute of Geology and Geochemistry of Petroleum and Coal, Aachen, Germany. I really appreciated Dr. Alireza Baniasad in Institute of Geology and Geochemistry of Petroleum and Coal, Aachen, Germany for his advices and supporting me to work to the best way.
Many thanks are due to Prof. Carlo Doglioni who was most generous by financial supporting me to finish my laboratory work in Aachen.
I wish also to express my appreciation to all members of Exploration Directorate of NIOC, who have directly or indirectly helped me during my research by providing all facilities and data: Ing. Saleh Hendi president of the Exploration Directorate of NIOC for giving me an opportunity to have a collaboration with them in Exploration Directorate. I really apreciatate of the Geochemistry sector, Dr. Mehrab Rashidi, Dr. Tahmasebi, Dr. Manoochehr Daryabandeh, Dr. Rahim Bagheri Tirtashi, and Dr. Mohsen Yazdi Moghaddam.
My special thanks to Dr. Mehdi Sarfi for all supporting me by providing the surface samples, geological maps etc.
I am thankful to Prof. Sveva Corrado for her permission to use the Basin Mode1D software in the laboratory of Roma Tre University
I am truly grateful to Mr. Sergio Lo Mastro,Roma Tre University, heling me to do the X-ray diffraction analysis, and Miss. Donka Macherey and Kerstin Windeck in laboratory of Institute of Geology and Geochemistry of Petroleum and Coal, Aachen, for preparing my samples for vitrinite reflectance and TOC measurement.
h
Finally, my inexpressible thanks go to my very nice friends, Dr. Ahmad Rabiee, Dr. Ali Dashti, Dr. Hashem Sarafdokht, Luigi Marino and all my friends for their advice, support and giving me the confidence to work to the best of my ability.
i
Contents
Chapter 1 - Introduction ... 1
1.1 Introduction ... 1
1.2 Summary of motivations and goals ... 3
1.3 Previous studies: ... 3
Chapter 2 - The geological setting and the sedimentary successions of the Lurestan basin ... 6
2.1 Geological setting ... 6
2.2 Sedimentary succession of the Lurestan basin ... 9
2.3 Petroleum system ... 14
2.3.1 The Middle Jurassic petroleum system: Sargelu formation ... 14
2.3.2 The Early Cretaceous petroleum system, Garau Formation ... 15
2.4 Location and description of the wells and outcrops ... 17
2.4.1 Huleylan #1 well ... 17
2.4.2 Mahi Dasht well #1 ... 20
2.4.3 Darreh Baneh East #1 well: ... 20
2.4.4 The North Shah Abad well # 1 ... 23
2.4.5 Bankul #1 well ... 23
2.4.6 Baba Ghir #1 well ... 26
2.4.7 Samand #1 well ... 26
2.4.8 Kabir Kuh ... 29
2.4.9 Tang-e Haft surface section ... 31
Chapter 3 - Materials and Methods ... 34
3.1 Sample Collection and Preparation ... 35
3.2 Methods ... 39
3.2.1 Terminology for mixed layers illite-smectite ... 39
3.2.2 Organic matter Optical analysis (Vitrinite reflectance measurements) ... 45
3.2.3 Rock - Eval pyrolysis ... 51
3.2.4 1D modeling ... 54
Chapter 4 – Results ... 55
j
4.1.1 Clay mineralogy ... 55
4.1.2 Vitrinite reflectance measurements ... 59
4.1.3 Geochemical Characteristics ... 63
4.2 Mahi Dasht #1 well ... 66
4.2.1 clay mineralogy... 66
4.2.2 Vitrinite reflectance measurement ... 71
4.2.3 Geochemical Characteristics ... 72
4.3 Darreh Baneh East #1 well ... 73
4.3.1 Clay mineralogy ... 73
4.3.2 Vitrinite reflectance measurements ... 77
4.4 North Shah Abad #1 well ... 82
4.4.1 Clay mineralogy ... 82
4.4.2 Vitrinite reflectance measurement ... 85
4.4.3 Geochemical Characteristics ... 87
4.5 Bankul #1 well ... 90
4.5.1 Clay mineralogy ... 90
4.5.2 Vitrinite reflectance measurements ... 94
4.6 Baba Ghir #1 well ... 99
4.6.1 Clay mineralogy ... 99
4.6.2 Vitrinite reflectance measurement ... 102
4.6.3 Geochemical Characteristics ... 105
4.7 Samand #1 well ... 106
4.7.1 Clay mineralogy ... 106
4.7.2 Vitrinite reflectance measurements ... 109
4.7.3 Geochemical Characteristics ... 113
4.8 Kabir Kuh ... 115
4.8.1 Clay Mineralogy ... 115
4.8.2 Vitrinite reflectance measurement ... 118
4.8.3 Geochemical Characteristics ... 122
4.9 Tang-e Haft ... 124
4.9.1 Clay mineralogy ... 124
k
4.9.3 Geochemical Characteristics ... 130
Chapter 5 - 1D modeling ... 132
5.1 Huleylan #1 well ... 135
5.2 Mahi Dasht #1 ... 138
5.3 Darreh Baneh East #1 well ... 140
5.4 North Shah Abad #1 ... 143
5.5 Tang-e Haft section ... 146
5.7 Bankul #1 well ... 150
5.8 Baba Ghir #1 well ... 153
5.9 Samand #1 well ... 155
5.10 Kabir Kuh section and well ... 158
Chapter 6 – summary of the results and discussion ... 161
Summary of the results ... 161
Discussion ... 166
Chapter 7 - Conclusion... 169
Chapter 8 - References ... 171
1
Chapter 1 - Introduction
1.1 Introduction
The Zagros fold-and-thrust belt which extends for about 2000 km through Iraq and southern Iran and is the most resource-prolific fold-thrust belt of the world with numerous giant hydrocarbon fields (Alavi, 2004). The fold-and-thrust belt is a result of Neogene convergence and subduction of the Arabian Plate beneath the Iranian block (Berberian and King, 1981) and consists of folded and faulted rocks composed of 4 to 7 kilometers of Paleozoic and Mesozoic successions which overlain by 3 to 5 kilometers of Cenozoic siliciclastic and carbonate rocks resting on metamorphic Proterozoic Pan-African basement.
The deformation front of the Iranian part of the belt is characterized by two major bulges, as the Coastal Fars and Lurestan salient that are separated by the Dezful Embayment. The Lurestan area in the NW of the Zagros Fold and Thrust Belt has a long history of hydrocarbon exploration and production especially for unconventional resources but relatively few wells drilled in this area have been successful.
The Lurestan region presents high-quality source rocks such as the Early Cretaceous Garau and Middle Jurassic Sargelu formations (Zeinalzadeh, 2015) and regional seals (Gotnia and Gachsaran), and the Cenomanian Sarvak Formation as a major reservoir unit even if permeability varies s considerably due to variations in depositional facies and diagenesis.
The Zagros Fold and Thrust Belt contain about 8% of the global oil reserves. Despite the numerous studies of the Zagros fold and- thrust belt which have been carried out in the Dezful Embayment, Fars and the Persian Gulf., relatively little studies work has been conducted in Lurestan basin concerning the importance of Garau and Sargelu formations as main source rock in the Lurestan basin (e.g. Aqrawi and Badics 2015; Bordenave 2002; Bordenave and Burwood 1990; Bordenave and Huc 1995; Mahbobipour et al. 2016; Khani et al., 2018; Kamali et
2
al., 2006; Ezampanah, 2012). Similarly, the age equivalents of these formations have been extensively studied in terms of organic geochemistry and hydrocarbon generation behavior in the Iraq basin (Al-Ameri et al. 2014; Mafi et al. 2014; Mohialdeen et al. 2015; Sachsenhofer et al. 2015).
Understanding of the burial history and maturity of these source rocks are of primary importance for oil exploration activities. Regional variations in the maturity of source rocks would be useful for finding the location of the hydrocarbon in the study area.
The main purpose of this project is to provide the burial evolution of the sedimentary succession in the Lurestan basin, NW of the Zagros fold-and-thrust belt, focusing on the Sargelu and Garau formations as main source rocks and determine timing of hydrocarbon generation of the Garau Fm in this area and eventually draw some implications for future explorations within the Lurestan basin.
To constrain burial models, we integrate clay mineralogy, vitrinite reflectance, and Rock-Eval pyrolysis analyses, to provide new constraints to the quantitative thermal evolution and burial history of sediments in the Lurestan basin. We used for the first time in the Zagros, X-ray diffraction of the clay-size fraction of sediments. This study shows how inorganic thermal parameters derived from clay minerals can be used as indicators of thermal maturity of sediments and as a tool for hydrocarbon exploration where organic matter is lacking or scarcely preserved (e.g., shallow water oxic conditions or continental deposits). This integration may provide important pieces of information on heating rates that cannot be provided by a single indicator (Hillier et al., 1995).
Vitrinite reflectance can be used to estimate the degree of maturation of organic matter in diagenesis and very low-grade metamorphism as it increases irreversibly with temperature and depth (Dow, 1977; Stach et al., 1982), even to the graphite-grade metamorphic facies. X-ray diffraction of clay minerals shows how inorganic thermal parameters derived from clay minerals can be used as indicators of thermal maturity of sediments and as a tool for hydrocarbon exploration in
3
areas where organic matter is lacking or scarcely preserved (Pollastro, 1993). Rock-Eval pyrolysis is a technique which allows quantifying the type and amount of hydrocarbon generated from a specific source rock and to assess its potential (Espitalie et al, 1985).
To constrain burial models, samples collected from 8 wells and two outcrop sections. 1D modeling provides information on the thermal evolution of sedimentary successions in fold-and-thrust belts and allows quantifying the maximum burial the rocks underwent (e.g., Pollastro, 1990; Mählmann, 2001; Di Paolo, 2012). These techniques also reconstruct the thickness of eroded sedimentary or tectonic overburden (Aldega, 2007a and b; Aldega, 2011). These kinds of information are of primary importance for oil exploration studies because they provide insights on source rock thermal maturity.
1.2 Summary of motivations and goals
1) The main purpose of this study is to unravel burial evolution of the Mesozoic-Cenozoic sedimentary successions of the Lurestan basin
2) The 1D modeling provided, allow to quantify the maximum burial thickness of the stratigraphic section and therefore provide an estimation as to the thickness of the stratigraphic section removed by erosion and/or tectonics.
3) 1D modeling also indicates the maximum temperature experienced by the successions through time.
4) Then thermal maturity and quality of source rocks providing insights for hydrocarbon generation and exploration will be determined by Rock-Eval pyrolysis results.
1.3 Previous studies:
Geological surveys started systematically in the south-west of Iran contemporaneously with the Iranian activities oil company in the 20th century.
This area was extensively studied after discovering the oil field in Masjed Soleiman in 1908 by English Iranian geologists and later by experts of English
4
Iranian oil companies. The National Iranian Oil Company published some geological maps at the 1:250000 scale with structure interpretation in 1959. Many studies focused on the tectonics, stratigraphy and hydrocarbon generation's potential of the basins in the southwest of Iran.
For the first time, James and Wynd (1965) studied the characterictics of the Garau Formation (Early cretaceous) and they checked the stratigraphy and petrology of all formations in Fars, Outer Fars, Khuzestan and Lurestan regions. The Garau Formation is derived from the Tang-e Garau outcrop in Kabir-Kuh of the Lurestan. The Garau Formation is at maximum 1000 m thick, alternating with radiolarian dark clay lime with bituminous pyrite and chert black shales containing ammonite and belemnite. The lower boundary of the Garau Formation is mainly characterized by evaporite sediments of Gotnia, and its upper boundary (Ilam, Fahlyan and Sarvak Formations) is variable in different regions. They introduced the biostratigraphic units in the southwest of Iran. Pairaudeau (1976) studied subsurface correlation of the Garau Fm and Bangestan group in the Lurestan basin.
Navidtalab and coauthors studied on the depositional environment and sequence stratigraphy of the Garau Formation (Navidtalab et al. 2013 and 2014) and identification of five microfacies related to the deep basin along with palynological factors (AOM ratio, AOM%, phytoclast ratio, and phytoclast %) and their variations in the stratigraphic column led to identification of the relative sea-level changes during the Cretaceous time.
Sarfi (sarfi et al., 2014) studied the Garau Formation in the Lurestan and indicated to presence of planktonic foraminifera so the depositional environment of the Garau Formation is marine. Therefore, kerogen must be type II and with high maturity and high temperature kerogen are changed and show the different type but originally, they are type II, originated by marine environment.
Bordenave et al., (2014) worked on petroleum systems and distribution of the oil and gas fields in the Zagros and identified that two main source rock in the Lurestan basin, Middle Jurassic (Sargelu) and Early Cretaceous (Garau), contain
5
almost no reservoirs associated with the source rocks. Most of their oil could not be expelled and was cracked in situ to pyrobitumen and gas.
The Garau Formation and the Bangestan Group are investigated by Pairaudeau, (1976) in terms of terrestrial and source rock adaptations. (Akhtari et al., 2006) by studying the palynomorphs determined the age of Berraian-Abtian for Garau Formation and respect to changing the color of palynomorphs, their maturity is suitable for the production of hydrocarbon. Daneshgar (2012) studied for his master thesis about Palynology and hydrocarbon potential of the Garau Formation in Huleylan well in Lurestan and he considered existing kerogen type II and probable hydrocarbon gas. Yousefi (yousefi t al., 2015) studied the Garau Formation in Tang-e Haft section. He considered kerogen type III and type II, which are able to produce gas and oil. Amount of Total Organic Carbon (TOC) is in the range of fair to very good and S2 values are low and according to high thickness of the shale layers, it has a high ability to produce significant amounts of hydrocarbons.
Saura et al., (2011 and 2012) studied the basin architecture and growth folding and carbonate distribution of the Amiran basin during the Late Cretaceous and early Tertiary in the south of Lurestan. Organic geochemistry and petroleum potential of Early Cretaceous Garau Formation in the central part of the Lurestan zone, northwest of the Zagros, Iran has been studied (Mahbobipour et al., 2016). The results show that biomarker composition of the Garau facies is dependent on the relative contributions of planktonic and benthonic organisms, bacteria, and terrigenous organic matter transported from the nearby landmass. Most samples are thermally mature and some of them are in post mature stages with types of II-III and II-III kerogens suggesting a significant high contribution of marine organic matter with minor terrigenous organic matter contribution.
The Garau Formation has been studied from the aspect of geochemical, geological, and petrophysical evaluation in Lurestan basin and is determined its brittleness index as a shale gas prospect (Lotfiyar et al., 2018).
6
Khani (2018) indicated that both Garau and Sargelu formations are dominated by solid bitumen with equal proportions of low-fluorescencing amorphous organic matter (AOM) and alginate. It is noteworthy that the amorphous organic matter observed in Garau and Sargelu formation shows fluorescence in higher maturity levels and coexists with marine organic matter remains. This suggests that the dominance type of organic matter contained within these source rocks is type II marine, which is further supported by the predominance of pyrite particles in both Garau and Sargelu samples.
Chapter 2 - The geological setting and the sedimentary
successions of the Lurestan basin
2.1 Geological setting
The Zagros Fold-Thrust Belt is a part of the Alpine-Himalayan mountain chain (Alavi, 2004) that extends from SE of Turkey and NE of Iraq to west and SW of Iran ending at the Strait of Hormuz. The Zagros orogen has been divided into two main tectonic areas namely Imbricated Zone to the north and Simply Folded Belt to the south bounded by NW–SE trending parallel faults such as the High Zagros and Mountain Front Faults. The Simply Folded Belt zone can be further subdivided into the Lurestan, Dezful Embayment and Fars regions from northwest to southeast (figure 2.1.1). These regions were originally part of the continental margin of the Arabian plate and now are separated from each other by N–S and E–W trending fault zones such as Bala Rud, Kazerun and Izeh faults. The Lurestan basin is limited between main Zagros Imbricated zone to the northeast and the Dezful Embayment to the southeast (figure 2.1.1; (Ezampanah, Sadeghi, Jamali, & Adabi, 2013). The Zagros orogeny together with activity on preexisting north-south trending basement faults, controlled foreland basin evolution in the Lurestan region (Berberian and King, 1981; Koop and Stoneley, 1982; Hessami et al, 2001a; Sherkati and Letouzey, 2004).
7
Figure2.1.1 Location map of the Zagros Fold-Thrust Belt illustrating the geological provinces (Ghandian et al., 2017)
The Zagros depositional (NE margin of Arabian plate) area was separated from the central Iran realm by rifting and the opening of Neo Tethys with NW- SE trending faults in Late Paleozoic or in Early Triassic time. In this period marine carbonates sediments in NE margin of Arabian plate were deposited.
After the Permian-Triassic rifting period, the Zagros Basin developed above the rifted passive continental margin during the Jurassic – Cretaceous stage. The basin was divided into two main basins. The Lurestan basin to the NW and the Fars basin to the SE, with very different sedimentary successions (Setudehnia, 1978). Steady subsidence characterized the Fars region until the Late Cretaceous that resulted in the deposition of shallow marine sediments whereas in the Lurestan area deeper water sediments deposited in this period (Berberian & King, 1981). This sharp change in the sedimentary characters indicates that the Kazerun and Izeh Fault were active structure during that time between these two areas (Sepehr et al., 2001).
Then Cretaceous period was ended by the collision of the Arabian and Iranian plates linked to the closing of the NeoTethys and is characterized by obduction of ophiolites.
8
In the geological history of Iran, the Mesozoic Era is of great significance since many important geological events occurred in this era. The tectonic and paleogeographic evolution of Iran during the Mesozoic was controlled by the geodynamic interaction of Eurasian continental margin and the Tethys oceanic belt.
The Cretaceous period was characterized by widespread expansion of carbonate platforms due to the highest sea level during the earth’s history (Hallam, 1963; Vail et al., 1977). These thick and widespread carbonate successions nowadays constitute important of source, reservoir rocks, and form prolific petroleum systems in many regions of the Zagros Fold Belt (Murris, 1980).
During the Cretaceous, the Zagros Basin was located along the southern margin of Neo-Tethys Ocean. In the Lurestan basin, NW of the Zagros Fold-Thrust Belt, pelagic and open marine facies were dominant. This condition was continuous until the closure of the Neo-Tethys in late Miocene. Shaly and argillaceous limestone of the Garau formation were deposited in an intrashelf basin that was spread out during early Cretaceous. The basin known as the Garau Basin represents open marine and deep-water sediments which were situated along the NE boundary of the Arabian Plate (Jassim & Goff, 2006). The Garau Formation laterally changed into platform and shallower units toward south Iran and Iraq. At the time of deposition, the study area was located close to the equator, and tropical climate conditions were dominant (Stampfli et al., 2002).
After the Neotethys closure towards the end of the Cretaceous, in Paleocene and Eocene time, the Amiran, Taleh Zang and Kashkan formations (Homke et al., 2009) were unconformably overlain by shallowing upward succession. Low-angle unconformities between Late Eocene and Oligocene/Early Miocene sediments and the local development of conglomerates in Early Miocen (Asmari and Razak Formations) related to the early phase of the final closure of South Tethys (Hessami et al., 2001). During the Oligocene – Early Miocene led to deposition of the Shahbazan–Asmari deposit which constitute the youngest sedimentary unite in the Lurestan basin.
9
Deposition of the evaporitic Gachsaran Formation indicate a progressive return to continental conditions after deposition of the Asmari carbonate platform. Gachsaran Fm is overlain by the detrital sequence of Miocene-Pliocene age, included the Agha Jari and Bakhtyari Formations. The most recent tectonic pulses and orogenyonly recorded by the final (<10 Myr) cooling and exhumation (Homke et al., 2010).
2.2 Sedimentary succession of the Lurestan basin
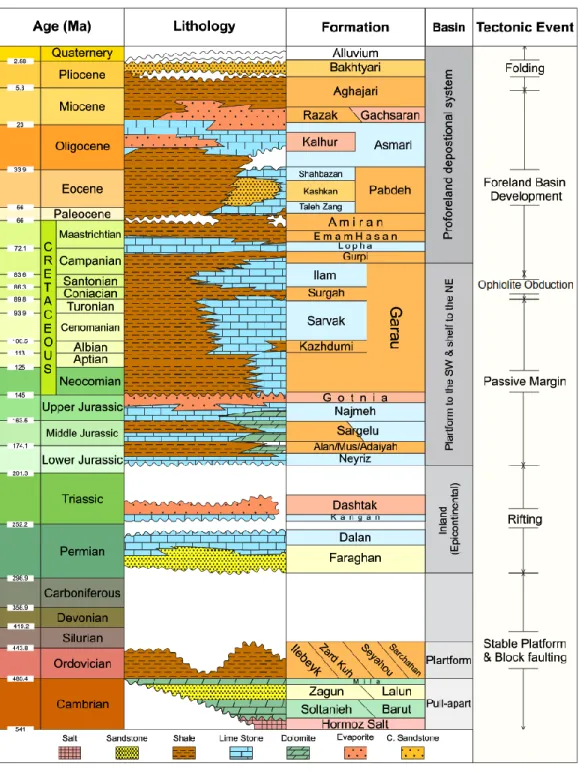
The sedimentary succession of the Zagros fold and thrust belt is approximately 8 – 12 km thick, deposited from Latest Neoproterozoic to Phanerozoic (Alavi, 2004, 2007). A stratigraphic column of the Lurestan as a part of Zagros Fold and Thrust Belt from the Cambrian is shown in figure 2.2.1.
The succession, based on tectonosedimentary features, is classified into four groups of strata (Alavi, 2004) as the following:
I) Neoproterozoic to Devonian strata group:
This group is thought to have accumulated in an extensional pull-apart setting genetically related to the Najd strike-slip fault system (Talbot and Alavi 1996; Figure 2.2.1). The salt Hormoz series from Permian (1-2.5 km thickness) exposed at the surface in the Fars region but in Dezful, Izeh, and Lurestan region is absent or thinner respect to Fars region.
II) Permian to Triassic strata group:
Late Permian-Jurassic time related to the opening of the Neotethys Ocean and generation of passive margin on the NE edge of Arabian plate. The consequence is deposition of the Faraghan (Lower Permian; conglomerate) and Dalan (Lower to Upper Permian; oolitic to micritic shallow-marine carbonates) formations under very shallow and warm sea condition (Sepehr and Cosgrove 2004; Szabo and Kheradpir 1978). In the Triassic period also the Kangan (Lower Triassic;
10
limestone and dolomitic limestone) and Dashtak (Middle to Upper Triassic; shallow-marine dolomite, interbedded with evaporates) Formations are deposited.
Figure 2.2.1 location of the the Najd strike-slip fault from Powers et al., (1966)
III) Jurassic to Turonian (Cretaceous) strata group:
This group contains some petroleum source and reservoir rocks (Bordenave and Burwood 1990; Stoneley 1990) which accumulated on a shallow continental shelf (James and Wynd 1965; Alavi, 2004).
Different facies and stratigraphic thickness through Lurestan and the Fars region in this period is due to reactivation of pre-existing, NS trending faults (Izeh and Kazeroun basement faults) underlying Neoproterozoic Pan-African belts (Alavi, 2004) that caused to deposit shales, pelagic limestones, and evaporates (including
11
Nayriz, Adaiyah, Mus, Alan, Sargelu, Najmeh and Gotnia formations) in the Lurestan region during the Jurassic period (James and Wynd 1965; Szabo and Kheradpir 1978). Shaly Sargelu Fm from Middle Jurassic is considered as a potential source rock. Throughout the Fars region, Surmeh and Fahliyan formations were deposited in neritic condition. During the Cretaceous the Garau formation composed of shales and argillaceous limestones deposited in Lurestan basin. From the early Aptian, Sarvak Formation deposited as a reservoir rock throughout the Lurestan basin (James and Wynd 1965). From the Turonian to upper Cretaceous Surgah, Ilam and Gurpi formations were deposited. Ilam Fm is considered as a reservoir rock. All the formation included this part are discribded by Alavi, 2004.
The Lurestan region contains excellent source rocks such as the Early Cretaceous Garau and Middle Jurassic Sargelu formations (Zeinalzadeh et al., 2015; Saadatinejad & Sarkarinejad, 2011). The Jurassic gas and Cretaceous oil reserves were separated by thick evaporitic sediments of the Gotnia formation that act as a seal for underlying reservoirs.
During the Middle-Upper Jurassic and Lower Cretaceous, anoxic conditions prevailed in the area of the southwest of Iran, including the Lurestan area (Berberian & King, 1981; Bordenave & Hegre, 2010). The onset of hydrocarbon generation for the Garau formation occurred in the Late Cretaceous times (about 90 Ma) prior to the Zagros Folding (Aldega et al., 2014).
The gas reserve is present in the Jurassic Najmah and Sargelu formations, while oil in the Cretaceous Fahlyian and Ilam formations. The Jurassic gas and Cretaceous oil reserves were separated by thick evaporitic sediments of the Gotnia formation that act as a seal for underlying gas reservoirs.
The Garau Formation mainly is considered two main parts: lower Garau that mostly consists of abundant radiolarites known as the Radiolaria flood Zone (James & Wynd, 1965) and upper Garau where planktonic foraminifera are thrived and abundant. The Garau formation deposited in deep intrashelf seaway which was connected to the Neo-Tethys Ocean during the early Cretaceous (Van
12
Buchem et al., 2010). This formation lies disconformably on the Jurassic evaporites of the Gotnia formation (Navidtalab et al., 2014). The lower Garau is an excellent source rock with residual TOC values varying from 4.5 to 9 % in marls (Bordenave & Hegre, 2010); (James & Wynd, 1965). The Garau Formation, between the Gotnia Anhydrite and the Sarvak formation, has a thickness of about 1000 m in Tang-e Garau in Kabir kuh, Lurestan.
V) Latest Turonian to recent proforeland strata group:
The Neo-Tethys ocean is closed towards the end of the Cretaceous, so the shallowing upward clastic wedge covered the shelf successions unconformably (Amiran, Taleh Zang and Kashkan formations; Homke et al., 2009). During the Oligocene – Early Miocene, the marine conditions led to deposition of the Shahbazan – Asmari formations in Lurestan basin. From Miocene that is started the folding and uplifting of the Zagros orogeny, the Gachsaran, Aghajari and Bakhtyari formations were deposited. All the formation included this part are discribded by Alavi, 2004.
13
Figure 2.2.1 Stratigraphic chart of the Lurestan Basin in SW of Zagros Fold and Thrust Belt, Iran (from Khani et al., 2018)
14
2.3 Petroleum system
Five petroleum systems were defined based on the association of source rocks: 1) the Paleozoic petroleum system: Early Silurian (Llandoverian) source rocks; 2) the Middle Jurassic petroleum system: Sargelu source rocks; 3) the Late Jurassic petroleum system: Hanifa – Tuwaiq Mountains /Diyab ( Arab Formations, located in Qatar and Adu Dhabi) source rocks; 4) the Early Cretaceous petroleum system: lower part of Garau Formation source rocks; 5) the Middle Cretaceous to Early Miocene petroleum system: Kazhdumi and Pabdeh source rocks. The Middle Jurassic and Early Cretaceous petroleum system in Lurestan basin are the main source rocks (Bordenave, 2014).
Difination of the source rock: in petroleum geology, source rock refers to organic-rich sediments that may have been deposited in a variety of environments (marine, lacustrine , deltaic and ecc) that are capable to generate the hydrocarbon.
2.3.1 The Middle Jurassic petroleum system: Sargelu formation
The Sargelu Formation represents the Middle Jurassic source rock in the Lurestan area with marine dark-gray shale and thin-bedded limestone. The Jurassic in the Lurestan and Dezful Embayment, act as a hydrocarbon system that is covered by Gotnia Formation. The boundary of the Sargelu Formation with lower formations due to homogenous and non-synchronous is difficult.
If the Paleozoic hydrocarbon system is considered as the biggest hydrocarbon system for producing Gas, the Jurassic system is considered as the biggest oil hydrocarbon system (Ehrenberg et al., 2007).
In the Lurestan, the Sargelu Formation is 100–300 m thick with high initial total organic carbon (TOC) contents (> 6%) and type II kerogen (Bordenave and Hegre, 2005). The Sargelu Formation reached the gas stage in most parts of the Lurestan (Leturmy and Robin, 2010). Massive anhydrite layers such as Alan and Gotnia formations on top and base of this formation act as a migration barrier, therefore, Sargelu Formation is not connected with reservoirs, except at the edge of the
15
Mesopotamian depression, and did not charge oil fields in most the Lurestan province (Leturmy and Robin, 2010; Bordenave., 2014).
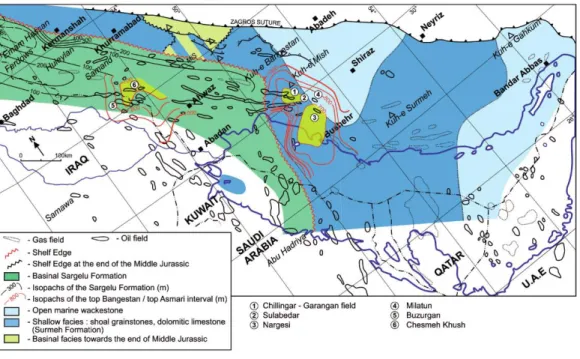
Figure 2.3.1 Isopachs of the Sargelu source rocks in the Mesopotamian depression (Bordenave, 2014)
2.3.2 The Early Cretaceous petroleum system, Garau Formation
Anaerobic conditions dominated in most of the world that leading to development of major petroleum source rocks during the Early Cretaceous (Föllmi, 2012). The source rocks were mostly associated with semi-restricted environments, intrashelf basins or partly fully oceanic environments that were connected to the Neo-Tethys Ocean during early Cretaceous (Van Buchem et al., 2010). In this period, dark shales and clay-limestone sequences of the Garau Formation have been deposited from Berrassian to Aptian and sometimes to Coniacian in Lurestan basin (James and Wynd, 1965). This formation lies disconformably on the Jurassic evaporites of the Gotnia formation (Navidtalab et al., 2014; Setudehnia, 1978) and is considered the source rock of the Early Cretaceous Petroleum System.
16
The Garau Fm. was defined at Tang-e Garau in Kabir Kuh, in Lurestan basin (James & Wynd 1965; Bordenave & Sahabi 1971; Bordenave & Burwood 1995). The thickness of the Garau Formation in this section is up to 1000 m.
The Garau Formation could be divided into two main parts: the lower Garau has TOC (total organic carbon) contents, ranging between 4.5 to 9 % (Bordenave and Hegre 2010) and mainly consists of abundant radiolarites known as the Radiolaria flood Zone (James & Wynd, 1965). Throughout the Lurestan area, the formation reached the oil generation window between Late Cretaceous and Early Miocene, prior to the Zagros folding (Leturmy and Robin, 2010).
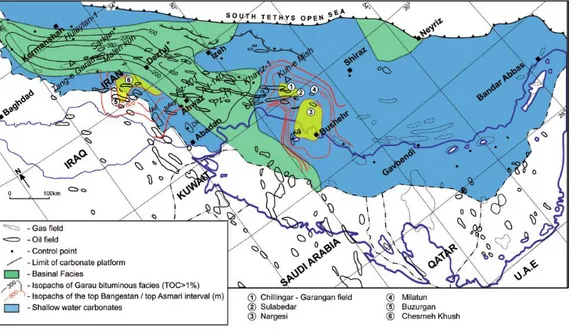
Figure 2.3.2. Isopachs of the source rocks developed in the lower part of the Garau Formation (Bordenave, 2014)
There was a poor connection between the Garau Formation and reservoirs. This Formation is surranded by thick overlying basinal marl sequences of the Surgah Formation and a thick underlying succession of Gotnia evaporites that acts as barrier rocks so most of their oil could not be expelled and was cracked in situ to pyrobitumen and gas (Bordenave and Hegre, 2005; Leturmy and Robin, 2010).
17
With the increasing importance of unconventional reservoirs, the Lower part of Garau Formation has been considered among very prone unconventional reservoirs in Iran (Kamali and Rezaee 2012).
2.4 Location and description of the wells and outcrops
2.4.1 Huleylan #1 well
This well is one of the first exploration well that was drilled on 1970 in the Huleylan anticline in order to evolution of the hydrocarbon generation potential of Permian-Triassic rocks. The Huleylan anticline is approximately 50 kilometers long and 5-10 km wide. The anticline is northwest - southeast trending parallel to the main trend of the (figure 2.4.1.1)
Geographic coordinate of the Huleylan well based on Lambert scale is: N= 1,308,472 E= 1,694,725
18 • Access routes
The Huleylan anticline is located about 60 km from Kermanshah and 20 km west of the Kuhdasht city. The best way to get access to the Huleylan anticlinal is through the Kuhdasht city (figure 2.4.1.2). The general position of the anticline respect to other important anticlines of the region is shown in the figure 2.4.1.
2.4.1.2 Access routes to the Huleylan anticline
The Huleylan #1 well has a total depth of 3688 m intercepting layers of Cretaceous to the Pre-Permian age. The drilled rock units are from top to down: the Ilam, the Surgah, the Sarvak, the Garau, the Gotnia, the Najmeh, the Sargelu, the Alan, the Mus, the Adyian, the Bumah/Sarki equivalent, the Khaneh Kat, the Geli Khana, Beduh shale, the Chia Zairi Equivalent formations and the deepest part consists of Pre-Permian sediments (figure 2.4.1.3). Totally twenty-nine samples were selected for the X-ray Diffraction analysis (15 samples), vitrinite reflectance measurement (10 samples).
19
20
2.4.2 Mahi Dasht well #1
The Mahi Dasht well # 1 is located in the Central Lurestan Province. Geographic coordinates of the Mahi Dasht well based on Lambert scale are:
N= 1,369,474.3 E= 1,655,885.69
This well was drilled in June 1972 by NIOC and the drilling completed in October 1972. The Mahi Dasht well # 1 has a total depth of 8752 ft (2668 m) and includes the Amiran down to the Dashtak Formation. The Campanian- Maastrichtian shales and marls of the Gurpi Fm, with a considerable thickness intercepted by the well. The Garau Formation disconformably overlain by the Surgah and Ilam formations and it disconformably rests onto the Gotnia Formation. The other sediments older than Gotnia are Najmeh, Sargelu, Alan, Mus, Adyian, Nayriz, and Dashtak formation. An Aptian- Cenomanian age can be ascribed to the Garau Fm in the Mahi Dasht well #1. In total, thirty sseven samples were selected for X-ray diffraction analysis, 29 samples for vitrinite reflectance measurement (unfortunately barren) (figure 2.4.2.1).
2.4.3 Darreh Baneh East #1 well:
The Darreh Baneh East #1 well is located in the Lurestan province. Geographic coordinates based on Lambert scale are:
N= 1, 270, 748 E= 1, 738, 326
The Darreh Baneh East #1 well was drilled on 2008 for evaluating the hydrocarbon potential of the Bangestan group in the Darreh Baneh anticline. The anticline is NW-SE trending with 10.5 km length and 3 km width. This well has a total depth of 2451 m. The drilled rock units in descending stratigraphic order include the Pabdeh down to the Gotnia Formation, ranging from the Late Paleocene to the Late Jurassic age. Seventeen samples were selected for X-ray diffraction analysis and twelve samples for vitrinite reflectance measurements (figure 2.4.3.1).
21
22
2.4.3.1 Sedimentary succession of Darreh Baneh East #1 well with sampling sites
23
2.4.4 The North Shah Abad well # 1
The North Shah Abad well #1, located southeast of Islam Abad city was drilled in 1974 in the Lurestan province by the INPECO Company. The total depth of this well is 3981 m. Geographic coordinates of the North Shah Abad well #1, based on Lambert scale are: N= 1,340, 859 E= 1, 666,839
The drilled rock units in this well consist of Amiran, Gurpi, Ilam, Surgah, Sarvak, Garau, Gotnia, Najmah, Sargelu, Alan and Mus Formations. In this well the thickness of the Garau Formation is 576 m. The Garau Formation is composed of alternating shale and argillaceous limestone. This Formation is overlain by the Sarvak Formation and disconformably rests onto the Gotnia Formation. Micropaleontological and lithological data indicate an Albian-Cenomanian age (by NIOC) or the Garau Fm. Five samples were selected for X-ray diffraction analysis and three samples for vitrinite reflectance measurements (figure 2.4.4.1).
2.4.5 Bankul #1 well
The Bankul well #1 was spudded on 22 November 1972 by INPECO with a drilled thickness of 2960 m in the Bankul anticline. Geographic coordinate of the Bankul well#1 based on Lambert scale are:
N = 1, 626, 669, 89 E = 1, 314, 066, 20
The trend of the Bankul anticline is NW-SE as the same trend of the Zagros orogeny. Based on microfauna and lithological data indescending stratigraphic order, the drilled sequence of Bankul well# 1 include to the Asmari, Pabdeh, Taleh Zang Tongue, Gurpi, Ilam, Surgah, Sarvak, Garau and Gotnia Formations, ranging from the Early Miocene (Aquitanian) to Late Jurassic.
Sixteen samples were selected for X-ray diffraction analysis and seventeen for vitrinite reflectance measurements (figure 2.4.5.1).
24
25
26
2.4.6 Baba Ghir #1 well
The Baba Ghir well #1 located NW of Ilam city in the Lurestan province has been drilled by INPECO in 1973. Geographic coordinates of the Baba Ghir well #1, based on Lambert scale are:
N= 1, 602, 162 E= 1, 335, 030
The total depth of this well is 8514 feet (2554 m) andthe drilled rock units consist of Pabdeh, Gurpi, Ilam, Surgah, Sarvak, Garau and Gotnia Formations, ranging from the Aptian to the Eocene age. This drilled sequence seems to be deposited in deep marine environment (unpoblished report by NIOC). Fossils from the Garau Formation, which mainly consists of argillaceous limestone and black shale, indicate an Aptian age (unpoblished report by NIOC). Thirteen
samples were selected for X-ray diffraction analysis and five for vitrinite reflectance measurements (figure 2.4.6.1).
2.4.7 Samand #1 well
The Samand well #1 has been drilled by INPECO in 1976. Geographic coordinates of the Samand well #1, based on Lambert scale are: N = 1, 218, 872 E = 1, 705, 217
The total depth of this well is 3406 meters, from Permian, Triassic, Jurassic and Cretaceous (up to Maastrichtian) age.
The drilled rock units consist of Gurpi, Ilam, Surgah, Sarvak, Darian, Gadvan, Fahlyan, Garau, Gotnia, Najmah, Sargelu, Alan, Mus, Neyriz, Dashtak, Aghar, Kangan, and Dalan Formations.
Eight samples were selected for the X-ray diffraction analysis and five samples for vitrinite reflectance measurements (figure 2.4.7.1).
27
28
29
2.4.8 Kabir Kuh
Kabir Kuh # 1 well
The Kabir Kuh ≠ 1 well locates at 1, 660, 540 longitude and 1, 269, 681 latitude, in the Lurestan province. The well was drilled on the Garau Formation 1972 -1973 by the Oil Service Company of Iran (OSCO). The drilled sequence is 10356 ft (3156.51m.) thick. The drilled rock units in this well consist of Garau, Gotnia, Najmah, Sargelu, Alan, Mus, Neyriz, Dashtak, Kangan, and Dalan Formations.
One samples from the Dashtak Fm is selected for vitrinite reflectance measurements.
Kabir Kuh section
The Garau Formation is exposed at Tang-e Garau in Kabir-Kuh, ten kilometers far from the Qale-Darreh village. The total thickness of this section is about 2500 meters that consist of Garau, Sarvak, Surgah, Ilam, and Gurpi formations from surface to top of section. The total thickness of the Garau Fm in Kabir Kuh is about 1000 meters (890 thick in this outcrop and 110 m thickness in the Kabir Kuh well). The lower boundary of the Garau Formation is mainly characterized by evaporite sediments of the Gotnia Fm in Kabir Kuh well
Seven samples were selected from the kabir Kuh section for X-ray dffraction analysis and six samples vitrinite reflectance measurements (figure 2.4.8.1).
30
31
2.4.8. 2 SW flank of the KabirKuh anticline (entry of Del Goshasection) in Lurestan
2.4.9 Tang-e Haft surface section
The Dariagirveh anticline is located to the NE of the Rit. Access to the intended section is possible via the Doroud railway of Andimeshk. After crossing the second tunnel after the Tang-e haft, there is railway that cross the Ab-Bakhtiari River. At the very beginning of the bridge, there is a road that locals call Reza Khani Road. After entering this road and a 300 m walk, the studied section of the Garau Formation is visible on the right hand. The Tang-e haft section locates at N: 33˚ 01' 24" and E: 48˚ 39' 45" in the Lurestan province. A sedimentary succession of Amiran Formation, Taleh Zang, Kashkan and Shahbazan in SW flank of the anticline indicate continuing syn-depositional folding. The Garau Formation in Tang-e-Haft area has a thickness of 703 m and rests on the Gotnia evaporite
32
2.4.9.1 Access routes to Tang-e Haft outcrop, Lurestan
Figure 2.4.9.2 The Garau Formation exposed in the Darigariveh Anticline; evaporates of the Gotnia Formation are exposed in the core of anticline beneath the Garau Formation (sarfi et al., 2014)
33
2.4.9.3 Sedimentary succession of the Tang-e Haft section in Darigariveh anticline
34
Chapter 3 - Materials and Methods
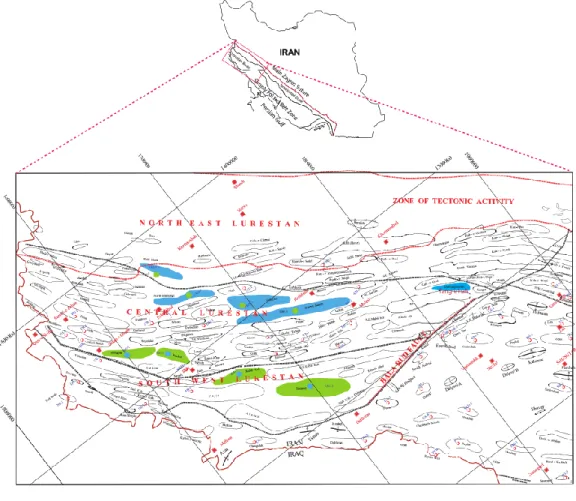
The study area is in Lurestan basin, in NW of Zagros Fold and Thrust Belt. In this area, samples from eights wells and two surface sections are studied. Mahi Dasht #1, Huleylan #1, North Shah Abad #1, Darreh Baneh East #1, Baba Ghir #1 and Bankul #1 wells and surface sections in Tang-e Haft in Dariaghirveh anticline are selected from central Lurestan. Kabir Kuh #1 and Samand #1 wells and Kabir Kuh section are selected from south west of Lurestan (figure 3.1).
Figure 3.1 The map showing the study area and the locations of the studied wells and sections
35
3.1 Sample Collection and Preparation
The cutting samples for 8 wells (Huleylan, Kabir Kuh, Samand, Darreh Baneh East, Baba Ghir, Bankul, Mahi Dasht, and North Shah Abad) were received by
NIOC Exploration Directorate department and prepared in laboratories of Roma Tre and Sapienza universities in Italy and Aachen University in Germany. Surface samples from stratigraphic sections containing the Garau Formation were taken from Kabir Kuh anticline and Tang-e Haft (Darigariveh Anticline). These samples were prepared for vitrinite reflectance measurements, X-ray diffraction analysis and Rock-Eval pyrolysis.
X-ray diffraction analysis was performed at Roma Tre University in Rome, Italy for semi-quantitative analysis of clay minerals.
Vitrinite reflectance measurements were carried out in Aachen in coal and geochemistry laboratory under the supervision of Prof Ralf Littke.
Preparation: Each sample was prepared accordingly for three separate analyses: 1) pellet preparation for vitrinite reflectance analysis, 2) Rock-Eval and TOC analysis. and 3) X-ray diffraction analysis.
1) Thermal maturity was characterized by vitrinite and solid bitumen reflectance measurements. Base on the color and TOC content, samples are selected for Rock-eval pyrolysis analysis. Samples cut perpendicular to bedding were impregnated with a mixture of epoxy-resin (Scandiplex A) and a hardener (Scandiplex B). During the exothermal hardening maximum temperatures did not exceed 36 °C. Each block was polished on one side with successively finer abrasives (320, 400, 600 mm; see Littke et al. 2012; Sachse et al. 2012 for more details).
Reflectance measurements were performed on an incident light microscope Zeiss Axioplan with an oil immersion lens of 50-times magnification under monochromatic light with a wavelength of 546 nm. Oil with known refractive index was used to avoid undesired diffusion reflectance (Taylor et al. 1998). For the first time, the microscope was calibrated with YAG (Yttrium–Aluminum– Garnet-standard) with a constant reflectance of 0.889 %; that is suitable for
36
samples with maximum value of 1.3%. The number of measurements to obtain a representative mean value should be minimum 30 according to Senftle et al. (1993)
Due to a lack of vitrinite macerals, this number was not reached for some of the samples. The microscope was calibrated again for the second time with Gadolinium-Gallium-Granat (GGG) with a constant reflectance of 1.714 %; this standard can be used up to values of 3.0 % Ro. This has been done because samples showed reflectance values higher than 1.3 %.
37
Figure 3.1.2. YAG and GGG standards for calibration of Microscope
Solid bitumen reflectance (Rb) can be measured if vitrinite macerals are not observed. Measured values can be converted into vitrinite reflectance equivalent by the formula of Schoenherr et al. (2007):
38
3.1.3 Selection criteria of distinguishing vitrinite fragment (Baker, 1996)
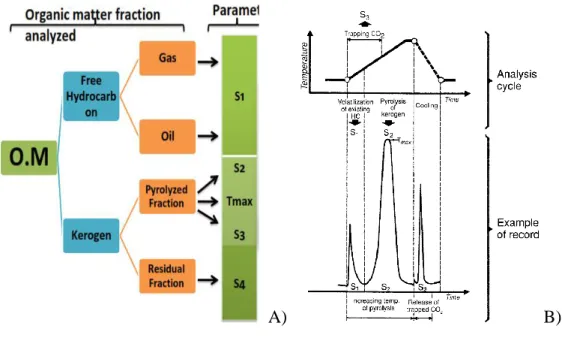
2) I used also the Rock-Eval data prepared by Mahboubipoor (Mahboubipoor et al, 2016) for Baba Ghir #1, Darreh Baneh East #1, Mahi Dasht #1, and North Shah Abad #1 and I prepared some samples for the Samand #1, the North shah Abad #1, the Kabir Kuh #1cutting samples and Kabir Kuh and Tang-e Haft Outcrops samples in Aachen University in Germany in coal and geochemistry laboratory under supervision of Prof Ralf Littke. For characterization of elemental composition dark-colored samples were selected for analysis of total organic and inorganic carbon (TOC, TIC) for outcrop and cutting samples (6 outcrop samples of Kabir Kuh, 8 outcrop samples of Tang-e Haft, 6 cutting samples of Kabir Kuh #1, 5 cutting samples of Samand #1 and 4 cutting samples of North Shah Abad #1 wells). For elemental analyses (such as S1, S2, Tmax etc.) respect to TOC of the samples, 10 to 30 mg of each pulverized sample was combusted using a liquiTOC II analyzer to determine the total organic and inorganic carbon content. The instrument is using a temperature ramp method, which enables a direct determination of TOC and TIC without prior acidification of the samples (heating in two steps: 300 °C/min to 550 °C and held for 600 s, then raised to 1000 °C and held for 400 s). Under constant oxygen supply, the organic carbon (first step) and the inorganic, carbonate carbon (second step) will generate CO2, which is analyzed by a non-dispersed infrared detector (NDIR: detection limit 10 ppm, rel. TOC error 0.6 %, TIC error 1.7 %).
Based on their TOC values, 2 outcrop samples of Kabir Kuh, 5 outcrop samples of Tang-e Haft, 2 cutting samples of Kabir Kuh #1, 1 cutting samples of Samand #1 And 2 cutting samples of North Shah Abad #1 wells were prepared to Rock-Eval pyrolysis analysis to characterize the quality of organic matter. Each pulverized sample has been used according to Espitalié et al. (1985).
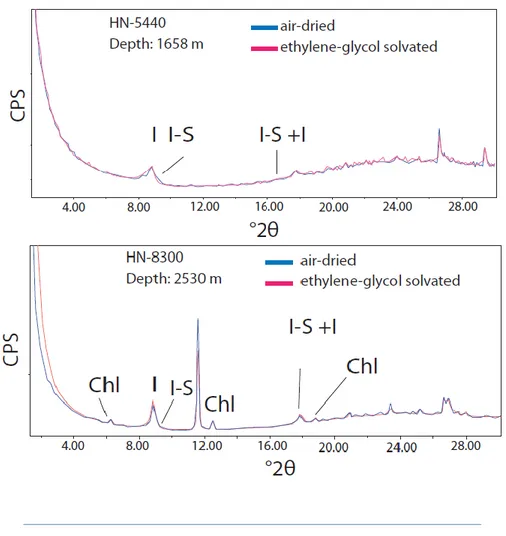
3) For X-ray diffraction analysis and determination of the illite content in mixed layers I-S (I % in I-S), samples were lightly crushed and disaggregated in distilled water. Then, the <2 μm (equivalent spherical diameter) grain-size fraction was
39
separated by centrifuging, and oriented slides were prepared by the pipette-on-slide method and dried at room temperature on glass pipette-on-slides to produce a thin highly oriented aggregate.
Oriented air-dried and ethylene-glycol solvated samples were X-rayed from 1 to 48 °2θ and from 1 to 30 °2θ respectively with a step size of 0.05 °2θ and a count time of 4 s per step. The presence of expandable clays (e.g., smectite and mixed layered minerals) was determined for samples treated with ethylene-glycol at 25 °C for 24 h. The illite content in mixed layers illite-smectite (I-S) was determined according to Moore and Reynolds (1997) using the delta two-theta method after decomposing the composite peaks between 9-10 °2θ and 16-17 °2θ by Pearson VII functions. The I–S ordering type (Reichweite parameter, R; Jagodzinski, 1949) was determined by the position of the I001-S001 reflection between 5 and 8.5 °2θ (Moore and Reynolds 1997). Integrated peak areas of clay minerals were transformed into mineral concentration by using mineral intensity factors as a calibration constant (for a review, see Moore and Reynolds, 1997).
3.2 Methods
3.2.1 Terminology for mixed layers illite-smectite
Mixed-layer clay minerals are intermediate production of reactions involving pure end-members clay. They range from the surface to low-grade metamorphic and hydrothermal conditions.
Mixed-layer clays are either di- or trioctahedral; di/trioctahedral mixed layers and interstratifications of more than two components are quite rare. The layers are stacked along a direction parallel to the c-axis in random, partially regular, or regular sequences (figure 3.2.1.2).
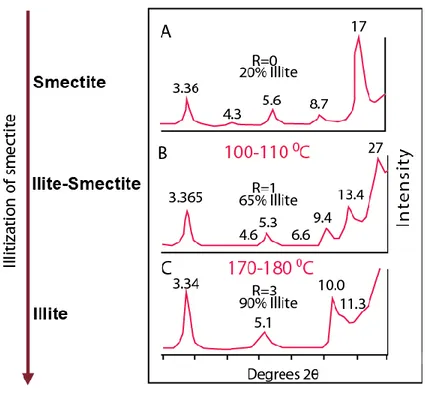
The term R used for the stacking order for exhibition of the possibility, given a layer A, of finding the next layer to be B (Reichweite; Jadgozinski, 1949). The R parameter ranges from 0 to 3. R0 means stacked randomly of illite and smectite layers by the temperature is around 50-60 °C (Pallastro, 1990). If a smectite layer
40
is followed by an illite layer and a stacking order appears in the interstratification sequence, it is identified by R1. If these are regularly alternating sequences of components in the fixed ratio like 50/50 illite-smectite mixed layer that is called Rectorite. Some minerals have stacking order that each smectite layer is surrounded by at least three illite layers on each side (ISII). In this thesis, I-S structures will be described by means of the Reichweite nomenclature using R0, R1, and R3 instead of R=0, R=1, and R=3, respectively.
• smectite to illite transition
An important reaction occurring in shales during burial diagenesis (Hower et al., 1976; Hoffman and Hower 1979; Weaver, 1989) is the gradual conversion of smectite to illite (illitization) through I-S mixed layers as intermediate phases that widely used in petroleum exploration as a geothermometer and, therefore, indicate of the thermal evolution of sedimentary.
The transition from smectite to mixed layers I-S and then to illite has been assumed to be isochemical that is all the chemical components necessary for the reaction were available in the original mineral assemblage of the rock (Hower et al., 1976). Other studies have demonstrated that elements diffusion from one lithology to another is an active process in the smectite-to-illite conversion (Altaner et al., 1984). This conversion of smectite to illite is identified by losing of K-bearing minerals as burial proceeds (Hower et al., 1976). These authors proposed the following reaction:
K-feldspar + smectite → illite + chlorite + quartz
Main factors controlling the smectite to illite reaction are temperature that increase with depth and potassium availability (Hower et al., 1976) and this reaction is irreversible under progressive burial conditions and subsequent exhumation phases (Árkai, 2002). Other factors controlling the reaction are time (Pytte & Reynolds, 1989), fluid and rock composition (Roberson & Lahann, 1981), rock/water ratio, starting composition of IS (Pollastro, 1990) and pressure
41
(Bruce, 1984). Among of these factors the time has more effect on smectite to illite reaction. Because most hydrocarbon generation models are made base on time-temperature calculations (Tissot and Welte, 1984), the effect of time should be considered when I-S geothermometers are used as thermal maturity indicators for petroleum source rocks.
• Conversion to paleotemperatures
Mixed layers I-S and the transformation sequence di-smectite—random-ordered mixed layers (R0)—ordered mixed layers (R1 and R3)—illite—di-octahedral K-mica (muscovite) can be used as indicators of the thermal evolution of sedimentary sequences (Pollastro 1990, 1993; Aldega et al. 2007a, b;Corrado et al. 2010). Although the conversion to paleotemperatures depends on more than one factor (e.g., heating rate, protolith, fluid composition, permeability, fluid flow), Pollastro (1990; 1993) summarized the
application of two simple time-temperature models for I-S geothermometry studies based primarily on the duration of heating (or residence time) at critical I-S reaction temperatures.
The first model was expanded by Hoffman and Hower (Hoffman & Hower, 1979) for long-term, burial diagenetic settings that can be applied
to most geologic and petroleum studies of sedimentary rocks and basins of Miocene age or older. In this model the major changes from R0 to R1 and from R1 to R3 occur in the temperaturerange of about 100-110 °C and of 170°C-180 °C respectively and a minimum heating duration of 2 My is generally placed (Hoffman and Hower, 1979, figure 3.2.13).
The second model, which was developed for short-lived heating events, applies to young basins or areas characterized by relatively recent thermal activity with high geothermal gradients, or to recent hydrothermal environments. Such settings are those where relatively young rocks were subject to burial temperatures in excess of 100 °C for <2 My. In this model the conversion from R0 to R1 and from
42
R1 to R3 ordering occurs at about 130-140 °C and 170-180°C respectively (Jennings and Thompson, 1986).
Fig. 3.2.1.1 Clay mineral geothermometers used to study the transition from diagenesis to ancmetamorphism (Basin Maturity Chart modified from Merriman and Frey, 1999)
43
Figure 3.2.1.2 Smectite to illite conversion supported by lithostatic pressure.
It must be considered several points for interpretation of I-S data as a geothermometers: First, the origin composition of I-S because some rocks could contain several assemblage of I-S due to various origins of the clay by various source areas, detrital (depositional versus diagenetic) origins, hydrothermal alteration, recycling, and also rarely, weathering. Applying I-S as a geothermometer is particularly useful when vitrinite or other organic matter thermal indicator are lacking.
• Identification and quantification of mixed layers illite-smectite
Identification and quantification of mixed layers I-S require analysis of both air-dried and ethylene glycol solvated samples.
44
Figure 3.2.1.3 the R parameter ranges from 0 to 3, means from random ordering to long-term stacking order
In this thesis, qualitative identification and quantification of mixed layers I-S was performed with a Scintag X1 XRD system (CuKα radiation, solid state detector, and spinner). Oriented air-dried samples were scanned from 1 to 48 °2 with a step size of 0.05 °2 and a count time of 4s per step at 40 kV and 45 mA. The presence of expandable clays was determined for samples treated with ethylene glycol at 25°C for 15h. Ethylene-glycol solvated samples were scanned at the same conditions as air-dried aggregates with a scanning interval of 1-30 °2θ. Reichweite ordering was determined by the position of the reflection between 5 and 8.5° 2θ for ethylene glycol solvated preparations and modeled by using Scintag associated software (Moore & Reynolds, 1997).
Expandability measurements were determined according to Moore & Reynolds (1997) using the delta two-theta method after decomposing the
45
composite peaks between 9-10 °2θ and 16-17 °2θ and calculating the quantity Δ2θ (Table 3.2.1.1). 001/002 002/003 %Illite Reichweite D(Å) °2θ D(Å) °2θ °△2θ 10 0 8.58 10.31 5.61 15.80 5.49 20 0 8.67 10.20 5.58 15.88 5.68 30 0 8.77 10.09 5.53 16.03 5.94 40 0 8.89 9.95 5.50 16.11 6.16 50 0 9.05 9.77 5.44 16.29 6.52 60 1 9.22 9.59 5.34 16.60 7.01 70 1 9.40 9.41 5.28 16.79 7.38 80 1 9.64 9.17 5.20 17.05 7.88 90 3 9.82 9.01 5.10 17.39 8.38
Table 3.2.1.1 the position (Cukα) of useful reflections for estimating illite content in mixed layers illite-smectite (after Moore & Reynolds, 1997).
The differential 2θ value is the most suitable descriptor of I-S composition because it is relatively insensitive to goniometer zero-alignment problems and specimen displacement errors and is unaffected by variations in thicknesses of the interlayer solvation complex (Środoń, 1980).
3.2.2 Organic matter Optical analysis (Vitrinite reflectance
measurements)
Several organic parameters may help for identifying levels of thermal maturity of sedimentary successions. They are: vitrinite reflectance; TAI (Thermal Alteration Index); Tmax by pyrolysis Rock-Eval and Biomarker of
46
indigenous hydrocarbon. The optical analysis includes vitrinite reflectance (Ro%) measurements on either whole-rock samples or on kerogen concentrate. The technique is adapted from coal petrology and is applicable to the whole range of thermal maturity relevant to petroleum exploration (Ro % < 2.6 %).
The organic matter dispersed in sediments is composed of a mixture of organic compounds (e.g. cellulose, proteins, lignin, and lipids) of various origin and composition. Vitrinite derives from the thermal degradation of lignin, cellulose, and tannins of vascular plants, especially from the bark and wooden fragments of continental origin and is the most important group of macerals of the organic matter dispersed in sediments (Stach et al., 1982; Teichmüller, 1987). In the starting phases of sediment burial, the organic matter sustains irreversible physical and chemical variations that are extremely sensitive to temperature changes concerning the reorganization of carbon-hydrogen bonds. These transformations will produce an organic macromolecule called kerogen that progressively will convert into hydrocarbons with increasing burial and temperature.
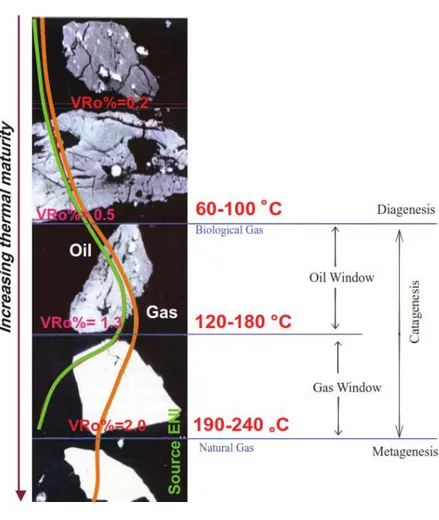
By increasing the maturity of organic matter, a progressive ordering takes place in the structure of the vitrinite molecular that gives it the ability to reflect light (figures 3.2.2.1 and 3.2.2.2). This reflectance depends on the stage of the thermal evolution of the hosting sediments that directly identify the stages of hydrocarbon generation and other thermal parameters in sedimentary environments (Hunt, 1986; Scotti, 2003). Therefore, it is a widely used parameter to calibrate basin modeling (WG, 1977).
47
Figure 3.2.2.1 evolution of vitrinite reflectance with increasing burial and temperature.
48
Figure. 3.2.2.2 Correlation of I/S mixed layers and Ro values, according to Burnham & Sweeney, 1989
The samples were prepared using whole rock material embedded in an epoxy plug and after hardening, the samples have been polished using abrasive papers, alumina powders, diamond paste and lubricant, to a flat, shiny surface following the procedures described in detail by Littke et al. (2012). Vitrinite reflectance was measured under oil immersion using a 50×/0.85 Epiplan-NEOFLUAR oil immersion objective and a Zeiss Imager M2m microscope (total magnification 500 ×). At the same magnification, qualitative estimation of maceral abundance was performed both in reflected light and in an incident light fluorescence mode. The vitrinite reflectance was measured at a wavelength of 546 nm against a Klein and Becker leuco-sapphire standard with a known reflectance of 1.714 (Gadolinium-Gallium-Granat (GGG)), using Zeiss immersion oil with a refractive
49
index of ne =1.518 at 23° C. The reflectance measurements were conducted at random orientation of the grains (Ro%) in non-polarized light. The measurements were processed using Fossil Software. Details of the examination procedures are described in Sachse et al. (2012). On each sample measurements were performed on vitrinite or bitumen unaltered fragments. Mean reflectance values (Ro for vitrinite and Rb for bitumen) were calculated from the arithmetic mean of these measurements. Rb values were converted into vitrinite equivalent reflectance data (Roeq), (Schoenherr et al., 2007).
Figure 3.2.2.3 a complete reflectogram showing the reflectance of all macerals in a kerogene sample. In this scheme, the “real” vitrinite fragments recommended for vitrinite reflectance measurements are telocollinite (Scotti, 2003).
The mean of the vitrinite reflectance for dispersed organic matter was calculated by plotting the frequency of vitrinite population against every 0.05% reflectance steps in a histogram and selecting the autochthonous vitrinite population. A symmetric distribution revealed the presence of autochthonous vitrinite; but histograms sometimes revealed a bimodal distribution.
According to the literature, several factors have effect on vitrinite reflectance values (Borrego et al., 2006) that makes limitation for using of this method. These include: vicinity to bright components that surround macerals like pyrite, homogeneity of the surface of macerals, orientation of vitrinite particles due to surface relief/irregularities, size of the particles (big particles are better for