Implementing
physiologically-based approaches
to improve
Brain-Computer Interfaces usability
in post-stroke motor rehabilitation
Research Doctorate (PhD program) in“Automatica, Bioengineering and Operations Research”
cycle XXXI - Department of Computer, Control, and Management
Engineering Antonio Ruberti
PhD Candidate
Eng. Emma Colamarino
Supervisor
Prof. Febo Cincotti
Co-supervisor
Dr. Donatella Mattia
1
Table of Contents
LIST OF ABBREVIATIONS ... 5 LIST OF FIGURES ... 9 LIST OF TABLES ... 15 GENERAL INTRODUCTION ... 19 CHAPTER 1 ... 21BRAIN-COMPUTER INTERFACES FOR POST-STROKE FUNCTIONAL MOTOR RECOVERY ... 21
SINGLE FEATURE BCIS ... 22
Sensorimotor-rhythms BCI ... 22
Movement-related cortical potentials BCI... 25
MULTIPLE FEATURES BCI ... 28
CHAPTER 2 ... 31
BCI TECHNOLOGY TRANSLATION TO CLINICAL REALM ... 31
THESIS AIM ... 32
THESIS OUTLINE ... 33
CHAPTER 3 ... 35
NEW APPROACHES TO BCI DATA PRE-PROCESSING ... 35
INTRODUCTION ... 35
NEUROPHYSIOLOGICAL-BASED SIGNAL PROCESSING ... 37
Materials and Methods ... 37
Data Collection ... 37
Data Analysis ... 39
Statistical Analysis ... 42
Results... 43
2
IMPACT ON SMRS-BASED BCIS STROKE REHABILITATION ... 51
Materials and Methods ... 52
Data Collection ... 52 Data Analysis ... 52 Statistical Analysis ... 54 Results... 55 Discussion ... 59 MAIN MESSAGE ... 60 CHAPTER 4 ... 61
SEMIAUTOMATIC-PHYSIOLOGICALLY-DRIVEN BCI CONTROL PARAMETER SELECTION ... 61
INTRODUCTION ... 61
MATERIALS AND METHODS ... 65
GUIDER - User interface description and operating procedure ... 65
GUIDER – semiautomatic, physiologically-driven BCI control parameters selection method ... 67
Data Collection ... 70 Data Analysis ... 71 Statistical analysis ... 73 RESULTS ... 73 DISCUSSION ... 79 MAIN MESSAGE ... 81 CHAPTER 5 ... 83
ADAPTIVE LEARNING IN BCIS ... 83
INTRODUCTION ... 83
MATERIALS AND METHODS ... 85
Data Collection ... 85
Data Analysis ... 88
LSDA-based MRCP detector ... 89
Parameter optimization study ... 93
Adaptive algorithms for MRCP detection ... 94
MRCP detection algorithm comparison ... 98
RESULTS ... 100
3
MAIN MESSAGE ... 119
CHAPTER 6 ... 121
ELECTROMYOGRAPHIC FEATURES IN HYBRID BCIS ... 121
INTRODUCTION ... 121
MATERIALS AND METHODS ... 124
Data Collection ...124
Data Analysis ...127
Time Domain Univariate Analysis ... 128
Amplitude Domain Univariate Analysis ... 129
Spatial Domain Univariate Analysis ... 131
Statistical Analysis ...132
RESULTS ... 133
Time Domain Univariate Analysis ...133
Amplitude Domain Univariate Analysis ...139
Spatial Domain Univariate Analysis ...144
DISCUSSION ... 148
MAIN MESSAGE ... 151
GENERAL CONCLUSION ... 153
REFERENCES ... 155
APPENDIX A - GENERAL SOFTWARE INFORMATION... 169
APPENDIX B - STROKE PATIENTS DATASET ... 171
LIST OF PUBLICATIONS ... 177
5
List of abbreviations
AUC Area Under Curve
BCI Brain-Computer Interface
Bic Biceps brachii muscle
CAR Common Average Reference
CNS Central Nervous System
Del Lateral deltoid muscle EEG Electroencephalography
EMG Electromyography
Ext Extensor digitorum muscle
Fle Flexor digitorum muscle
FMA Fugl-Meyer Assessment
FP/min False Positive per minute
iLSDA Incremental updating of Locality
Sensitive Discriminant Analysis
iLSDA+LDA Incremental updating of Locality Sensitive Discriminant Analysis followed
6
LDA Linear Discriminant Analysis
lLAP large surface Laplacian
loBIP longitudinal Bipolar
LSDA Locality Sensitive Discriminant Analysis
LSDA + iLDA Locality Sensitive Discriminant Analysis
followed by the Incremental updating of
Linear Discriminant Analysis
k-NN k-Nearest Neighbors Classifier
MAS Modified Ashworth Scale
MI Movement Imagination
MRC Medical Research Council scale for muscle strength
MRCP Movement Related Cortical Potential
MVC Maximum Voluntary Contraction
Pec Pectoralis major muscle
ROC Receiver Operating Characteristic
RMS Root Mean Square
sLAP small surface Laplacian
7
SW Stepwise
SWLDA Stepwise Linear Discriminant Analysis
TDR True Detection Rate
trBIP transversal Bipolar
9
List of figures
Figure 1 - Overview of a BCI system. EEG signals, acquired from the scalp, are processed and analysed to extract specific signal features. These features are translated into commands that operate a device or feedbacks provided to the subject. ... 22
Figure 2 - Left Panel: [9] Bar diagram of the effectiveness of clinical outcome measures, Fugl–Meyer Assessment (FMA), Medical Research Council scale for muscle strength (MRC), National Institute of Health Stroke Scale (NIHSS), in the 2 groups (BCI and no-BCI-assisted groups ). Asterisks mark significant differences between groups (independent-samples t test, p< 0.05). Right panel: The all-in-one BCI-supported MI training station, Promotoer, installed in a ward of the IRCCS Santa Lucia Foundation (Rome, Italy). ... 25
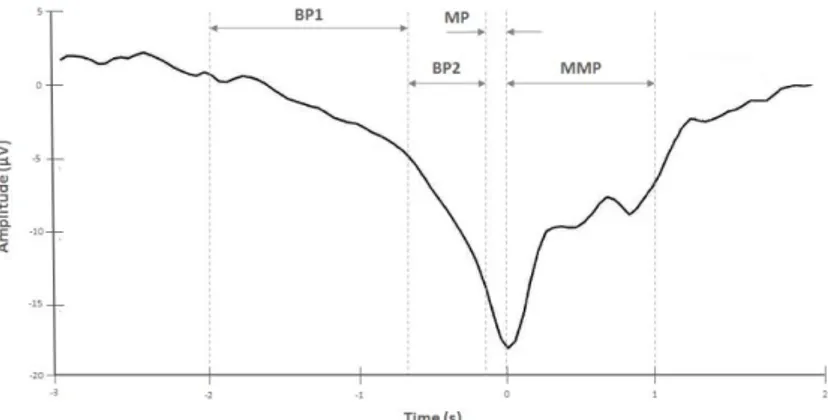
Figure 3 - Amplitude (µV) of the movement-related cortical potential (MRCP) as function of time (s): 0s corresponds to the movement onset. BP1 and BP2 are, respectively, early and late Bereitschaftspotential (readiness potential), MP, motor potential, and MMP, movement-monitoring potential. ... 27
Figure 4 - Example of subject interface: subjects performed the execution or imagination (acquired in separate runs) of the ankle dorsiflexion (foot movement) when the target appeared in the bottom side of the interface. User interface designed by BCI2000 [31] software system. ... 39
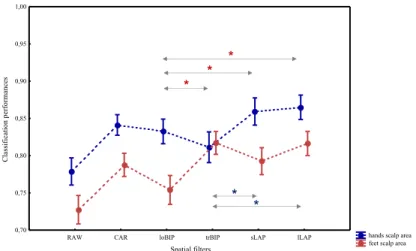
Figure 5 - Classification performances (area under the ROC curve) are expressed as mean ± SE (standard error, n=39 healthy subjects) and computed for each spatial filter: ear reference (RAW), common average reference (CAR), longitudinal bipolar (loBIP) and transversal bipolar (trBIP) filters, surface Laplacian in its small (sLAP) and large (lLAP) derivation. Asterisks (*) mark significantly different pairs identified by the post hoc test. Features used in the classification step were selected from the hand (blue) and the foot (red) scalp areas by means the stepwise regression. The differences pointed out in the post-hoc test are marked accordingly. Although the figure does not report (to not reduce the figure readability) the comparison between RAW and others
10
filters, all filters differ from ear-reference, except for the trBIP/ loBIP in the hands /feet scalp area, respectively. ... 44
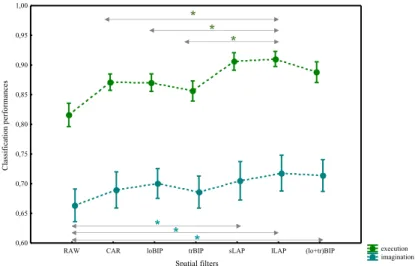
Figure 6 - Classification performances (area under the ROC curve) are expressed as mean ± SE (standard error, n=28 healthy subjects) and computed for each spatial filter: ear reference (RAW), common average reference (CAR), longitudinal bipolar (loBIP) and transversal bipolar (trBIP) filters, surface Laplacian in its small (sLAP) and large (lLAP) derivation and the filter obtained by pooling EEG features from bipolar domains together (lo+tr)BIP. Asterisks (*) mark significantly different pairs identified by the post hoc test. The evaluation was performed for the executed (green) and imagined (light blue) movement runs. The differences pointed out in the post-hoc test are marked accordingly. Although the figure does not report the comparison between RAW and others filters, all filters differ from ear-reference when the movement was executed. ... 46
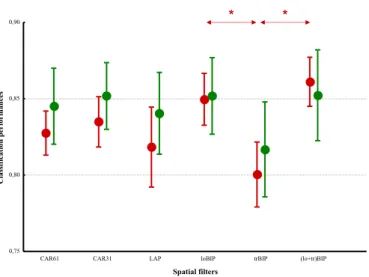
Figure 7 - Classification performances (area under the ROC curve values) are expressed as mean ± SE (standard error; n=15 patients) and computed for each spatial filters: common average reference on all recorded channels (CAR61), common average reference on 31 channels (CAR31), large surface Laplacian (LAP), longitudinal bipolar filters (loBIP), transversal bipolar (trBIP) filters and that obtained by pooling EEG features from bipolar domains together (lo+tr)BIP. Asterisks (*) mark significantly different pairs identified by the post hoc test. Red and green markers refer to the motor imagery of unaffected and affected hand respectively. ... 56
Figure 8 - Box plots of the number of electrodes needed to collect EEG signals and extract from them the features required by the classifier to reach the performance shown in Figure. Common average reference on all recorded channels (CAR61), common average reference on 31 channels (CAR31), large surface Laplacian (LAP), longitudinal bipolar filters (loBIP), transversal bipolar (trBIP) filters and that obtained by pooling EEG features from bipolar domains together (lo+tr)BIP are the spatial filters applied on EEG data collected while subjects performed hand movements with their unaffected (red) and affected (green) hand. ... 58
11
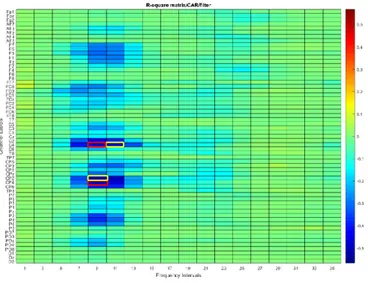
Figure 10 - R-square matrix (channels and frequency intervals) obtained from EEG data collected during the Pre-intervention session from a subacute stroke subject with right-sided lesions (subject #7). The red (channels CP4 and C4 at 9 Hz) and yellow rectangles (channels CP2 and C4 at 9 Hz and 11 Hz, respectively) are features selected by an expert neurophysiologist (manual procedure) and no-skilled user (guided procedure), respectively. ... 74
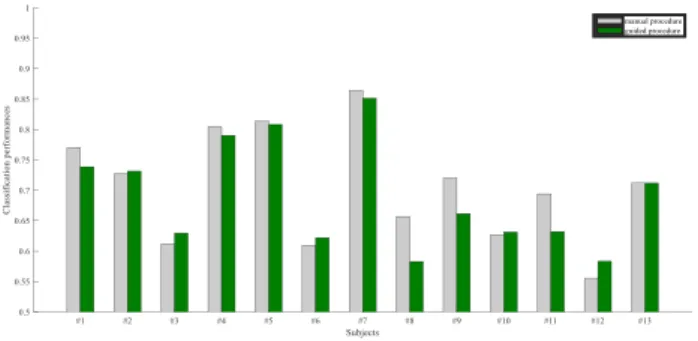
Figure 11 - For each subject (13 subacute stroke subjects) classification performance values obtained with features selected by manual (grey) and guided (green) procedures. ... 78
Figure 12 - Visual cue for the experimental task. After 5 seconds of rest, subject had to follow the force outline performing the ankle dorsiflexion and reaching the target force (60 ± 5 percentage of his maximum voluntary contraction, MVC) in ballistic fashion or in 1s (fast), 2s (medium), 3s (slow), before going back in the rest position. Each trial began when a cursor appeared in the left bottom side of the screen. The cursor moved on the line toward the right side at constant velocity. Its vertical position depended on the signal detected by the force transducer. ... 88
Figure 13 - The LSDA-based MRCP detection pipeline. Upper panel Training step: Transformation matrix (W) was computed applying LSDA algorithm to the training dataset. Lower panel Testing step: After the dimensionality reduction (𝑇𝑇𝑇𝑇𝑇𝑇𝑇𝑇𝑇𝑇𝑇𝑇𝑇𝑇 𝑃𝑃𝑃𝑃𝑃𝑃𝑃𝑃𝑇𝑇𝑃𝑃𝑇𝑇𝑇𝑇𝑃𝑃𝑇𝑇 = 𝑊𝑊′ ×
𝑇𝑇𝑇𝑇𝑇𝑇𝑇𝑇𝑇𝑇𝑇𝑇𝑇𝑇 𝐷𝐷𝐷𝐷𝑇𝑇𝐷𝐷𝑇𝑇𝑇𝑇𝑇𝑇) , a k-nearest neighbors (k-NN) classifier returned the
predicted labels, finally post-processed. ... 90
Figure 14 - Adaptive algorithm flowcharts. (Upper panel) LSDA followed by the incremental updating of the linear discriminant analysis (LSDA + iLDA), every time new EEG samples are collected, they update the parameters of the iLDA algorithm. (Middle panel) incremental LSDA (iLSDA), every time new EEG samples are collected, the linear transformation matrix (W) is re-computed and applied to new testing data. (Lower panel) incremental LSDA followed by the linear discriminant analysis (iLSDA+LDA), every time new samples are collected the linear transformation matrix (W) is re-computed and applied to the new testing data, which dimensionality is further reduced by LDA algorithm. For each panel, training data is used to compute the transformation matrix by means the LSDA algorithm. Testing data are
12
multiplied by the transformation matrix (W) to obtained the testing projections. The k-NN classifier and the label post-processor work as in the basic LSDA (Figure 13). All algorithms returned the predicted labels which were post-processed to compute performance indices. ... 97
Figure 15 - True detection rate, TDR, (Left axis) and False Positive per minute, FP/minute, (Right axis), presented as mean ± SE (standard error, 6 subjects), as a function of the percentage of EEG data used for the initial training of the algorithm LSDA, locality sensitive discriminant analysis. ...101
Figure 16 - (Left Panel) True detection rate, TDR, computed for the subject S01 and presented as a function of the percentage of EEG data used for the initial training of the algorithm LSDA, locality sensitive discriminant analysis. (Right Panel) Amplitude (µV) of the movement-related cortical potential (MRCP) as function of time (s) for each trial (25 trials). Train the model from eighty percent of trials (20 trials) and test by the last five trials has resulted in a minimum of the TDR curve (Left panel, TDR=0.4). Last five trials (e.g. trials 23 and 24) showed features different from the previous trials: they were identified 1.2s before the movement onset and, because of the constraints defined for the specific application, their detection did not increase the count of the true detection to eventually compute the true detection rate. ...104
Figure 17 - Muscles recorded during the experimental protocol from both upper limbs (unaffected and affected). ...124
Figure 18 - Onset Time of the muscle contraction measured (in seconds) respect to the beginning of each repetition of the task. Results are presented as mean ± SE (standard error) across subjects and evaluated for each condition, unaffected upper limb muscles in Pre-intervention session (Pre-Unaffected), affected upper limb muscles in Pre-intervention session (Pre-Affected), affected upper limb muscles in Post-intervention session (Post-Affected) and for each muscle, flexor digitorum (Flex Dig, in blue) and extensor digitorum (Ext Dig, in green). Left panel: Hand opening. Right panel: Hand closing. ...134
Figure 19 - Maximum activation level (normalized value, see Materials and Methods paragraph for the procedure), presented as mean ± SE (standard error) across subjects, evaluated for each condition, unaffected upper limb muscle in Pre-intervention session
(Pre-13
Unaffected), affected upper limb muscle in Pre-intervention session (Pre-Affected), affected upper limb muscle in Post-intervention session (Post-Affected) and muscles, flexor digitorum (Flex Dig, in blue) and extensor digitorum (Ext Dig, in green). Left panel: Hand opening task. Right panel: Hand closing task. ...140
Figure 20 - Baseline activation level (normalized value, see Materials and Methods paragraph for the procedure), presented as mean ± SE (standard error) across subjects, evaluated for each condition, unaffected upper limb muscle in Pre-intervention session (Pre-Unaffected), affected upper limb muscle in Pre-intervention session (Pre-Affected), affected upper limb muscle in Post-intervention session (Post-Affected) and muscles, flexor digitorum (Flex Dig, in blue) and extensor digitorum (Ext Dig, in green). Left panel: Hand opening task. Right panel: Hand closing task. ...143
Figure 21 - Spatio-condition representation of the hand opening task. Number of activations, as percentage of the total number of repetitions, evaluated for the muscle reported on x-axis in the condition reported on y-axis. Three conditions have been considered (from bottom to top, movement executed with unaffected upper limb in Pre-intervention session, with affected upper limb in both Pre- and Post-intervention sessions). For each point (muscle-condition) the diameter of the circle is proportional to the number of activations in the circle. Colours correspond to the upper limb segment to which muscles belong (green forearm, yellow arm, red shoulder, light blue unaffected limb during task executed with the affected upper limb). Upper panel Subject #5. Lower panel Subject #11. ...146
Figure 22 - Spatio-condition representation of the hand closing task. Number of activations, as percentage of the total number of repetitions, evaluated for the muscle reported on x-axis in the condition reported on y-axis. Three conditions have been considered (from bottom to top, movement executed with unaffected upper limb in Pre-intervention session, with affected upper limb in both Pre- and Post-intervention sessions). For each point (muscle-condition) the diameter of the circle is proportional to the number of activations in the circle. Colours correspond to the upper limb segment to which muscles belong (green forearm, yellow arm, red shoulder, light blue unaffected limb during task
14
executed with the affected upper limb). Upper panel Subject #5. Lower panel Subject #11. ...147
Figure 23 - Subject interface, implemented in BCI2000 [31], that guides subjects in the run. Left panel, Rest trial. Right panel, task trial. The patient was instructed to start the experimental task when the cursor reached the green rectangle and continue it until the end of its trajectory. ...174
15
List of tables
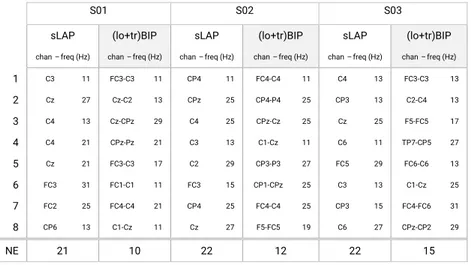
Table 1 - List of the features (feature: channel-frequency) selected in small surface Laplacian (sLAP) and (lo+tr)BIP feature domains. No statistical difference for this pair of filters from the previous analysis (aim b). Three representative subjects (S01, S02, S03) were considered for the comparison. The classification performances, for each subject, are the same for both filters. Channels positions are conformed with 10-20 International System. Each channel indicated in sLAP is the central electrode of the difference (e.g., C3 is the central electrode: the surface Laplacian involved its neighbors C1, C5, FC3, CP3). NE is the number of electrodes needed to realize the hardware montage. ... 48
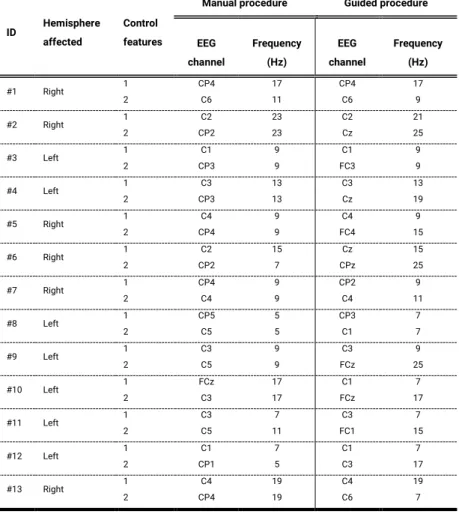
Table 2 - BCI control features identified from EEG data collected in the Pre-intervention session (for all subjects) by an expert neurophysiologist (manual procedure) and by a no-skilled user (guided procedure). For each feature, EEG channel and frequency are reported in the left and right columns for the manual and guided procedures, respectively. ... 76
Table 3 - Parameters and corresponding values tested in the MRCP detection model ... 94
Table 4 - Performance indices, True Detection Rate, TDR, and False Positive per minute, FP/min, for subject S01. Indices were computed for each percentage of EEG data used for the initial training of the algorithms. Algorithms: locality sensitive discriminant analysis (LSDA), LSDA followed by the incremental updating of the linear discriminant analysis (LSDA + iLDA), incremental LSDA (iLSDA), incremental LSDA followed by the linear discriminant analysis (iLSDA+LDA). For each performance index and percentage of the training set for the initial training of each algorithm, the best classifiers are typed in bold. The score achieved by each classifier, for each performance index, is reported in the last row of the table. ...105
Table 5 - Performance indices, True Detection Rate, TDR, and False Positive per minute, FP/min, for subject S02. Indices were computed for each percentage of EEG data used for the initial training of the algorithms. Algorithms: locality sensitive discriminant analysis (LSDA), LSDA followed by the incremental updating of the linear discriminant
16
analysis (LSDA + iLDA), incremental LSDA (iLSDA), incremental LSDA followed by the linear discriminant analysis (iLSDA+LDA). For each performance index and percentage of the training set for the initial training of each algorithm, the best classifiers are typed in bold. The score achieved by each classifier, for each performance index, is reported in the last row of the table. ...107
Table 6 - Performance indices, True Detection Rate, TDR, and False Positive per minute, FP/min, for subject S03. Indices were computed for each percentage of EEG data used for the initial training of the algorithms. Algorithms: locality sensitive discriminant analysis (LSDA), LSDA followed by the incremental updating of the linear discriminant analysis (LSDA + iLDA), incremental LSDA (iLSDA), incremental LSDA followed by the linear discriminant analysis (iLSDA+LDA). For each performance index and percentage of the training set for the initial training of each algorithm, the best classifiers are typed in bold. The score achieved by each classifier, for each performance index, is reported in the last row of the table. ...109
Table 7 - Performance indices, True Detection Rate, TDR, and False Positive per minute, FP/min, for subject S04. Indices were computed for each percentage of EEG data used for the initial training of the algorithms. Algorithms: locality sensitive discriminant analysis (LSDA), LSDA followed by the incremental updating of the linear discriminant analysis (LSDA + iLDA), incremental LSDA (iLSDA), incremental LSDA followed by the linear discriminant analysis (iLSDA+LDA). For each performance index and percentage of the training set for the initial training of each algorithm, the best classifiers are typed in bold. The score achieved by each classifier, for each performance index, is reported in the last row of the table. ...110
Table 8 - Performance indices, True Detection Rate, TDR, and False Positive per minute, FP/min, for subject S05. Indices were computed for each percentage of EEG data used for the initial training of the algorithms. Algorithms: locality sensitive discriminant analysis (LSDA), LSDA followed by the incremental updating of the linear discriminant analysis (LSDA + iLDA), incremental LSDA (iLSDA), incremental LSDA followed by the linear discriminant analysis (iLSDA+LDA). For each performance index and percentage of the training set for the initial training of each algorithm, the best classifiers are typed in bold. The
17
score achieved by each classifier, for each performance index, is reported in the last row of the table. ...112
Table 9 - Performance indices, True Detection Rate, TDR, and False Positive per minute, FP/min, for subject S06. Indices were computed for each percentage of EEG data used for the initial training of the algorithms. Algorithms: locality sensitive discriminant analysis (LSDA), LSDA followed by the incremental updating of the linear discriminant analysis (LSDA + iLDA), incremental LSDA (iLSDA), incremental LSDA followed by the linear discriminant analysis (iLSDA+LDA). For each performance index and percentage of the training set for the initial training of each algorithm, the best classifiers are typed in bold. The score achieved by each classifier, for each performance index, is reported in the last row of the table. ...113
Table 10 - Latency (expressed in seconds) in MRCP detection computed for each subject and for the LSDA algorithm (no-adaptive algorithm) and the best algorithm identified. Algorithms: locality sensitive discriminant analysis (LSDA), LSDA followed by the incremental updating of the linear discriminant analysis (LSDA + iLDA), incremental LSDA (iLSDA), incremental LSDA followed by the linear discriminant analysis (iLSDA+LDA). Results are presented as median value and inter-quartile range (IQR). Values below zero mean that the detections predate the movement onset (detected by the force transducer). ...115
Table 11 - Runtime (expressed in seconds) of each adaptive algorithm, presented as mean ± standard deviation (across trials). In the computation the time required for the initial training of the model based on LSDA were not considered. Algorithms: locality sensitive discriminant analysis (LSDA), LSDA followed by the incremental updating of the linear discriminant analysis (LSDA + iLDA), incremental LSDA (iLSDA), incremental LSDA followed by the linear discriminant analysis (iLSDA+LDA). ...116
Table 12 - Demographic and clinical characteristics of stroke patients. For each patient sex (M, male; F, female), age (in years), time from event (in months), event description, affected hemisphere (R, right; L, left), clinical evaluations in term of Medical Research Council (MRC) Scale for muscle Strength, Modified Ashworth Scale (MAS) for spasticity,
18
Fugl-Meyer Assessment (FMA) Scale, evaluated in Pre-intervention session (top row) and Post-intervention session (bottom row). ...126
19
General introduction
Every two seconds, someone in the world experiences stroke [1]: an acute injury occurring in the brain caused by ischemia or haemorrhage. Stroke is one of the leading causes of long-term motor disability [2] and, as such, directly impacts on daily living activities. Therefore, identifying new strategies to recover motor function is a central goal of clinical research.
Driven by advances in technological areas, in the last years the approach to the post-stroke function restore has moved from the physical rehabilitation to the evidence-based neurological rehabilitation. The latter has its foundations in the principles of neuroplasticity, involved in growth as well as after acquired brain injury.
Brain-Computer Interface (BCI) technology offers the possibility to detect, monitor and eventually modulate brain activity. The potential of guiding altered brain activity back to a physiological condition through BCI and the assumption that this recovery of brain activity leads to the restoration of behaviour [3] is the key element for the use of BCI systems for therapeutic purposes.
20
To bridge the gap between research-oriented methodology in BCI design and the usability of a system in the clinical realm requires efforts towards BCI signal processing procedures that would optimize the balance between system accuracy and usability. My PhD thesis focuses on this issue. The aim is to propose new algorithms and signal processing procedures that, by combining physiological and engineering approaches, can provide the basis for designing more usable BCI systems to support post-stroke motor recovery.
21
Chapter 1
Brain-Computer Interfaces for post-stroke
functional motor recovery
A brain-computer interface (BCI) is a system that measures central nervous system (CNS) activity and converts it into artificial output that replaces, restores, enhances, supplements or improves natural CNS output and thereby changes the ongoing interactions between the CNS and its external or internal environment [4].
My research activities focused on BCIs based on the electrophysiological phenomena occurring in the brain and recorded from the scalp (electroencephalography, EEG). Specifically, these BCI systems record the EEG signals, extract specific measures (features) from them and real-time convert them into output that act upon the outside world or the body itself (Figure 1).
During the last decades, different approaches have been proposed in BCI technology. A possible classification can be based on the control features used: single (brain) feature or multiple (brain-brain, brain-others) features.
22 Figure 1 - Overview of a BCI system. EEG signals, acquired from the scalp,
are processed and analysed to extract specific signal features. These features are translated into commands that operate a device or feedbacks provided to the subject.
Single feature BCIs
Single feature BCIs are distinguished by the particular EEG (i.e. brain) feature that they use to control the system. This work focused on sensorimotor-rhythms and movement-related cortical potentials BCIs.
Sensorimotor-rhythms BCI
Sensorimotor rhythms (SMRs) are oscillations in the electric field recorded over the sensorimotor cortex. They typically fall into two major frequency bands: µ (8-12 Hz) and β (18-30 Hz). Voluntary movements are associated with µ and β event-related desynchronization (reduction in rhythmic activity related to an internally or externally paced event) localized over sensorimotor cortex [4] that can be measured using non-invasive BCIs (i.e. EEG-based BCIs).
SIGNAL ACQUISITION AND PROCESSING FEATURE EXTRACTION FEATURE TRANSLATION OUTPUT
23
Since mental practice in the form of movement imagination (MI) engages areas of the brain that govern movement execution, it has long been envisaged as a cognitive strategy to enhance post-stroke motor recovery [5]. Such reiterated engagement of motor areas is intended to influence brain plasticity phenomena, improving functional outcomes [6]. In this view, the combination of MI practice by means of SMRs-based BCI technology allows the access of the MI content under controlled conditions [7] thus, revealing the rehabilitative potential of MI.
At IRCCS Santa Lucia Foundation (Rome, Italy) the multidisciplinary team (neuroscientists, bioengineers and clinical rehabilitation experts) of the Neuroelectrical Imaging and BCI Lab conceptualized and developed a BCI prototype to support hand MI training in stroke patients [8]. The core of the device is a non-invasive EEG- based BCI which allows quantitative and controlled monitoring and reinforcement of EEG patterns generated by MI and provides patients with an ecologically enriched feedback: a realistic virtual representation of their own hands. At the same time, feedback about the patient’s MI performance is provided to the therapist on a separate screen. This allows the therapist to monitor the patient’s success in imagining the task and provide additional
24
feedback via verbal instructions/encouragement, resembling the setting of a traditional motor rehabilitation session.
To prove the clinical efficacy in improving hand functional motor recovery of the approach a randomized controlled clinical trial was performed [9]. Twenty-eight subacute unilateral, first ever stroke patients were recruited and randomly assigned to receive (as adjunctive to conventional physiotherapy) either a 1-month of MI-based BCI training or the same MI training with no (contingent) feedback (i.e., with no BCI-assisted). All patients were trained to perform MI of the affected hand movements, grasping and finger extension. Control EEG features for BCI training were selected by an expert neurophysiologist from the central and centroparietal electrodes located over the affected hemisphere that had shown desynchronization patterns (i.e. a decrease in spectral power) at EEG relevant (because modulated by the task) sensorimotor frequency. Reinforce the individual EEG patterns of reactivity that most resembled the physiological activation was the aim pursued through the BCI training. At completion of training, the BCI group showed a significantly greater improvement (Figure 2, left panel) in Fugl-Mayer scores [10], also accompanied by a significant increase of EEG motor-related oscillatory activity over the lesioned hemisphere.
25
The prototype in [9], engineered and implemented as an all-in-one BCI-supported MI training station, called Promotoer (Figure 2, right panel), is currently employed as add-on to standard therapy in one of the rehabilitation wards of IRCCS Santa Lucia Foundation (Rome, Italy).
Figure 2 - Left Panel: [9] Bar diagram of the effectiveness of clinical
outcome measures, Fugl–Meyer Assessment (FMA), Medical Research Council scale for muscle strength (MRC), National Institute of Health Stroke Scale (NIHSS), in the 2 groups (BCI and no-BCI-assisted groups ). Asterisks mark significant differences between groups (independent-samples t test, p< 0.05). Right panel: The all-in-one BCI-supported MI training station, Promotoer, installed in a ward of the IRCCS Santa Lucia Foundation (Rome, Italy).
Movement-related cortical potentials BCI
Movement-related cortical potentials (MRCPs) are low frequency potentials associated with the planning and the execution of voluntary movements and measurable over the
26
sensorimotor cortex. They forerun the onset of actually executed movements as well as imagined movements [11] and occur both in cue-based or self-paced voluntary movements. Since 2 seconds before the movement onset, indeed, a negative deflection (Figure 3) can be observed in the EEG signal; its peak of maximal negativity occurs closeness the onset of the movement [12]. The negative deflection consists of the readiness potential and the motor potential, associated with the planning/preparation [13] and the execution of the movement, respectively. The rebound phase, occurring after the peak of maximum negativity and also known as a movement-monitoring potential, is, instead, associated with the movement precision [14].
Since the initial negative phase of the MRCP can be detected before the onset of executed and imagined movements, MRCPs have been exploited to design rehabilitative protocols based on the principle of Hebbian associativity. According to Hebb, synapses that experience correlated activation of two different inputs are strengthened, whereas those weakened by uncorrelated activity are lost [15].
27
Figure 3 - Amplitude (µV) of the movement-related cortical potential (MRCP) as function of time (s): 0s corresponds to the movement onset. BP1 and BP2 are, respectively, early and late Bereitschaftspotential (readiness potential), MP, motor potential, and MMP, movement-monitoring potential.
This approach, implemented as a brain state-dependent peripherical stimulation protocol, was demonstrated to induce significant plasticity of the damaged cortex in stroke patients, translating directly into a functional improvement [16]. Briefly, once the MRCP was detected, the artificial activation of somatosensory afferents that project onto the motor cortex was triggered by means of non-invasive direct nerve stimulation. Peripheral nerve stimulation was timed to arrive at the motor cortex during the peak negative phase of the movement-related cortical potentials, inducing a causal relation
28
between the sensory signals arising from muscles involved in the movement and the physiologically generated brain wave during the movement imagination, attempt or execution. Only if the stimulation arrives during the peak negative deflection of the potential, it can lead to significant increasing in cortical excitability [17] and improvement in motor function.
Multiple features BCI
Recently, novel approaches based on more than one features have been proposed in BCI field. According to a recent review [18], information from
▪ two features of the brain signal, ▪ two different brain imaging methods,
▪ one feature of the brain signal and other physiological signal,
▪ one feature of the brain signal and another conventional input
has been combined in the framework of the so-called hybrid BCI.
29
In this thesis the combination of brain activity (i.e. EEG) and muscular activity recorded by the surface electromyography (EMG) is the meaning of the word hybrid BCI.
Hybrid EEG-EMG BCIs have been proposed in several BCI applications for communication or substitution: the signals can be fused as one input to the classifier or used independently, to ultimately increase the accuracy of the control [18], [19], [20], [21], [22].
In rehabilitative contexts, hybrid BCIs can combine residual EMG activity with motor-related brain activation and provide a contingent reward which aims at re-establishing the link between the CNS and the periphery that is disrupted by the stroke [23]. It has been shown that even in severely paralysed patients the residual EMG activity induced by motor attempt can be reinforced via a MI-based BCI training and then reliably used as a control signal in a further stage of rehabilitation [24]. Therefore, a modular approach, including different bioelectrical signals (EEG only, EEG combined with EMG) according to the patients’ residual abilities and to the stage of recovery, could be envisaged.
31
Chapter 2
BCI technology translation to clinical realm
The research activity of three-years PhD program has been conducted in cooperation with the Neuroelectrical Imaging and Brain-Computer Interface Laboratory of the IRCCS Santa Lucia Foundation (Rome, Italy). It took advantage from the stimulating discussion with clinical experts (therapists and neurophysiologists). Therefore, in the context of supporting medicine (i.e. rehabilitative intervention post-stroke) with engineering methods, at the same time inspired by the physiological approaches, the fundamentals of this PhD thesis find the basis.32
Thesis aim
Developing a flexible, usable and affordable BCI-driven device for post-stroke motor rehabilitation, that reinforces both brain patterns and residual muscular ability is the main goal of my project.
In this view two sub-goals were planned:
▪ investigate if improvements (new algorithms or new signal processing procedures) in the main blocks of the BCI system (pre-processing, feature extraction and translation, separately considered) can bring advantages in term of usability and affordability requirements;
▪ implement a procedure to analyse the residual muscle activity collected from stroke patients and extract the electromyographic features able to describe the good muscular recovery during rehabilitative intervention and follow each patient along the motor recovery process. From this point of view, the new device could be flexible and adaptable to different patients with variable degrees of impairment.
33
Thesis outline
The thesis consists of four main chapters.
In chapter 3, two studies will be presented and synthetically discussed. The first will introduce a new approach to the pre-processing of BCI data and compare it with the gold standard procedures applied to analyse EEG data collected during SMRs-based BCI protocol. The second will assess the impact of results obtained in the first study on BCI data collected from subacute stroke subjects performing hand MI tasks.
In chapter 4, one of the key points of the SMRs-BCI-assisted MI training will be investigated: the feature selection. The semiautomatic method developed to support the procedure will be described and compared with the current (manual) procedure applied by neurophysiologists.
After having investigated two first blocks of the BCI systems (signal pre-processing and feature extraction/selection), the impact of adaptive learning in the classification step will be assessed. In Chapter 5, three adaptive algorithms will be briefly described and compared with no-adaptive approach. While the key point of the SMRs-based BCI-assisted MI training in [9] is that the control feature doesn’t change because its selection
34
and control is crucial for the rehabilitative purpose, there are some applications (i.e. MRCP detection) in which the efficacy of the rehabilitative intervention depends also on the ability of the BCI technology to adapt its parameters in time to comply the physiological changes occurring in the brain. For this reason, the study about adaptive learning was conducted on data collected from healthy subjects while performing the ankle dorsiflexion (typical task of MRCP-based BCI protocols). In chapter 6, a preliminary analysis of EMG signals from 12 stroke patients will be performed. Changes in affected upper limb EMG pattern, after both stroke event and rehabilitative intervention, will be assessed to take inspiration to design the new EMG feature to control hybrid EEG-EMG BCI.
General conclusion will summarize the main key points of this PhD thesis.
35
Chapter 3
New approaches to BCI data pre-processing
Introduction
Spatial filters are generally designed to enhance sensitivity to particular brain sources, to improve source localization and/or to suppress artefacts. Most commonly, spatial filters are selected as a linear combination (i.e. weighted sums) of channels. There are several approaches for determining the set of spatial filter weights. These approaches fall into two major classes: data-independent and data-dependent spatial filters [4]. Data-independent spatial filters typically use fixed geometry relationships to determine the spatial-filter weights: they are based on physical consideration regarding how EEG signals travel through the skin and skull. Data-dependent spatial filters determine the weights directly from each BCI user’s data; they can be classified into unsupervised data-driven (i.e. principal component analysis, PCA, or independent component analysis, ICA) and supervised data-driven filters (i.e. common spatial pattern, CSP) [25].
36
The proper selection of the spatial filter depends on the location and extent of the control signal and of the various sources of EEG or non-EEG noise.
In sensorimotor rhythms-based BCIs several approaches have already been proposed. Although recent studies propose the EEG data pre-processing by mean the CSP filter [26], [27], the surface Laplacian and the common average reference (CAR) are still among the most employed filters since they enhance the focal activity from the local sources and reduce the widely distributed activity [28]. Moreover, concerning the two variations of the Laplacian filter, i.e. the large and the small Laplacian, it appears that they are the best filters in target prediction and source identification, respectively [29].
This chapter focuses on data-independent spatial filters and proposes a new approach to the spatial filtering step in sensorimotor rhythms-based BCI that includes
▪ the introduction of bipolar derivations (commonly used in clinical EEG),
▪ the simultaneous use of more spatial filters,
37
Two studies were carried out: the first (Neurophysiological-based signal processing) aimed to investigate and characterize the proposed approach, the second aimed to evaluate the result impact on the SMRs-based BCI technology in supporting post-stroke motor rehabilitation.
Neurophysiological-based signal processing
EEG data, previously collected from thirty-nine healthy subjects during the motor execution and imagination of hand and feet movements, were analysed to compare the
a) performance of different spatial filters (commonly used spatial filters and bipolar derivations) as a function of the cortical region elicited by the experimental task, b) performance of the spatial filters, previously considered,
and that obtained by pooling information coming from different spatial filters together.
Materials and Methods
Data Collection
EEG data were collected from thirty-nine healthy subjects according the protocol and the procedure in [30]. Before the
38
inclusion in the study, approved by the IRCCS Santa Lucia Foundation (Rome, Italy) ethics committee, each subject gave written informed consent.
Briefly, EEG data were collected from 58, 59 or 61 electrodes assembled on a cap (according to an extension of the 10-20 International System, referenced to both ear lobes), amplified and sampled at 200 Hz (per channel) by a commercial EEG system (BrainAmp, Brain Products GmbH, Germany).
Subjects were comfortably seated in a reclining chair in a dimly lit room and instructed to minimize muscular, electrooculographic and blink activity. Subjects were asked to execute (first run) and imagine (second run) movements of both their hands (opening and closing) or feet (ankle dorsiflexion) upon the appearance (randomly) on the screen of top or bottom targets, respectively. The sequence was repeated three times for a total of six runs. Each trial (30 trials for each run) began when a target appeared on a side of the screen (Figure 4). The trial lasted 5.8 seconds, with the inter-trial interval of 1.8 seconds.
39
Figure 4 - Example of subject interface: subjects performed the execution or imagination (acquired in separate runs) of the ankle dorsiflexion (foot movement) when the target appeared in the bottom side of the interface. User interface designed by BCI2000 [31] software system.
Data Analysis
EEG data were offline analysed: band-pass filtered (0.1-70 Hz) with a forth order Butterworth filter and notch filtered at 50 Hz. The following spatial filters, conventional ear reference, common average reference, two Laplacian derivations (small and large) [28] and two bipolar derivations (longitudinal and transversal), were considered. In the bipolar derivations (applied via software) each voltage difference was computed between two channels, longitudinally subtracting e.g. FCz from Fz and transversely subtracting e.g. Cz from C1.
After the spatial filtering step, EEG data were divided into epochs 1 second long. The spectral analysis was performed on task epochs employing the maximum entropy method (16th order model, 2 Hz resolution, considering no overlapped epochs) [32]. All possible features (one for each couple
40
channel-frequency bin) in a reasonable range (i.e., 0-36 Hz) were extracted and analysed. A feature vector (spectral amplitude at each bin for each channel) was extracted from each epoch.
For the aim (a) movement execution runs were analysed. Since it was a SMRs-based BCI protocol, the analysis was constrained to features belonging to the sensorimotor strip (FC, C and CP channels) in the range from 7 Hz to 31 Hz (relevant frequencies). Moreover, hands opening/closing and feet flexion engage separate areas of the sensorimotor strip, different from both anatomical and functional point of view. Therefore, two scalp regions were considered: the hand area defined as the area containing FC, C and CP electrodes in all their even and odd positions (bilateral area); the feet area defined as the area containing electrodes placed on the midline, e.g. FCz.
Features belonging to each area were the input for the stepwise regression [33] whereby the subset of features and weights, optimal to build an effective regression model to evaluate the relationship between the features and the dependent variable (here equivalent to subject’s movement), was identified. The maximum number of features to be selected by the stepwise regression algorithm was set, for all feature domain (one
41
domain for each spatial filter), to eight accordingly to the results obtained in a preliminary study (not reported in this thesis). The latter aimed to compute the optimal number of features above which the classification performance average (across tasks and subjects) didn’t grow in a significant way. Results showed that increasing the number of features (above eight) did not result in significantly better performance values.
A linear approach (stepwise linear discriminant analysis, SWLDA, [34]), based on the combination of features and weights returned by the stepwise regression, was applied for the classification of the EEG epochs. A 15-fold cross-validation design was implemented and classification performance in term of the area under the Receiver Operating Characteristic (ROC) [35] curve were assessed for each feature domain (one for each spatial filter applied).
For the aim (b) execution and imagination runs were analysed. Only twenty-eight subjects performed both executed and imagined movements. For this analysis, features from both hand and foot areas were considered together as a single feature domain. Therefore, the analysis included six feature domains, each one extracted from EEG signals pre-processed by one of six filters earlier defined, and a new feature domain
42
obtained by pooling EEG features from longitudinal and transversal bipolar filters together. The performance assessment followed the same stages in (a).
Statistical Analysis
For each spatial filter, the Shapiro-Wilk test was applied to assess the normality of the performance value distribution. To investigate the performance of different spatial filters in relation to the scalp area (aim a), classification performances (in movement execution runs) were analysed by means an ANOVA statistical design, the repeated measures two-way analysis of variance: six levels (six filters earlier listed) for the spatial filter factor, two levels (hands and feet) for the area factor.
To the aim (b), classification performances were analysed by means the two-way ANOVA statistical test (repeated measures): seven levels for the filter factor (6 filters listed earlier and the new filter obtained combining longitudinal and transversal bipolar filters information) and two levels for the modality factor (movement execution and imagination). The Tukey HSD post hoc analysis was conducted to assess pairwise differences. For all statistical analysis, threshold for statistical significance was set to p < 0.05. All results are presented as mean ± SE (standard error) across subjects.
43
Results
Figure 5 shows the classification performances (area under the ROC curve) of the considered spatial filters as a function of the cortical region elicited by the experimental task. The repeated measures two-way ANOVA revealed a significant effect of both spatial filter (F=24.85, p < 0.01) and scalp area (F=17.73, p < 0.01) factors and a significant area–filter interaction (F=7.43, p < 0.01).
All spatial filters perform better than the ear-reference method confirming the results in [28]: common average reference and large surface Laplacian spatial filters are significantly superior to the ear-reference method. Filter EEG signals by means of transversal/longitudinal bipolar filters isn’t different from not applying filters if hand/feet areas are considered, respectively. Moreover, while longitudinal bipolar filter shows performances as good as the common average reference for the hand scalp area, the transversal bipolar filter seems, on average, outperforms the common average reference and even the small Laplacian derivation in feet area.
44
Figure 5 - Classification performances (area under the ROC curve) are expressed as mean ± SE (standard error, n=39 healthy subjects) and computed for each spatial filter: ear reference (RAW), common average reference (CAR), longitudinal bipolar (loBIP) and transversal bipolar (trBIP) filters, surface Laplacian in its small (sLAP) and large (lLAP) derivation. Asterisks (*) mark significantly different pairs identified by the post hoc test. Features used in the classification step were selected from the hand (blue) and the foot (red) scalp areas by means the stepwise regression. The differences pointed out in the post-hoc test are marked accordingly. Although the figure does not report (to not reduce the figure readability) the comparison between RAW and others filters, all filters differ from ear-reference, except for the trBIP/ loBIP in the hands /feet scalp area, respectively.
hands scalp area feet scalp area RAW CAR loBIP trBIP sLAP lLAP
Spatial filters 0,70 0,75 0,80 0,85 0,90 0,95 1,00 Cla ss ifi ca tion pe rforma nce s * * * * *
45
Figure 6 shows the classification performances (area under the ROC curve) of the considered spatial filters as a function of the task modality (movement executed or imagined). The repeated measures two-way ANOVA revealed a significant effect of both spatial filter (F=19.98, p < 0.01) and modality (F=45.96, p<0.01) factors and no significant filter-modality interaction (F=2.03, p= 0.064).
The results confirm the findings in [29]: the large surface Laplacian is one of the best spatial filtering approach in target prediction. Pooling EEG features from longitudinal and transversal bipolar filters together seems, on average, perform better than each spatial filter considered individually. However, while longitudinal and transversal bipolar filters significantly differ from large surface Laplacian, no significant differences appear between the two Laplacian derivations (small and large) and the new domain (lo+tr)BIP, even when movements were imagined. Moreover, in the latter, even if each bipolar filter doesn’t statistically differ from the ear-reference spatial filter, pooling bipolar domains together outperforms the RAW filter.
46
Figure 6 - Classification performances (area under the ROC curve) are expressed as mean ± SE (standard error, n=28 healthy subjects) and computed for each spatial filter: ear reference (RAW), common average reference (CAR), longitudinal bipolar (loBIP) and transversal bipolar (trBIP) filters, surface Laplacian in its small (sLAP) and large (lLAP) derivation and the filter obtained by pooling EEG features from bipolar domains together (lo+tr)BIP. Asterisks (*) mark significantly different pairs identified by the post hoc test. The evaluation was performed for the executed (green) and imagined (light blue) movement runs. The differences pointed out in the post-hoc test are marked accordingly. Although the figure does not report the comparison between RAW and others filters, all filters differ from ear-reference when the movement was executed.
execution imagination RAW CAR loBIP trBIP sLAP lLAP (lo+tr)BIP
Spatial filters 0,60 0,65 0,70 0,75 0,80 0,85 0,90 0,95 1,00 Cla ss ifi ca tion pe rforma nce s * * * * * *
47
As a proof of concept, in Table 1 are presented features selected in the new domain (obtained pooling EEG features from bipolar filters together) and those selected in the small Laplacian domain for three subjects (same classification performances for both spatial filters). Results suggest a reduction of the number of electrodes needed to extract the features passing from the small Laplacian filter to the new domain.
48
Table 1 - List of the features (feature: channel-frequency) selected in small surface Laplacian (sLAP) and (lo+tr)BIP feature domains. No statistical difference for this pair of filters from the previous analysis (aim b). Three representative subjects (S01, S02, S03) were considered for the comparison. The classification performances, for each subject, are the same for both filters. Channels positions are conformed with 10-20 International System. Each channel indicated in sLAP is the central electrode of the difference (e.g., C3 is the central electrode: the surface Laplacian involved its neighbors C1, C5, FC3, CP3). NE is the number of electrodes needed to realize the hardware montage.
S01 S02 S03
sLAP (lo+tr)BIP sLAP (lo+tr)BIP sLAP (lo+tr)BIP
chan – freq (Hz) chan – freq (Hz) chan – freq (Hz) chan – freq (Hz) chan – freq (Hz) chan – freq (Hz)
1 C3 11 FC3-C3 11 CP4 11 FC4-C4 11 C4 13 FC3-C3 13 2 Cz 27 Cz-C2 13 CPz 25 CP4-P4 25 CP3 13 C2-C4 13 3 C4 13 Cz-CPz 29 C4 25 CPz-Cz 25 Cz 25 F5-FC5 17 4 C4 21 CPz-Pz 21 C3 13 C1-Cz 11 C6 11 TP7-CP5 27 5 Cz 21 FC3-C3 17 C2 29 CP3-P3 27 FC5 29 FC6-C6 13 6 FC3 31 FC1-C1 11 FC3 15 CP1-CPz 25 C3 13 C1-Cz 25 7 FC2 25 FC4-C4 21 CP4 25 FC4-C4 25 CP3 15 FC4-FC6 31 8 CP6 13 C1-Cz 11 Cz 27 F5-FC5 19 C6 27 CPz-CP2 29 NE 21 10 22 12 22 15
49
Discussion
Spatial filtering is a crucial step to ensure optimal BCI system performances. In this study the spatial filters (data independent spatial filters) commonly used in BCI control were compared with filters commonly used in EEG clinical application (e.g., bipolar filters). Moreover, the relation between performances shown by several (BCI and clinical gold standard) spatial filters and the sensorimotor strip areas, engaged in different movements, was investigated. Consider scalp areas separately (i.e., hands area and feet area) highlights interesting differences (e.g., from longitudinal and transversal bipolar in the feet area) that haven’t emerged considering features in the whole sensorimotor strip. Moreover, if on the one hand the longitudinal filtering doesn’t significantly differ from the gold standard filters (surface Laplacian) in the hand area, on the other hand the same trend is shown by the transversal filtering in the feet area, carrying to hypothesize a relationship between the direction of the bipolar filter yielding the highest performance and the specific cortical region elicited by the experimental task. The identification of the best spatial filter could be, therefore, related to the scalp area (its anatomical and functional properties) of interest and thus, improving performance can be pursued using specific filters for specific
50
areas. Further analysis will be oriented to investigate the reason why transversal bipolar filter shows better performance in the feet area. In addition, these findings require a consolidation by exploring their use with other motor tasks (different from hand opening/closing and feet flexion) and/or imagined movements. Integrating feature information or, specifically, pooling EEG features from bipolar (longitudinal and transversal) filters together, improves (on average) the classification performance respect to that obtained considering each domain individually. No differences were found between the performance obtained by the integrated approach and those obtained by the surface Laplacian filters (i.e., the gold standard when scalp areas were considered all together). Moreover, a preliminary comparison of the number of electrodes needed to realize the hardware montage, containing just the appropriate features selected for the rehabilitation, suggests that the use of a new integrated approach for feature extraction has the potential to reduce setup time and, therefore, enhance the usability of the BCI technology.
51
Impact on SMRs-based BCIs stroke rehabilitation
In the previous study, we observed that in a cursor control task (hand vs foot movement) processing hand scalp-area EEG data with longitudinal bipolar filters (loBIP) returns better classification performances than those of the transversal bipolar filters (trBIP). Hypothesizing that the former would return better results in all hand movement-based paradigms, we aimed at comparing
a) the classification performance of commonly used spatial filters, bipolar filters and the combination of both bipolar filters obtained by pooling EEG features together, b) the number of electrodes needed as consequence of the
spatial filter choice,
analysing EEG data collected from fifteen subacute stroke subjects during the imagination of hand movements (vs rest).
52
Materials and Methods
Data Collection
EEG data were collected from fifteen stroke subjects according the procedure and the protocol in Appendix B. Briefly, EEG data were collected from 61 electrodes assembled on an electrode cap according to an extension of the 10–20 International System, sampled at 200 Hz and notch filtered (50 Hz). All subjects were trained to perform the motor imagery of the hand movements (grasping and finger extension) with their unaffected and affected upper limbs (recorded in separate runs). Each run comprised 30 trials (15±1 rest, 15±1 motor imagery). The total duration of each trial was 7 seconds.
Data Analysis
Ocular artefacts were removed by independent component analysis [36]. EEG signal intervals containing artefacts (muscular, environmental) were identified, using a semi-automatic procedure, based on the definition of a voltage threshold, and discarded.
Recordings collected during the motor imagery of grasping and finger extension were concatenated. To consider the same number of samples for each condition (rest or task), the last 4
53
seconds of each trial were considered (i.e. while in rest trials subjects were in rest condition for 7 seconds, in task trials 3 seconds in rest condition come before 4 seconds of movement, see Figure in appendix B to detailed explanation).
For aim (a) the following spatial filters were considered: CAR61 (CAR computed on all recorded channels); CAR31 (CAR on 31 electrodes, FC-C-CP-P-PO); lLAP (large surface Laplacian); loBIP (interelectrode distance: 3 rows, e.g. FCz-Pz); trBIP (interelectrode distance: 2 columns, e.g. Cz-C3) and (lo+tr)BIP (pooled features).
EEG data collected in each experimental condition (unaffected hand MI and affected hand MI) were divided into epochs 1 second long and spectral features (spectral amplitude at each bin for each EEG channel) were extracted using the maximum entropy method (16th order model, 2 Hz resolution, no overlap) [32]. Given the specific motor rehabilitation context, spectral features belonging to the sensorimotor strip in the contralateral area to the hand involved in the task and in the range from 7 Hz to 25 Hz were used for the classification (step-wise linear discriminant analysis [34], [37]). Classification performances in term of area under the Receiver Operating Characteristic (ROC)
54
[35] curve were assessed using a 20-fold cross-validation design.
For aim (b) for each spatial filter the minimum number of physical electrodes that would be needed to extract the features identified by the stepwise algorithm in (a) as the best set required by the classifier was computed. Specifically, for each feature domain (one for each spatial filter) the stepwise method selected among the subset of features coherent with the specific application (SMRs-based BCI to support motor rehabilitation protocols) the statistically significant features to use for the classification step. The number of electrodes to record EEG data needed to extract those features was computed.
Statistical Analysis
Shapiro-Wilk tests were applied to assess the normality of the performance value distribution. To investigate the performances of different spatial filters, classification performances were analysed by repeated measures one-way analysis of variance (ANOVA). The Tukey HSD post hoc analysis was applied to assess pairwise differences. The threshold for statistical significance was set to p<0.05. Results are presented as mean ± SE (standard error).
55
Results
Statistical analysis revealed, in each condition, a significant effect of the spatial filter factor (F (5, 70)= 4.35, p <0.01 unaffected hand, F (5, 70) = 2.42, p=0.04 affected hand). Figure 7 shows the statistical analysis output and post-hoc test results. All spatial filters showed average classification performances higher than 0.8, with a similar trend for unaffected and affected hand. Common average reference spatial filter performed as well as the large surface Laplacian confirming, although in a different task, the result in [28]. Longitudinal bipolar filter performed as well as the common average reference and the surface Laplacian spatial filters. The statistical differences, pointed out by the post-hoc test, confirmed the results of the previous study. Pooling EEG features from both longitudinal and transversal bipolar filters together led to a significant better result than the transversal bipolar filter and, on average, than that of the surface Laplacian.
56
Figure 7 - Classification performances (area under the ROC curve values) are expressed as mean ± SE (standard error; n=15 patients) and computed for each spatial filters: common average reference on all recorded channels (CAR61), common average reference on 31 channels (CAR31), large surface Laplacian (LAP), longitudinal bipolar filters (loBIP), transversal bipolar (trBIP) filters and that obtained by pooling EEG features from bipolar domains together (lo+tr)BIP. Asterisks (*) mark significantly different pairs identified by the post hoc test. Red and green markers refer to the motor imagery of unaffected and affected hand respectively.
CAR61 CAR31 LAP loBIP trBIP (lo+tr)BIP
Spatial filters 0,75 0,80 0,85 0,90 Class ifi cati on p er formance s * *
57
In Figure 8 the number of electrodes needed to extract the features required by the trained classifier are illustrated. Apply the common average reference requires all collected channels (61 EEG electrodes). Consider a “smaller” version of the common average reference, including electrodes in centre-parietal scalp area, didn’t differ in term of classification performance from the whole configuration, even if fewer number of electrodes is required. Even if the surface Laplacian, the longitudinal bipolar and the combined spatial filter did not differ among them (Figure 7), the longitudinal bipolar filter seems the best filter to reduce the number of EEG electrodes.
58 Figure 8 - Box plots of the number of electrodes needed to collect EEG
signals and extract from them the features required by the classifier to reach the performance shown in Figure. Common average reference on all recorded channels (CAR61), common average reference on 31 channels (CAR31), large surface Laplacian (LAP), longitudinal bipolar filters (loBIP), transversal bipolar (trBIP) filters and that obtained by pooling EEG features from bipolar domains together (lo+tr)BIP are the spatial filters applied on EEG data collected while subjects performed hand movements with their unaffected (red) and affected (green) hand.
59
Discussion
Results suggest that the classification performances of longitudinal bipolar filter (commonly used in the clinical EEG) are as high as common average reference (the most frequently used). Moreover, the former required a significantly lower number of physical EEG electrodes to compute the features needed by the trained classifier. Among bipolar filters, longitudinal bipolar filter performed better than transversal bipolar filter, confirming the results shown in the previous study about the relationship between the direction of the bipolar filter (e.g. longitudinal rather than transversal bipolar) and the specific cortical region elicited by each experimental task (e.g. hand MI). Pooling EEG features, extracted applying both longitudinal and transversal bipolar filters, together yielded significantly higher classification results than those of the transversal but it didn’t improve the good longitudinal bipolar filter performance suggesting that information from the transversal bipolar derivations was considered by the classifier redundant information.
60
Main message
Minimizing the number of electrodes is key to transfer BCIs to clinical use, making them more affordable (lower equipment cost), more efficient (reduced setup time), and more usable (less burden for therapist and patient). The optimization of the signal processing procedure is a crucial step to achieve this goal, while preserving the effectiveness (accuracy) of the output.
The relation between the direction of the bipolar filter and the specific cortical region elicited by each experimental task suggests that useful information for optimal feature extraction in SMRs-based BCIs can be obtained taking into account neurophysiological aspects.
Though the marginal improvement in classification performances of longitudinal bipolar filters over common average reference (most frequently used) does not reach statistical significance, the significant reduction of the number of electrodes needed for the longitudinal bipolar filters suggests that the new approach, based on bipolar signals-based feature extraction, has the potential to enhance the usability of the BCI technology in post-stroke motor rehabilitation of the upper limb.
![Figure 2 - Left Panel: [9] Bar diagram of the effectiveness of clinical](https://thumb-eu.123doks.com/thumbv2/123dokorg/2892764.11359/28.629.105.524.258.415/figure-left-panel-bar-diagram-effectiveness-clinical.webp)