Sommario
1. INTRODUCTION ... 3
2. ICE TEST SECTION ... 3
a. Heat Source ... 5
b. Heat Exchanger ... 7
3. EXPERIMENTAL CAMPAIGN AND POST-TEST ANALYSIS ... 8
a. Test A: Isothermal Steady State Enhanced Circulation ... 9
b. Test B: Full Power Steady State Enhanced Circulation ... 10
c. Test C: Unprotected Loss of Cold Sink... 12
d. Test D: Unprotected Loss of Flow ... 15
4. Conclusion and Next Steps ... 17
1. INTRODUCTION
Since 1999 the ENEA Brasimone Research Centre is strongly involved in the frame of the heavy liquid metal technology development, implementing large competencies and capabilities in the frame of the nuclear energy systems, and in particular in the field of material for high temperature applications, corrosion and material protection (in liquid metal, gas, water), heat transfer and removal, component development and testing, remote maintenance, procedure definition and non-conventional coolant handling.
In the frame of the research programmes funded by the European Commission (EC), as well as national programs, R&D activities have been dedicated worldwide to the ADS concept development. In this context the Integrated Project EUROTRANS [1] “EUROpean research programme for the TRANSmutation of high level nuclear waste in Accelerator Driven Systems”, concurred to demonstrate the feasibility of an ADS system.
The main objective of EUROTRANS was to carry out a first advanced design of experimental facility demonstrating the technical feasibility of Transmutation in an Accelerator Driven System (XT-ADS), as well as to accomplish a generic conceptual design of the European Facility for Industrial Transmutation EFIT (realisation in the long-term). This step-wise approach is termed as European Transmutation Demonstration (ETD) approach.
In the frame of EUROTRANS, a dedicated Domain named DEMETRA “Development and assessment of structural materials and heavy liquid Metal technologies for Transmutation systems” was focused on the HLM technologies and materials.
ENEA assumed the commitment to perform an integral experiment with the aim to reproduce the thermal hydraulic behaviour of a relevant part of the primary system of a heavy liquid metal cooled nuclear reactor in a pool configuration, implementing a new experimental activity named ICE, to be performed in the CIRCE facility (the largest European pool-facility operating in LBE), where an appropriate test section has been installed.
The ICE activity [2,3] has been implemented to obtain information about different topics such as HLM pool thermal-hydraulics, components characterization, steady state and transient analysis in a HLM pool system, qualification of a chemistry control system for HLM pool.
Thus, the activity allowed to support the demonstration of the HLM pool-type nuclear reactor feasibility, providing fruitful experimental back-ground aiming to address the pool thermal hydraulic in a relevant scale (up to 1 MW) qualifying prototypical nuclear components, and achieving a right implementation of a reliable coolant chemistry control system into the ADS/LFR primary system. Finally, the ICE activity allowed to establish a reference experiment for the benchmark of commercial system codes when employed in HLM pool systems, providing also experimental data valuable to perform a preliminary assessment of CFD models when applied to simulate HLM pool systems.
1. ICE TEST SECTION
The ICE activity has been designed to be implemented on the CIRCE facility [2, 3, 4, 5].
outer diameter of 1200 mm and an height of 8500 mm. The main vessel can be filled with about 70 tons of molten Lead-Bismuth Eutectic (LBE), and it has been designed to host different test sections welded to and hung from bolted vessel heads for the study of the thermal-hydraulic issues related to the HLM pool systems. The main vessel is moreover equipped with auxiliary systems for eutectic circulation, with argon cover gas and recirculation system, LBE heating and cooling systems.
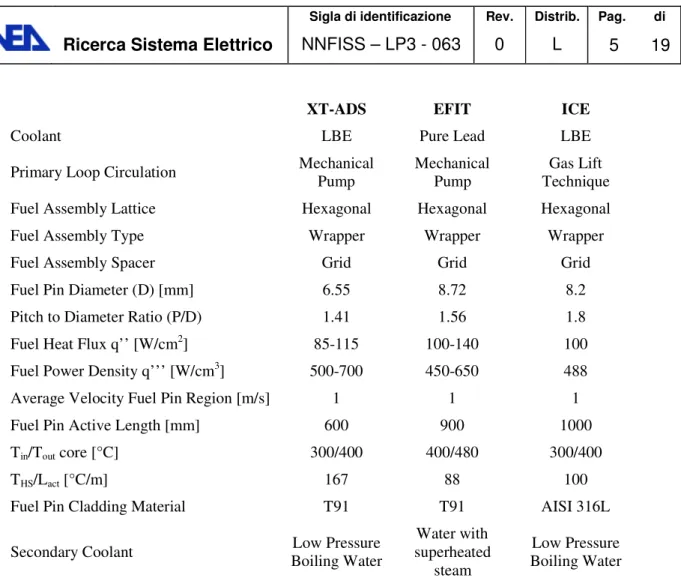
The ICE test section [2,3] was designed to reproduce, as close as possible, the thermal-hydraulic behaviour of the XT-ADS and EFIT primary systems [6,7,8,9,10] .The main experimental parameters characterizing the ICE experiments are reported in Table 1, where they are compared to the values characterising XT-ADS and EFIT.
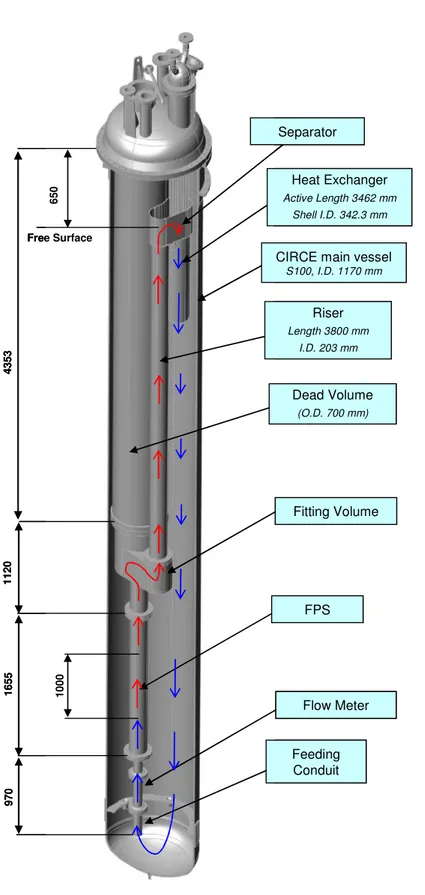
The ICE test section, to be placed inside the CIRCE main vessel (S100), consists of, among the others, the following main components, as depicted in Figure 1.
• Downcomer: it is the volume between the test section and the main vessel which allows the hydrodynamic connection between the outlet section of the Heat Exchanger (HX) with the inlet section of the feeding conduit.
• Flow Meter: it is a Venturi-Nozzle flow meter.
• Fuel Pin Simulator (FPS): it is a mechanical structure needed to take on the Heat Source (HS). • Fitting Volume: it is placed in middle part of the test section, allowing the hydraulic connection
between the HS and the riser.
• Riser: it is a pipe connecting the fitting volume with the separator. In the lower section a nozzle is installed to allow the argon injection.
• Separator: it is a volume needed to connect the riser with the HX. It allows the separation between the LBE, which flows downward into the HX, and the Argon flowing in the test section cover gas through the free surface. Moreover, the separator assures that all the LBE flows directly into HX (shell – side) before falling down in the downcomer.
• Heat Exchanger: it constitutes the heat sink of the system.
• Dead Volume: it is a component made of two concentric pipes. The inner pipe is connected by bolted junctions, to the Fuel Pin Simulator and to the cover head. The volume inside the inner pipe is called Insulation Volume. The outer pipe is welded to the inner pipe at the lower end by a flange which allows a bolted connection between the dead volume and the fitting volume. The annulus between the inner and outer pipes, kept melt-free by design, is linked to the cover gas and partially filled by thermal insulation material in order to reduce the radial heat flux towards the insulation volume.
XT-ADS EFIT ICE
Coolant LBE Pure Lead LBE
Primary Loop Circulation Mechanical
Pump
Mechanical Pump
Gas Lift Technique
Fuel Assembly Lattice Hexagonal Hexagonal Hexagonal
Fuel Assembly Type Wrapper Wrapper Wrapper
Fuel Assembly Spacer Grid Grid Grid
Fuel Pin Diameter (D) [mm] 6.55 8.72 8.2
Pitch to Diameter Ratio (P/D) 1.41 1.56 1.8
Fuel Heat Flux q’’ [W/cm2] 85-115 100-140 100
Fuel Power Density q’’’ [W/cm3] 500-700 450-650 488
Average Velocity Fuel Pin Region [m/s] 1 1 1
Fuel Pin Active Length [mm] 600 900 1000
Tin/Tout core [°C] 300/400 400/480 300/400
THS/Lact [°C/m] 167 88 100
Fuel Pin Cladding Material T91 T91 AISI 316L
Secondary Coolant Low Pressure
Boiling Water Water with superheated steam Low Pressure Boiling Water
Table 1. Experimental parameters adopted for the ICE activity, compared with the XT-ADS and EFIT ones
a. Heat Source
The ICE (Figure 1) heat source consists of a pin bundle made by electrical heaters with a nominal thermal power of 800 kW (total power of 925 kW); it has been designed to achieve a difference temperature through the HS of 100 °C, a fuel power density of 500 W/cm3 and an average liquid metal velocity of 1 m/s, in accordance with the reference values adopted for the ETD concepts.
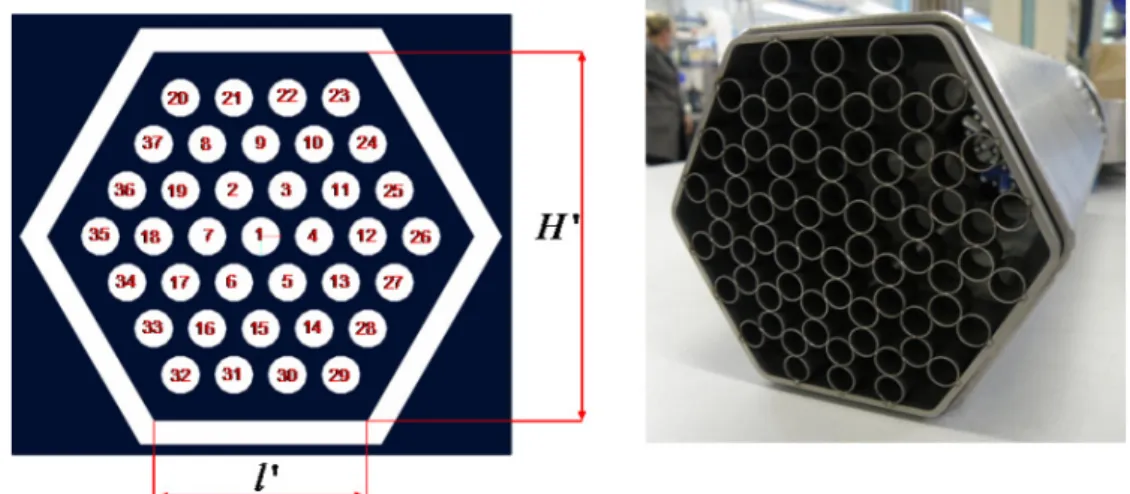
The ICE heat source consists of 37 pins placed in a wrapped hexagonal lattice with a pitch to diameter ratio (p/D) of 1.8 (Figure 2). Each pin has an outer diameter of 8.2 mm, a power of about 25 kW and a wall heat flux of 1 MW/m2. The selected active length is 1000 mm and the adopted cladding material is AISI 316L. To get an average LBE velocity of 1 m/s, a flow rate of 60 kg/s is needed through the HS.
Along the HS, three spacer grids (Figure 2) are placed aiming to assure the relative position of the pins inside the bundle, to improve the mixing of the coolant (by a vortex shedding along the main stream) and to guarantee a uniform and constant sub-channel cross section during the tests.
Heat Exchanger Active Length 3462 mm Shell I.D. 342.3 mm Feeding Conduit Separator
CIRCE main vessel
S100, I.D. 1170 mm Riser Length 3800 mm I.D. 203 mm Dead Volume (O.D. 700 mm) Fitting Volume FPS Flow Meter 9 7 0 1 6 5 5 1 1 2 0 4 3 5 3 1 0 0 0 Free Surface 6 5 0 Heat Exchanger Active Length 3462 mm Shell I.D. 342.3 mm Feeding Conduit Separator
CIRCE main vessel
S100, I.D. 1170 mm Riser Length 3800 mm I.D. 203 mm Dead Volume (O.D. 700 mm) Fitting Volume FPS Flow Meter 9 7 0 1 6 5 5 1 1 2 0 4 3 5 3 1 0 0 0 Free Surface 6 5 0
Due to the available pumping system in the CIRCE facility, namely the gas lift pumping system, in order to carry on the ICE activity it was necessary to decrease as much as possible the pressure drop along the heat source, which amount to about the 70-80% of the overall pressure drop. For the ICE activity a pressure head of 40 kPa is available to promote the LBE circulation along the flow path.
Figure 2. Cross Section of the ICE HS (l’=55.4 mm, H’=96mm), and a view of the adopted spacer grid
b. Heat Exchanger
For the ICE activity the cold sink consists of a cooling water circuit, a LBE-low pressure boiling water shell heat exchanger, interconnecting piping, and steam vent piping to discharge steam into the atmosphere.
In particular, the HX is made of 91 bayonet tubes. The bayonet consists of three concentric tubes (Figure 3), the outer two of which have the bottom end sealed. The water flows downward in the inner pipes, and then upward in the annulus between the inner and intermediate pipes. In the annulus vaporization takes place.
Figure 3: On the left the sketch of the Bayonet tubes adopted for the ICE heat exchanger (in red LBE, blue water, yellow water-steam mixture). On the right a view of the ICE HX installed into the test
The annulus between the middle and outer pipes is filled by pressurized helium (4.5 bar). All annuli are interconnected to form a common gas plenum, the pressure of which is continuously monitored. A leakage from either walls of any of the outer tubes is promptly detected because of depressurization of the common helium gas plenum. The two outer tubes are mechanically and thermically decoupled. This configuration allows to localize the most part of the thermal gradient, between lead and boiling water across the gas layer, avoiding both risk of lead freezing and excessive thermal stresses across the tube walls during steady state operation and transients
In Figure 3 is reported a picture of the HX when installed into the ICE test section. From the picture it is possible to see the shell and the lower grid where the bayonet tubes are constrained.
In the following the main parameters characterizing the heat exchanger are listed: - Bayonet assembly: hexagonal lattice
- Number of bayonet tubes: 91 - Pitch of the bayonet tubes: 31 mm - Shell I.D.: 342.3 mm
- Shell Length: 3205 mm
- Inner pipe O.D./thickness: 12.70 / 3.10 mm - Middle pipe O.D./thickness: 19.05 / 2.11 mm - Outer pipe O.D./thickness: 25.40 / 2.11 mm - Bayonet active length: 3462 mm
- Helium gap thickness: 1.06 mm - Helium pressure (20°C): 4.5 bar - Working fluid shell side: LBE
- Secondary fluid (tube side): low-pressure water - LBE inlet temperature: 400°C
- LBE outlet temperature: 300°C
- Water inlet temperature/pressure: 20°C / 3.5 bar - Steam temperature /discharge pressure: 100°C / 1 bar - Water nominal flow rate: 0.6 kg/s
- Steam quality: 45%
2. EXPERIMENTAL CAMPAIGN AND POST-TEST ANALYSIS
The experimental campaign carried out in CIRCE facility was planned for studying the behaviour of an HLM nuclear system primary system (XT-ADS and EFIT as reference) through integral testing. The experimental results demonstrate the availability of a multi-purpose test rig, i.e. CIRCE, which is suitable for supporting the design of HLM reactor components (e.g. pin and bundle configuration, main coolant pump, primary to secondary heat exchanger), for studying the thermal-hydraulics and safety issues of different HLM reactor configurations. The experimental campaign is the starting point for developing an experimental database and for supporting the development of advanced computer codes.
• Test A (characterization test), which is aimed at characterizing the performances of the gas flow injection system for inducing the flow along the loop.
• Test B (characterization test), which is devoted to evaluate the thermal-hydraulic performances of the circulation loop in nominal steady state conditions.
• Test C (transient test) simulates the behaviour of the system during the unprotected loss of heat sink (ULOH).
• Test D (transient test) assesses the dynamic of the system during a loss of flow scenario focussed on the transition between the forced to natural circulation.
Post-test analyses of DEMETRA experiments are carried out with RELAP5 code, modified to take in account the LBE thermal-physical properties, for assessing the capability of the code to simulate integral experiments in pool system.
a. Test A: Isothermal Steady State Enhanced Circulation
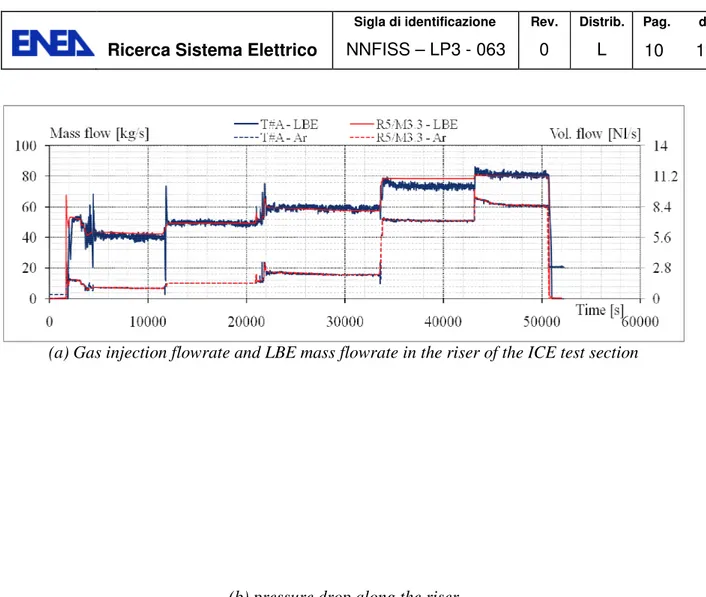
The facility is filled with LBE at 300°C. The electrical heaters of the HS are switched off. The HX is not operated, i.e. no feed water flows through the secondary side of ICE test section. These conditions imply that the temperature of the LBE fluid remains uniform in the circuit and nearly constant during the overall transient. The Test A is a “quasi” steady sate experiment, consisting in a stepwise increase of gas flow injection from about 1 to 9 Nl/s (see Figure 4a). The Argon injected in the riser provides the driving force for LBE flow circulation in primary loop. Five values of gas flow rate are tested in order to characterize the system and to verify its capability in achieving the design operating conditions planned in the ICE experimental campaign. LBE velocities across the HS and the HX has been evaluated during the test. The results of the test demonstrate that the gas flow injection system is capable to accomplish the target value of average velocity, which is equal to 1 m/s in the HS (see also Table 1).
The code simulation is focused on the capability of simulating the circulation of LBE, driven by the Argon injection. The main phenomena involved are the buoyancy force in the riser connected, with the correct prediction of the average void fraction, and the irreversible friction pressure losses along the entire loop. Figure 4a reports the mass flow rate trends of the Argon and of the LBE flowing in the ICE test section. The code results are quantitatively consistent with the experimental measurements. Minor difference (slight overestimation) in the LBE mass flow is observed for the value of Argon volumetric flow equal to 7.2Nl/s. The wall friction and the frictional trends at the discontinuities are managed by the code in a flexible way. Indeed the user can use for the calculation by using formulations dependent by the Reynolds number. The calculation is performed using the standard engineering approximation to the Colebrook-White correlation for the wall friction and the constant form loss coefficients at the geometrical discontinuities. Figure 4b shows the correct prediction of the pressure drop along the riser. It should be noted the values account for both the static head (which includes the presence of the noncondensable gas phase in the pipe) as well as the dynamic pressure losses.
(a) Gas injection flowrate and LBE mass flowrate in the riser of the ICE test section
(b) pressure drop along the riser
Figure 4. Test A experimental versus calculated time trends.
b. Test B: Full Power Steady State Enhanced Circulation
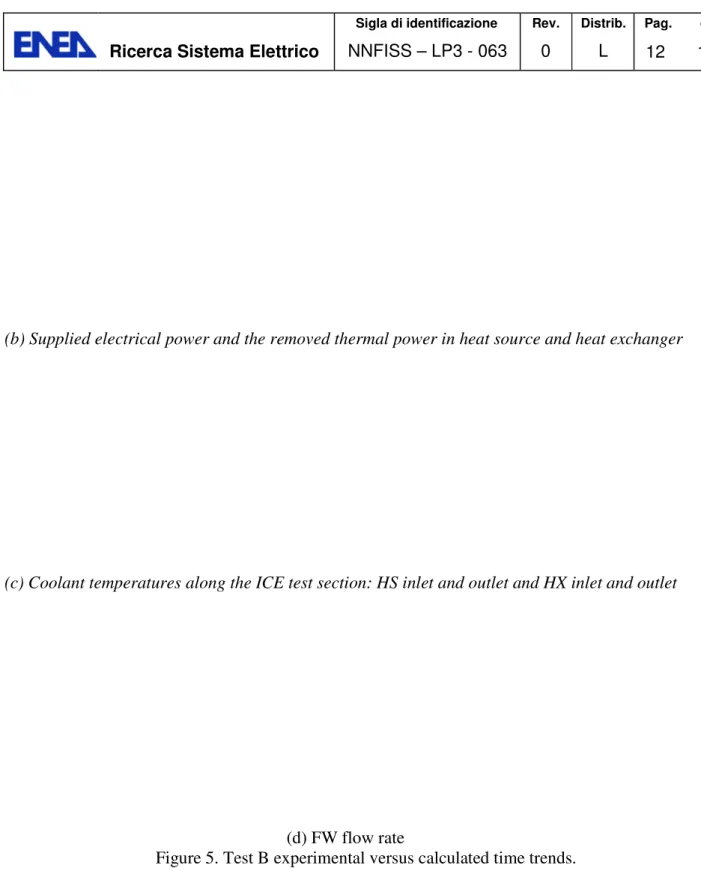
The test B is a steady state full power gas enhanced circulation test. The gas injection (Figure 5a) is set to an average flow rate of 1.7 Nl/s. After that a steady state LBE mass flow rate has been obtained along the primary flow path, the power of the heat source is linearly increased up to 800 kW in 300 s (Figure 5b). When the full power is reached, the heat exchanger is activated supplying the cooling water into the manifold (Figure 5d).
The code simulation is setup imposing the Argon flow rate, the FW mass flow rate (about 0.57 kg/s) and the core power (800 kW), besides the initial conditions. The heat losses across the vessel (about 50kW) are properly accounted for. The main phenomena involved in the test are the buoyancy force in the riser, connected with the correct prediction of the average void fraction, the irreversible friction pressure drops along the entire loop, the heat transfer in the heat source and in the heat exchanger, the thermal stratification and the mixing within the pool.
Figure 5a reports the comparisons between the experimental data and calculated results of the argon flow rate injected into the riser, and of the promoted primary flow rate through the heat source. After about 100s from the onset of the gas injection, a liquid metal steady state flow rate of 60 kg/s is
achieved (which corresponds to about 1 m/s, as foreseen for the XT-ADS and EFIT concepts). The code predicts with excellent accuracy the stationary flow, confirming the results observed in the Test A. In this test, the thermal buoyancy contributes also to the LBE mass flow rate.
The electrical power supplied to the heat source, the thermal power extracted by the LBE in the heat source and in the heat exchanger are reported in Figure 5b. The code predicts a perfect balance of power between the heat source and the sink during the stationary phase. On the contrary, the indirect evaluations of the experimental data (based on the measured data available) highlight a mismatch, which becomes evident between 5000s and 8000s. The coolant temperature trends along the ICE test section (Figure 5c) show excellent results at the heated section inlet and outlet. A minor discrepancy is observed at the heated section inlet, as soon as the FW water mass flow rate is turned on (Figure 5c). This might be connected with an overestimation of the mixing occurring in the CIRCE pool, induced by the simplified 1D modeling of RELAP5 code. Nevertheless, the coolant temperature at the heat exchanger outlet results higher in the code simulation than in the experimental data. Three are the possible causes of such difference, considering that the coolant temperature of the code simulation at the heat exchanger inlet is superimposed on the experimental data: 1) the heat exchange across the tube wall (i.e. the heat transfer coefficient) is underestimated by the code, 2) the thermal coupling between the heat exchanger and the upper part of the pool is underestimated by the code, and 3)the rate of the LBE flowing in the heat exchanger in the experiment does not correspond with that in the heated section (i.e. there is a bypass in the test section). On the basis of the results in Figure 5b, Figure 5c, and Figure 5d the options 3 and (partially) 2 above appear more probable. As can be noted in Figure 5c, the coolant temperature drops along the riser: the coolant temperature at heat exchanger inlet is 30°C lower than at heat source outlet. This is due to the thermal coupling between the fitting volume, riser and the downcomer. The LBE flowing into the fitting volume and, then, in the riser losses thermal power towards the upper part of the downcomer where the HX is placed. Different coolant temperatures are also evident between the heat exchanger outlet and the heated source inlet. This is due to the thermal mixing and diffusion of the coolant occurring in the pool.
(b) Supplied electrical power and the removed thermal power in heat source and heat exchanger
(c) Coolant temperatures along the ICE test section: HS inlet and outlet and HX inlet and outlet
(d) FW flow rate
Figure 5. Test B experimental versus calculated time trends.
c. Test C: Unprotected Loss of Cold Sink
Test C is a transient investigating the system behavior following a postulated unprotected loss of heat sink. Three main phases are identified: 1) from 0 s up to 11420 s: conditioning (and stationary) phase;
2) from 11420 s up to 13560 s: postulated accident phase; 3) from 13560 s up to 34650 s: mitigation phase.
The test starts with the system in hot conditions at zero power. The primary coolant is stagnant and the temperature is uniform in the circuit. The gas flow injection system is switched on at 575 s, with an average flow rate of 1.7 Nl/s (Figure 6a). The resulting buoyancy force induces a flow circulation in the ICE loop corresponding roughly to 60 kg/s. The code simulation is setup as for Test B. The main phenomena involved in the test are the same of Test B, in different operating conditions.
The electrical power is supplied to the fuel bundle, thus the heated section provides the coolant with about 800 kW (Figure 6b). At 960 s the FW valves upstream the HX are opened, in order to establish the energy balance in the system (Figure 6d). The steady state conditions are consistent with those resulting from the Test B. The initiating event occurs at 11420 s, when the valve of the secondary side feed water are closed, thus resulting in decrease of heat removal from secondary side transient. The effect of the loss of heat sink on the primary flow rate is negligible (roughly -2 kg/s) because the larger contribute is due to the gas lift system (i.e. void buoyancy) with respect to the density difference (i.e. thermal buoyancy).
(a) Gas injection flowrate and LBE mass flowrate in the riser of the ICE test section
(c) Coolant temperatures along the ICE test section: HS inlet and outlet and HX inlet and outlet
(d) FW flow rate
Figure 6. Test C experimental versus calculated time trends.
The LBE temperature of the system rises with a rate of about 0.06 °C/s, because of the unbalance of energy (Figure 6c). At 13570 s the coolant temperature at HS outlet is equal to 495°C (see Figure 6c) and the electrical power is switched off. In these conditions, the coolant temperature is rapidly equalized in the primary system at about 420 °C. As soon as the equilibrium is reached, the temperature is uniform in the circuit with a flow driven by the gas injection system.
RELAP5 confirms the excellent accuracy in predicting the flow rate driven by the gas injection in the bottom riser of the ICE test section. A minor difference is observed between 20000 s and 25000 s (Figure 6a). The experimental mass flow rate experiences a linear decrease of about 4 kg/s in 3000s before the gas enhanced circulation is stopped. No explanation is found in the experimental data for the flow reduction.
As in Test B, the code predicts a perfect balance of power between the heat source and the sink during the stationary phase. The indirect evaluation of the power removed by the heater exchanger secondary side seems overestimated, because the coolant temperature trends are stable before the occurrence of the loss of FW (i.e. from 2000 s to 11420 s). The coolant temperature trends along the ICE test section (Figure 6c) are well predicted by the code during the overall transient. Following the initiating event, the coolant temperatures rise with the same trend in the code results and in the experiment. Minor deviations are observed during the transient and compensated, as soon as the core power is switched
off, demonstrating that the overall energy stored in the pool is correct. Then, the coolant temperatures decreases as consequence of the heat losses, which seems slightly overestimated according with Figure 6c.
d. Test D: Unprotected Loss of Flow
Test D is an experiment investigating the system behavior following loss of flow scenario. Three main phases are identified: 1) from 0 s up to 10735 s: conditioning (and stationary) phase; 2) from 10735 s up to 15025 s: occurrence of initiating event and simulation of the postulated transient; and 3) from 15025 s up to 24660 s: mitigation phase.
The phenomena involved in the transient are those already reported in Test B and Test C.
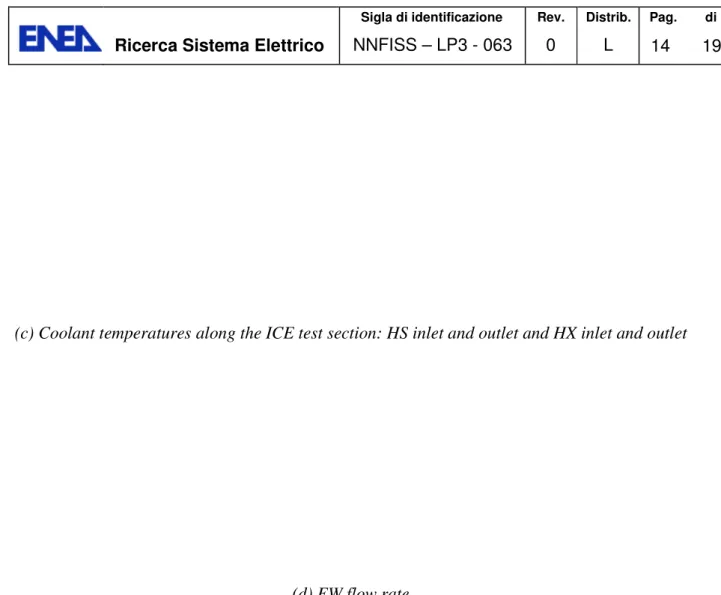
The test started with the system in hot conditions at zero power. The primary coolant is stagnant and the temperature is uniform in the circuit, at about 295 °C (Figure 7c). The gas flow injection system is switched on at time 0 s. The compressor reaches the stationary conditions after about 4650 s, injecting an average flow rate of 3.0 Nl/s. The resulting buoyancy force induces a flow circulation in the ICE loop corresponding roughly to 68 kg/s (Figure 7a). The electrical power is turned on at about 900 s and it is set at the nominal value (750 kW) with a two steps procedure, which is completed after 3200 s (Figure 7b). About 300 s later, the FW system is activated, by means of the valves upstream the HX and the energy balance is re-established in the system. The gas lift system is then stabilized and the facility is operated in stationary conditions until 10735 s when the initiating event occurs (Figure 7a). The code results highlight an overestimation of the mass flow rate at the beginning of the transient (10735 s), which might be connected with rough calculations of the pressure drop at the geometrical discontinuities using the model based on a constant Re independent energy loss coefficient (see also Figure 4b), and with the bypass of coolant occurring in the top of the ICE test section, as discussed in above (i.e. Test B). The mass flow rate observed in the experiment rises from 53kg/s up to the stationary flow in about 5000s. This is qualitatively predicted by the code, but the initial mass flow rate is 63kg/s. Until the gas enhanced circulation is stopped, the prediction of the stationary flow is excellent. Then, during the natural circulation driven by the thermal buoyancies, the code overestimate the mass flow rate of about 5 kg/s (corresponding to a relative error of 20%). This implies temperature differences across the core and the heat exchanger lower in the code results than in the experiment (Figure 7d).
During the conditioning phase, the coolant temperatures along the ICE test section are quantitatively predicted by the code, with the exception of the heat exchanger outlet temperature as already observed in the simulations of the Tests B and C. Larger differences are observed during the transient phase: the coolant temperatures are predicted only from a qualitative point of view. Indeed, as soon as the gas lift system is off, the LBE temperature at core outlet drastically increases (about 200°C in the experiment and 130°C in the code simulation) and, a density driven flow is re-established in few tens of seconds. The coolant temperature rises in the experiment with a rate of 28 °C/h, which is almost double with respect to the code prediction (i.e. 13 °C/h). The overestimation of the coolant flow rate contributes on these differences.
An energy unbalance is observed in the system because the power removed by the HX is almost 200kW lower than the power released by the HS (see (Figure 7b). This difference is more evident in the experiment than in the code calculation. This is caused by the heat released in the riser of the test
section towards the downcomer. Indeed, the LBE temperature at HX inlet is 100 °C lower than it is at the HS outlet. Notwithstanding this distortion, the test D successfully demonstrates the capability of the system to be operated in natural circulation in case of unprotected loss of flow.
When the LBE temperature at core outlet reached 530 °C (485 °C in the code calculation), the power is switched off (15025 s). The coolant temperature tends to be equalized, nevertheless it results higher at HX inlet. In these conditions the energy is transmitted from the downcomer to the riser of the test section. Thus, in the downcomer exists a “quasi” stagnant zone which does not mix with the other coolant and therefore, it is at higher temperature (thermal stratification). This processes are not observed in the code results (indeed the phenomenon is outside the code capabilities) and further investigations are needed to better understand the pool behavior in the experiment. At 15295 s, the FW is closed and about 10000 s alter, the facility is switched off.
(a) Gas injection flowrate and LBE mass flowrate in the riser of the ICE test section
(c) Coolant temperatures along the ICE test section: HS inlet and outlet and HX inlet and outlet
(d) Coolant temperature difference across the HS and the HX Figure 7. Test D experimental versus calculated time trends.
3. Conclusion and Next Steps
The CIRCE–ICE experiment has been designed and carried out to reproduce the thermal hydraulic behaviour of primary system pool-type nuclear reactor, cooled by HLM, in a relevant scale (1 MW). The full power experimental tests have been executed, allowing to obtain the first results in term of LBE flow rate, thermal coupling of the heating section and heat exchanger, qualification of the chemistry control system and performance and reliability characterization of prototypical components. The experimental results carried out have shown as the primary system of such nuclear system is technological feasible, even if more efforts have to be spent to improve the investigations concerning the HLM-pool thermal hydraulic. In particular seems to be mandatory provide a test section up-grade, aiming to characterize the pool thermal stratification phenomena, the thermal coupling of structures and volumes into the pool, to provide direct measurement of heat transfer coefficient in rod bundle both under forced and free convection.
The simulation of transient tests (i.e. unprotected loss of flow, unprotected loss of heat sink) constitute a technological advancement, because they provide an experimental investigation of the the thermal hydraulic behaviour of a HLM pool system.
The numerical simulations confirmed that RELAP5 code capabilities and limitations in predicting phenomena occurring in HLM pool system thermal-hydraulics. The code accuracy of the main parameter trends is in general satisfactory. The correlation implemented for calculating the heat transfer in a bundle of a HLM system showed excellent performances. Analogously, the code results are reasonable accurate in simulating the pressure losses for the tests under investigations.
The code is intrinsically limited in providing an accurate simulation of the thermal stratification and mixing in the pool (which were outside the scope of the present activity). Anyway, an improvement of the knowledge of the behaviour of the pool in different operating conditions and sensitivity studies on nodalization might provide indications to address this issues.
On the basis of the expertise acquired during the experimental campaign, the analysis of the data and the post-test analyses by RELAP5 code, the following improvements of the test section are considered valuable for the forthcomings experimental activities.
Install a more suitable instrumentations on the HX, in particular it has been highlighted as a better evaluation of the inlet and outlet average temperature through to HX (LBE side) is necessary to better evaluate the power extracted by the component. Simultaneously, to better address the performance of the HX, it is mandatory to monitor the LBE temperature in some subchannels of the HX, through the bayonet tubes.
Increase the height of the wall of the separator, to guarantee that the LBE flow rate really flow into the HX’s shell during the tests. In fact, due to the strongly gas bubbling into the separator, there is the possibility that part of the LBE flow rate flow directly into the downcomer, compromising the evaluation of the power removed by the main HX.
Improve the thermal-hydraulic coupling of the main HX with the downcomer adding a suitable flow straightener in the lower part of the shell.
Achieve the thermal insulation of the riser, in order to reduce the thermal exchange towards the quasi stagnant LBE into the downcomer.
Install a new decay heat removal heat exchanger into the pool, aiming to simulate the transition from the forced to natural circulation into the pool.
Install suitable instrumentations for the mixing and thermal stratification assessment into the pool. Instrument the fuel pin bundle aiming to evaluate the heat transfer coefficient in HLM cooled rod bundle, evaluate the hot spot factor due to the installed spacer grid along the bundle, monitoring the pin cladding temperature under the postulated transients.
4. References
[1] EC Integrated Project EUROTRANS, 2005, Contract number FI6W-CT-2004-516520
[2] M. Tarantino, P. Agostini, G. Benamati, G. Coccoluto, P. Gaggini, V. Labanti, G.Venturi, A. Class, K. Liftin, N. Forgione, V. Moreau “Integral Circulation Experiment: Thermal-Hydraulic Simulator of a Heavy Liquid Metal Reactor” Journal of Nuclear Material, vol. 415,Issue 3, pp. 433-448, 2011
[3] M. Tarantino, G. Benamati, P. Gaggini, V. Labanti “Integral Circulation Experiment: Thermal-Hydraulic Simulator of the ETD Primary System” OECD Nuclear Energy Agency International Workshop on Technology and Components of Accelerator Driven System, Germany, Karlsruhe, 15-17 March 2010.
[4] Turroni P., Cinotti L. ,Corsini G., Mansani L, “The CIRCE Facility”, AccApp’01&ADTTA’01, Nuclear Application in the new Millennium, Reno (Nevada- USA), November 11-15, 2001
[5] Benamati G., Foletti C., Forgione N., Oriolo F., Scaddozzo G., Tarantino M., “Experimental study on gas-injection enhanced circulation performed with the CIRCE facility”, Nuclear Engineering and Design, vol. 237, pp. 768-777, Iss. 7, 2007.
[6] Barbensi A., Corsini G., “ Specification for the EFIT primary system”, Deliverable D. 1.4, DM1 DESIGN, IP-EUROTRANS, 2006.
[7] Giraud B., “Review and justification of the main design options of XT-ADS”, Deliverable D. 1.5, DM1 DESIGN, IP-EUROTRANS, 2006.
[8] Artioli C,“ Specification for the EFIT Core and Fuel Element Design”, Deliverable D. 1.6, DM1 DESIGN, IP-EUROTRANS, 2006.
[9] Van den Eynde G.,“ Specification for the XT-ADS Core and Fuel Element Design”, Deliverable D. 1.7, DM1 DESIGN, IP-EUROTRANS, 2007.
[10] Mansani L.,“ Candidates Materials for XT-ADS and EFIT, Operating Conditions and Testing Requirements”, Deliverable D. 4.1, DM4 DEMETRA, IP-EUROTRANS, 2005.
[11] Tarantino M., Report ENEA HS-F-R-001 “Gas Enhanced Circulation Experiments On Heavy Liquid Metal System”, 2007.
[12] Group of Experts of the NEA Committee on the Safety of Nuclear Installations, Validation Matrix for the Assessment of Thermal-Hydraulic Codes for VVER LOCA and Transients, NEA/CSNI/R(2001)4, June 2001.