1
UNIVERSITÀ DEGLI STUDI DI SALERNO
Dipartimento di Farmacia
Dottorato di Ricerca
in Scienze del Farmaco
Ciclo XXIX — Anno accademico 2016/2017
Tesi di Dottorato in
Techniques of proteomic analysis as tools for
studies in biomedical field
Dottorando Tutore
Dott. Andrea Esposito Chiar.mo Prof. Tina De Tommasi
Co-tutore
Chiar.mo Prof. Fabrizio Dal Piaz
3 Index Abbreviations 5 Abstract 9 Chapter I 1 Introduction 13
1.1 Metal contamination and fetal malformations 13
1.2 “Omics” technologies and environmental proteomics (ecotoxicoproteomics) 16
1.3 Biomarkers for metal toxicity 19
1.4 Matrix metalloproteinases 21
1.5 Aim of the project 24
Chapter II
2 Materials and Methods 29
2.1 Umbilical cords from healthy and malformed fetuses 29
2.2 Protein extraction and quantitative analysis 29
2.3 One-dimensional gel electrophoresis and in gel digestion 30
2.3.1 Mass spectrometry-based protein identification 30
2.4 Two-dimensional gel electrophoresis (2-DE) 31
2.5 Filter-Aided Sample Preparation (FASP) 32
2.5.1 Mass spectrometry-based protein identification 33
2.5.2 Gene Ontology 34
2.6 Gelatin zymography 35
2.7 Western blotting analysis 36
2.8 Statistical analysis 36
Chapter III
4
3.1 Umbilical cords from healthy fetuses 41
3.2 Protein extraction and quantitative analysis 41
3.3 One-dimensional SDS-PAGE and in-gel digestion 42
3.3.1 Mass spectrometry-based protein identification 44
3.3.2 Assessment of technical variability 46
3.4 Two-dimensional gel electrophoresis (2-DE) and image analysis 48
3.4.1 Limitations of 2-DE 50
3.5 Umbilical cords from malformed fetuses 51
3.6 Protein extraction and quantitative analysis 53
3.7 Filter-Aided Sample Preparation (FASP) 53
3.7.1 Mass spectrometry-based protein identification 55
3.7.2 Statistical analysis 56
3.7.3 Gene Ontology (GO) 60
3.8 Gelatin zymography 71
3.9 Western blotting analysis 76
3.10 Metal analyses in mother’s hair and umbilical cords 76
4 Conclusions 78
References 83
Appendix A 99
5
Abbreviations
2-DE Two-dimensional electrophoresis
Al Aluminium
As Arsenic
Ba Barium
Be Beryllium
BSA Bovine serum albumin
Cd Cadmium Ce Cerium CHAPS 3-[(3-cholamidopropyl)dimethylammonio]-1-propanesulfonate Co Cobalt Cr Chromium Cu Copper
DDSH Dyssegmental dysplasia, Silverman-Handmaker type
DRC-ICP-MS Dynamic reaction cell inductively coupled plasma mass
spectrometry
DTT Dithiotreitol
ECM Extracellular matrix
emPAI exponentially modified Protein Abundance Index
ESI Electrospray
FASP Filter-aided sample preparation
6
Fe Iron
GO Gene Ontology
Hg Mercury
HSPG2 Heparan sulfate proteoglycan 2
IAA Iodoacetamide
IAEA International Atomic Energy Agency
IBD Inflammatory bowel disease
IEF Isoelectric focusing
IPG Immobilized pH gradient
IRSA Idiopathic recurrent spontaneous abortion
K Potassium
LFQ Label-free quantification
Li Lithium
LOD Limit of detection
Mg Magnesium
MGF Mascot generic format
MMPs Matrix metalloproteinases
Mn Manganese
MS/MS Tandem mass spectrometry
Ni Nickel
PANTHER Protein Analysis THrough Evolutionary Relationships
7
PBS Phosphate-buffered saline
pI Isoelectric point
Rb Rubidium
RP-HPLC Reverse-phase high-performance liquid chromatography
Sb Antimony
SDS Sodium dodecyl sulfate
SDS-PAGE Sodium dodecyl sulfate - polyacrylamide gel electrophoresis
Se Selenium
Sn Tin
Sr Strontium
Ti Titanium
TIMPs Tissue inhibitors of metalloproteinases
Tl Thallium TRIS21 Trisomy 21 U Uranium V Vanadium W Tungsten Zn Zinc
9
Abstract
It is known that prenatal exposure to pollutants and particularly heavy metals can have long term damaging consequences on infants, due to their accumulation in-body. Since the 1990s, ten million tonnes of waste have been illegally dumped in the area around Caserta and Naples. Thus, direct exposure to waste and heavy
metals during the last two decades was very frequent in the so-called “Lands of fires”. The number of children suffering from cancer and of malformed fetuses in Italy's "Land of Fires", an area where toxic waste has been dumped by the mafia, is reported significantly higher than elsewhere in the country. In this thesis we examined the proteome of the umbilical cords from malformed fetuses obtained by therapeutic abortions, after mothers' being exposed to the pollution on “land of fire” during early pregnancy, and analyzed the differences between umbilical cords from malformed fetuses to healthy ones. The main goals were to understand the impact of the contamination by heavy metals on the fetus development, and to identify new putative biomarkers of exposure to metal contaminants.
All umbilical cords were obtained in Campania region (Naples and Caserta, mainly in the “land of fires”). The collection of the biological samples was carried out in collaboration with the Caserta Hospital “Sant’Anna e San Sebastiano” and with the Avellino Hospital “San Giuseppe Moscati”. A proteomic approach based on Filter-Aided Sample Preparation (FASP) method was set up and performed. This bio-analytical strategy combines the advantages of in-gel and in-solution digestion for mass spectrometry–based proteomics, greatly reduces the time required for sample preparation and enables more flexibility in sample processing. Protein identification and quantification were performed by matching mass spectrometry data in on-line protein database, using the MaxQuant 1.5.2.8 software. Statistical analyses were employed to identify proteins whose levels were sensibly different in the umbilical cords from malformed fetuses. Gene Ontology (GO) classification was used in order to obtain functional information of the differentially expressed proteins and to correlate them to the embryonic development. Finally, Matrix Metalloproteinases (MMPs) have been shown to play significant roles in a number of physiological processes, including embryogenesis and angiogenesis, but they also contribute to the development of pathological processes. Thus, gelatin zymography technique
10
was performed to detect MMPs enzymatic activity in the umbilical cords. Our results support a significant role of MMPs in the fetus development.
11
13
1 Introduction
1.1 Metal contamination and fetal malformations
Despite the last decades of the XX century have been characterized from the accelerated technological innovation and the improvement of industrial implants, production activities continue to have a profound effect on the quality of the several environmental matrices (air, water and land). The risk for the population increases in function of proximity to contaminated sites and the risks associated with the contamination by heavy metals are particularly significant (Baibergenova et al., 2003; Zheng et al., 2012). The metal contamination has the capacity to affect the reproductive health, as observed both in industrial contests and in war zones where weapons containing toxic/carcinogenic and teratogenic metals have been used (Suarez et al., 2007; Araneta et al., 2003). The feature of metals, in fact, is to be "long-term teratogenic," since they remain in soil or water, accumulate over time in tissues of living organisms and the bio-accumulation increases their dangerousness, also due to possible synergism of contamination by more metals. The metal contamination has the potential to produce malformations and many of the metals which are not micro-nutrients, and some micro-nutrients at high concentrations, have shown teratogenic, mutagenic, and carcinogenic capacities (Apostoli and Catalani, 2011). Most of the so-called congenital malformations determine great alterations of the body structures and of the organs functionality, sometimes incompatible with the life but very often that allow a life with many limitations and determine a serious weight on the affected individuals and on their families. Not much is known about these malformations (which all together are in Italy between 1% and 4% of newborns), neither about the reasons nor about the modalities whereby they occur in the organism. For many malformations a single gene that determines them isn’t known, in a few cases more genes involved in the malformation have identified, in most cases it is believed that are complex events susceptible to the influence of the external environment on the mother and/or directly on the fetus (Mattison, 2010).
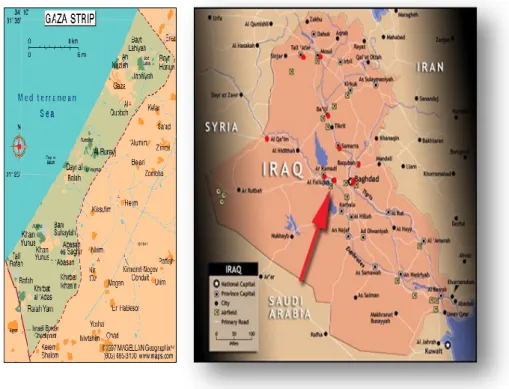
Epidemiological studies associated with chemical and biochemical analyses, conducted in war zones and in particular in the Gaza Strip (Figure 1.1), have shown
14
the existence of a correlation between heavy metal contamination and increased reproductive damage, in particular an increase of fetal malformations (Naim et al., 2012). In the Gaza situation, various pieces of information useful to investigate this link were published. In recent times “metal augmented” ammunitions were developed and used in the wars and attacks in this century. Indeed, modern weapons contain within them not small amounts of powders of metals, such as Cd, Pb, Al, U, Hg, Co, V, W (Skaik et al., 2010). Most metals persist in time in the environment and many of them accumulate in the bodies, suggesting that dispersion of metal powders in the environment may have both immediate and long term effects on reproductive health and cancers (Vidosavljević et al., 2013; Jergovic et al., 2010). By proving the fact of the presence in tissues at the site of different types of wounds of a specific metal signature different for each kind of physical damage caused by weaponry it was shown that teratogens and fetotoxicant metal contaminants (Pb, U, Al, Ti, Cu, Sr, Ba, Co, Hg, V, Cs and Sn) were delivered by weapons in the attacks in the summer of 2006 and during Operation Cast Lead in the winter of 2009 (Skaik et al., 2010). Teratogens were also detected in examined large bomb craters from 2006 and 2009 bombings (Manduca et al., 2014). Reconstructing the reproductive history of women delivering healthy children in 2011 at Al Shifa Hospital in Gaza, it was reported that the prevalence of birth defects has increased in Gaza since 2005, following introduction of air-delivered weaponry (Naim et al., 2013). A recent study (Naim et al., 2012) reported highly significant correlations between exposure of parental couples to metal delivering weaponry during Operation Cast Lead, the major recent military attack up to then, and the delivery of a baby with major structural birth defects. The progeny with birth defects was conceived 22–26 months after exposures. This information is consistent with weaponry being a source of contamination by teratogenic and toxicant metals for the population, and suggest association between reproductive damage, and exposure to attacks (Manduca et al., 2014). Studies carried out by an international team in another post-war context (Fallujah area, Iraq; Figure 1.1) have shown, at a distance of 5 and 6 years respectively from war events of 2004-2005, persisting hair contamination by metals in adult and children hair, and an increase of cases of birth defects documented with a high frequency in 2011 (Alaani et al., 2011; Al-Sabbak et al., 2012).
15
Figure 1.1. Gaza Strip and Fallujah area, Iraq. Concerns from professionals have pointed to
increases in birth defects and cancers in these areas during the years following wars.
In the Campania region, where since the 80s several toxic wastes have been "deposited" legally and illegally, observations have been reported that suggest the accumulation of these materials has produced an increase of some kinds of diseases, such as allergies, cancers, adverse effects on reproductive health (infertility, malformations, low birth weight, stillbirths) (Martuzzi et al., 2009). Several studies have reported an accumulation of heavy metals in vegetables and in fishes sampled in areas of Caserta, Aversa and Phlegraean Fields, which exceeded the regulatory limits. Moreover, studies performed on soil samples collected in areas with high potential of pollution have shown the presence of concentrations higher than normal levels of these metals (Cu, V, Cr, Cd, Pb) (Imperato et al., 2003). Therefore the alimentary way, as well as the respiratory one, are considered to cause exposure and accumulation of metals in the exposed population. In addition, other teratogenic contaminants such as dioxins have been found in the milk of mothers in this area (Giovannini et al., 2014). The metals and dioxins have the potential to affect the health of the population not only in the exposed generation, but also in their offspring. Therefore in-depth studies are needed to understand what factors
16
and what biochemical and physiological mechanisms are the basis of outbreaks of fetal malformations and possibly to limit their incidence.
1.2 “Omics” technologies and environmental proteomics (ecotoxicoproteomics)
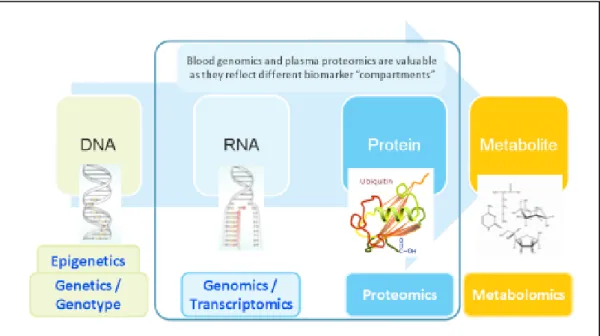
Ecotoxicology is the study of the interactions between living organisms, their ecosystems and stressors (Dowling and Sheehan, 2006). The grand goal of ecotoxicology in the post-genome era is to characterize the entire set of genes and proteins that are affected when humans are exposed to environmental xenobiotics (Mussali-Galante et al., 2013). Therefore, a new trend in ecotoxicology and biomedical research is the application of so-called “omics” technologies. ‘Omics’ technologies adopt a holistic view of the molecules that make up a cell, tissue or organism. They are aimed primarily at the universal detection of genes (genomics), mRNA (transcriptomics), proteins (proteomics) and metabolites (metabolomics) in a specific biological sample in a non-targeted and non-biased manner. This can also be referred to as high-dimensional biology; the integration of these techniques is called systems biology (Kell, 2007) (Figure 1.2).
Figure 1.2. The “Omics” approach. “Omics” technologies can be used to gain a “system-wide”
17
Genomics is the systematic study of an organism’s genome. The genome is the total DNA of a cell or organism. The human genome contains 3.2 billion bases and an estimated 30 000–40 000 protein-coding genes (Baltimore, 2001). Traditionally, genes have been analyzed individually but microarray technology has advanced substantially in recent years. DNA microarrays measure differences in DNA sequence between individuals and the expression of thousands of genes can be analyzed simultaneously (Horgan and Kenny, 2011).
The transcriptome is the total mRNA in a cell or organism and the template for protein synthesis in a process called translation. The transcriptome reflects the genes that are actively expressed at any given moment (Horgan and Kenny, 2011). The proteome is defined as the set of all expressed proteins in a cell, tissue or organism (Theodorescu and Mischak, 2007). Contrary to genome, the proteome is highly dynamic and changes continuously as a response to numerous intra and extracellular signaling (Barrett et al., 2005). The proteome is a dynamic reflection of both genes and the environment and is thought to hold special promise for biomarker discovery because proteins are most likely to be ubiquitously affected in disease and disease response (Rifai et al., 2006). Proteomics can be more broadly defined as “the effort to establish the identities, quantities, structures, and biochemical and cellular functions of all proteins in an organism, organ, or organelle, and how these properties vary in space, time, and physiological state” (Kenyon et al., 2002). Proteomics is closer to physiology than genomics because post-translational regulation of proteins can reduce the correlation between mRNA abundance and protein activity (Lemos et al., 2010). Proteomics aims to characterize information flow within the cell and the organism, through protein pathways and networks (Petricoin et al., 2002), with the aim of understanding the functional relevance of proteins (Vlahou and Fountoulakis, 2005). It is complicated by its domain size (>100 000 proteins) and the inability to detect accurately low-abundance proteins.
Metabolomics can generally be defined as the study of global metabolite profiles in a system (cell, tissue or organism) under a given set of conditions (Goodacre et al., 2004). The metabolome is the final downstream product of gene transcription and, therefore, changes in the metabolome are amplified relative to changes in the transcriptome and the proteome (Urbanczyk-Wochniak et al., 2003).
18
Snape et al. (2004) proposed the term “ecotoxicogenomics” to describe the integration of genomics (transcriptomics, proteomics, and metabolomics) into ecotoxicology, and defined it as “the study of gene and protein expression in non-target organisms that is important in responses to environmental toxicant exposures.”
Specifically for metal exposure assessment, very recently, “metallomics” has emerged as a new sub-discipline of toxicogenomics, which investigates the interrelationships of metal-induced proteome and metabolome changes. In this regard, searches for genes encoding metal-responsive proteins could be interesting targets for reporter genes fusions in biomarker establishing (Haferburg and Kothe, 2010).
Among “omics” technologies, environmental proteomics or ecotoxicoproteomics has become a powerful tool for generating hypotheses regarding how the environment affects the biology of non-target organisms. With its rapidly expanding analytical tools, it provides a means to study the changes occurring at the level of the proteome in response to both the external environment and ontogenetic events in animals, plants, and bacteria.
The approach has obvious applications to ecotoxicology since it has the potential both to identify previously unknown protein biomarkers and to gain insights into toxicity mechanisms. Since the proteome is a dynamic quantity, it holds out the promise of detecting subtle changes in sentinel species as they adapt to altered surroundings.
In the toxicological sciences, the possibility to assess the proteome is a gigantic step since the proteomic profiles embody the link between effects at both the molecular level and the whole organism level, given that proteins are the first functional stage directly or indirectly affected by toxicants (Kovacevic et al., 2009). Therefore, more and more researchers are directing their efforts towards proteomic studies and have demonstrated the utility of proteomics in the ecotoxicological field. Recent studies have demonstrated that ecotoxicoproteomics allows the identification of the molecular events involved in toxicant responses and to generate hypotheses on the mode of action of stressorswith a high potential for identifying novel biomarkers (Dowling and Sheehan, 2006; López-Barea and Gómez-Ariza, 2006; Monsinjon and Knigge, 2007).
19
1.3 Biomarkers for metal toxicity
Proteomics is one of the most powerful tools for the identification of molecules (biological markers or biomarkers) that place in evidence the exposure of organisms to a stressor. A biomarker is a measurable indicator of a specific cellular, biochemical or molecular parameter that show whether a key organism has been exposed to a stressor (van Ommen et al., 2009). The use of biomarkers has been proposed as a sensitive early warning tool for biological effect measurement in environmental quality assessment (Cajarville et al., 2000).
In the last 5 years, an increasing interest towards biomarkers of heavy metals have been recorded. The interest in biomarkers for heavy metals impact was defined parallels to the development of biomonitoring program, according to the test subject either had been exposed in the past or currently exposed to environmental stimuli (Sabullah et al., 2015).
A variety of molecules, such as hormones (Zaccaroni et al., 2009), enzymes such as
cytochromes P450 (CYP), cholinesterase, catalase (CAT), glutathione S-transferase (GST) (Menezes et al., 2006; Howcroft et al., 2009) and other proteins such as vitellogenin, Hsp, etc. and even organelles (Ortiz-Zarragoita and Cajaraville, 2006) have been selected as biomarkers of specific chemicals or classes of chemicals (Porte et al., 2006). Metabolic enzymes such as aspartate aminotransferase (ASAT), alanine aminotransferase (ALAT), superoxide dismutase (SOD), and GST had significantly increase in the activity induced by the presence of toxicant especially heavy metals (Singh et al., 2012; Saliu and Bawa-Allah, 2012; Han et al., 2013). Biomarkers of oxidative stress based on antioxidant enzymes such as SOD, GST, CAT, and glutathione peroxidase (GPX) have been utilized to determine the toxicity level of metal ions in aquatic organisms and have been proved to be sensitive (Radi and Matkovics, 1988; Lopes et al., 2001; Farombi et al., 2007). Much of the work in the area of biomarkers has focused on metallothioneins or metallothionein-like proteins (MT). These low-molecular weight, cysteine-rich metal-binding proteins are reported to play a key role in the binding and transport of various metals (Costa et al., 2008, 2009). MT are modulated by heavy metals, being an informative and specific biomarker of chronic heavy metal exposure (Mussali-Galante et al., 2013).
20
A general mechanism of carcinogenicity of arsenic (As), cadmium (Cd), cobalt (Co), and nickel (Ni) seems to be the inhibition of DNA repair enzymes, which include the mammalian XPA protein, the bacterial Fpg protein and the poly (ADP-ribose) polymerase. Specifically, the Fpg protein is inhibited by Cd, copper (Cu), and mercury (Hg) and Ni and Co inhibit DNA binding of XPA (Asmuss et al., 2000). Also, poly (ADP-ribose) polymerase is inhibited by arsenite in mammalian cells (Hartwig et al., 2002; Schoen et al., 2004). These proteins have been used as biomarkers to analyze response to toxic metals. Trace metals are reported to regulate the expression of CYP as well as heavy metals like Hg and lead (Pb) (Ki et al., 2009). Apolipoprotein E (Apo E) genotyping has been investigated as an indicator of susceptibility to Hg neurotoxicity (Godfrey et al., 2003). Gundacker et al. (2007) analyzed the relationship between polymorphisms in GST genes in individuals exposed to Hg. Pb inhibits several enzymes in heme formation pathway, including delta-aminolevulinic acid dehydratase (ALAD), coproporphyrinogen oxidase and ferrochelates. Because Pb effectively inhibits ALAD activity, resulting in accumulation of ALA in blood and urine, urinary ALA has also been used as a biomarker for Pb exposure or a marker of early biologic effect of Pb (Sithisarankul et al., 1998). The activities of pyrimidine nucleotidase and nicotinamide adenine dinucleotide synthetase in blood are decreased in Pb exposure. These can also be useful biomarkers of effect in humans (Sakai, 2000). It is suggested that Vitamin D receptor (VDR) may be playing a role in susceptibility to Pb accumulation (Onalaja and Claudio, 2000). Neurobehavioral changes due to Pb exposure have been associated with Apo E genotype (Stewart et al., 2002; Godfrey et al., 2003).
MT binds Cd strongly and is considered a good biomarker of Cd exposure (Kakkar and Jaffery, 2005). Effect biomarkers of Cd-induced renal dysfunction are β2
-microglobulin, retinol binding protein and albumin (Jin et al., 2002). α1
-Microglobulin is shown to be a promising marker of Cd-induced tubular dysfunction, possibly better than β2-microglobulin (Moriguchi et al., 2004).
Elevation in enzymes primarily of renal tubular origin, such as N-acetyl-β-D-glucosaminidase (NAG) and alanine aminopeptidase (AAP), has been associated with occupational Cd exposure (Lauwerys et al., 1994). Cd combined with As may have additive effect on renal dysfunction in workers exposed to both metals. Positive correlations and significant dose–effect have been reported by Hong et al.
21
(2003) among the concentrations of urinary Cd, As and levels of β2-microglobulin,
albumin, N-acetyl-β-D-glucosaminidase. Studies concerning the effects of polymorphic forms of arsenic methyl-transferase (AsMT) in regulating the toxicity of AsIII in mice (Stýblo et al., 2002; Aposhian et al., 2004; Wang et al., 2008) highlighted the importance of polymorphisms in the metabolic pathway in mediating formation of toxic methylated arsenical metabolites.
The use of biomarkers beyond the individual level has not always allowed for cause-effect relationships. A major limitation of biomarker use is that a variety of responses have been identified in exposed organisms, making difficult to link environmental exposure to specific chemical entities and subsequent biological effects. Variability in biomarker responses may be attributed to abiotic (temperature, salinity, dissolved oxygen, etc.) or biotic factors (genotype, phenotypic plasticity, tolerance, age, sex, body size, etc.). In this case, the use of a multi-biomarker approach, in a range of species using sentinel organisms, becomes necessary to resolve or at least have a closer insight into complex environmental problems (Mussali-Galante et al., 2013).
1.4 Matrix metalloproteinases
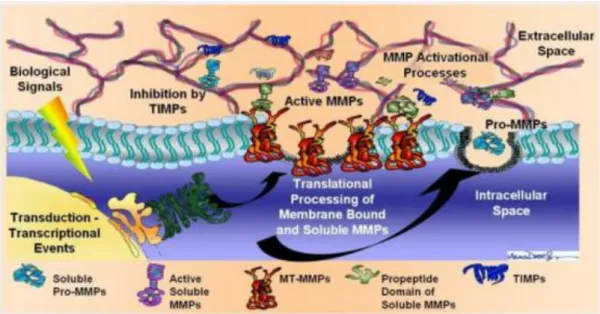
Matrix metalloproteinases (MMPs) are a family of at least 23 endopeptidases that act as effectors of extracellular matrix remodeling in physiological and pathological conditions (Figure 1.3). All family members are secreted as inactive proenzymes (zymogens) and are thought to be activated in the tissue by cleavage of the propeptide. All MMPs contain Zn2+ at the catalytic site and, in addition, require Ca2+ for stability and activity (Birkedal-Hansen, 1993). MMPs can be subdivided into gelatinases (MMP-2 and -9), collagenases (MMP-1, -8, -13 and -18), stromelysins (MMP-3, -10 and -11) and other MMPs, according to their substrate affinity profile. Their activity is closely regulated by tissue inhibitors of metalloproteinases (TIMPs), a group of four endogenous antagonists that bind to the catalytic site of MMPs. MMPs participate in normal remodeling processes such as embryonic development, post-partum involution of the uterus, bone remodeling, ovulation and wound healing (Woessner, 1991).
22
Figure 1.3. Matrix metalloproteinases (MMPs). They are Ca2+-dependent Zn2+-containing endopeptidases able to degrade extracellular matrix proteins in a variety of physiological and pathological processes.
MMPs hydrolyze extracellular matrix components in a variety of processes ranging from implantation and embryogenesis to inflammation, metastasis, and angiogenesis (Hernandez-Perez and Mahalingam, 2012). Metalloproteinases, whose production is enhanced by prostaglandins, play an important role in promoting uterine contractions and preterm birth by stimulating cervical ripening and membrane activation (Xu et al., 2002). In particular, metalloproteinases degrade extracellular matrix proteins, such as collagens and fibronectins, leading to weakening of membranes and their subsequent rupture (Vu et al., 2008). In a recent study by Sundrani et al. (2012), placental metalloprotein 1 and metalloprotein 9 levels were significantly increased in women with spontaneous preterm birth compared to those delivering at term, suggesting that placental metalloprotein 1/metalloprotein 9 levels may be involved in the initiation of parturition (Maymon et al., 2000). Polymorphisms in metalloproteinases and TIMPs have been found to modulate the risks for preterm premature rupture of membranes (PPROM) and preterm birth (Maymon et al., 2000; Cockle et al., 2007).
MMPs are also thought to modulate the effects of heavy metals especially Hg. Several polymorphisms in metalloproteinases and TIMPs have been found to modulate the effects of heavy metal exposure (especially Hg) on the risk of
23
cardiovascular diseases (Pepper, 2001). Indeed, MMP-2 and -9 have emerged as important players in a number of cardiovascular diseases, including atherosclerosis, stroke, heart failure, ischemic heart disease and aneurysm (Kupai et al., 2010). Also, the single nucleotide polymorphisms in these genes are associated with differential risk of preterm birth (Jacob-Ferreira et al., 2011; Jacob-Ferreira et al., 2010). Several other oxidative stress-related genes have been associated independently with heavy metals exposure and adverse pregnancy outcomes. It may be suggested that the effect of Hg on glial cell reactivity and Hg-induced oxidative stress via MMPs or paraoxonase 1 (PON1) modulating the effects of heavy metals seem also to play a role in the pathogenesis of preterm birth, perinatal hypoxia, bronchopulmonary dysplasia (BPD), preterm brain inflammation, and mortality (Türker, 2015).
Air pollutants, including heavy metals (e.g. Cd, Pb and Hg), can reach the respiratory system, eliciting pulmonary and/or systemic effects, which include inflammation, tissue remodeling and carcinogenesis: all phenomena where MMPs play critical roles, given their broad effects on matrix remodeling and modulation of inflammation and cell signaling (Löffek et al., 2011). In an in vitro study, Xu et al. (2011) evaluated modulation of MMP-2 and -9 expression by Ni on human lung cancer cell lines A549 and H1299 in the context of the analysis of their growing capacity and invasiveness. They demonstrated that Ni could significantly enhance the invasive potential of A549 and H1299 cells in a dose-dependent manner. This was accompanied by an elevated expression of interleukin (IL)-8, transforming growth factor-β and MMP-2 and MMP-9 proteins (Dagouassat et al., 2012). Fievez et al. (2009) examined MMP-2 and -9/TIMP-1 and -2 imbalance in rats exposed to Cd nebulisation. Such nebulisation induced a significant increase in bronchoalveolar lavage (BAL) MMP-2 and -9 and TIMP-2 expression and/or activities. In a descriptive in vivo study, Beaver et al. (2009) showed an increase in the levels of pro-MMP-9 in BAL fluid, strongly correlating with the presence of neutrophils in the airways, in mice exposed chronically to particles of hexavalent chromium (Cr(VI)), a well-known pro-inflammatory and carcinogenic agent (Fishbein, 1981). Wan et al. (2008) demonstrated that nanoparticles of Co, but not nanoparticles of titanium dioxide (TiO2), induced MMP-2 and -9 activity and
24
It has been demonstrated that divalent metal salts, as Zn, Cu, Hg and Sn, are capable to inhibit the activity of MMP-2 and MMP-9 at low concentration (Souza et al., 2000). It has also been observed that Pb, Cd and Zn inhibit the activity of enamel MMPs in vitro (Gerlach et al., 2000; Souza and Line, 2002).
Study of the pattern of MMP expression in response to heavy metals could provide important insights into the pathogenesis of clinical syndromes associated with toxic metal exposure. Furthermore, studies of metalloproteinase expression in response to heavy metals may provide a general model for tissue injury applicable to a wide range of lesions (Evans, 2015).
1.5 Aim of the project
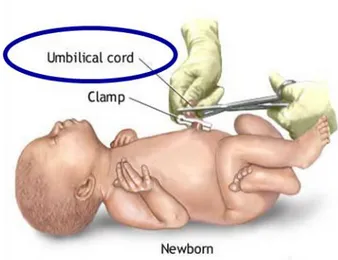
This research project has aimed to study the proteome of tissues of malformed fetuses exposed to heavy metals. This project is based on the proteomic analysis of umbilical cords (Figure 1.4) of malformed fetuses, obtained by therapeutic abortions, using as control umbilical cords of healthy fetuses with similar gestational age (psychiatric abortions). All umbilical cords have come from Caserta Hospital “Sant’Anna e San Sebastiano” and from Avellino Hospital “San Giuseppe Moscati”, which collect cases from the whole territory of the Campania Region; the umbilical cords were obtained by therapeutic abortions of mothers resident for more than 10 years in the areas of the provinces of Naples and Caserta, unhappily known as the “land of fires”. The comparison between the protein profiles observed in the umbilical cords of malformed fetuses and those of healthy fetuses with comparable gestational age may allow to individuate new possible specific biomarkers of exposure. Main aims:
identification of down or upregulated proteins;
study of proteomic data by complementary techniques;
25
Figure 1.4. Umbilical cord. Aim of this project was to study the proteome of umbilical cords. Cord
tissue contains several different cell types, including mesenchymal stem cells, epithelial cells and endothelial cells, each with different potential uses.
27
29
2 Materials and Methods
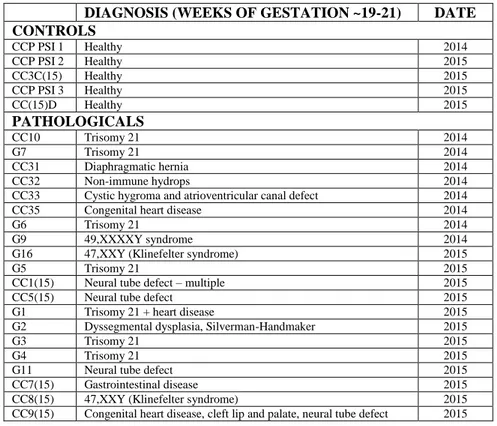
2.1 Umbilical cords from healthy and malformed fetuses
Caserta Hospital “Sant’Anna e San Sebastiano” and Avellino Hospital “San Giuseppe Moscati” (consent of the Ethics Committee, January 2014):
2014: GR1 (Healthy); GR2 (Healthy); GR3 (Healthy); GR4 (Healthy); GR5 (Healthy); GR6 (Healthy); GR7 (Healthy); GR8 (Healthy); GR9 (Healthy); GR10 (Healthy); CCP PSI 1 (Healthy); CC10 (Trisomy 21); G7 (Trisomy 21); CC31 (Diaphragmatic hernia); CC32 (Non-immune hydrops); CC33 (Cystic hygroma and atrioventricular canal defect); CC35 (Congenital heart disease); G6 (Trisomy 21); G9 (49,XXXXY syndrome).
2015: CCP PSI 2 (Healthy); CC3C(15) (Healthy); CCP PSI 3 (Healthy); CC(15)D (Healthy); G16 (47,XXY, Klinefelter syndrome); G5 (Trisomy 21); CC1(15) (Neural tube defect – multiple); CC5(15) (Neural tube defect); G1 (Trisomy 21 + heart disease); G2 (Dyssegmental dysplasia, Silverman-Handmaker); G3 (Trisomy 21); G4 (Trisomy 21); G11 (Neural tube defect); CC7(15) (Gastrointestinal
disease); CC8(15) (47,XXY, Klinefelter syndrome); CC9(15) (Congenital heart disease, cleft lip and palate, neural tube defect).
2.2 Protein extraction and quantitative analysis
Preliminary experiments were realized to select the best method of protein extraction from umbilical cords, crucial step for the subsequent analyses. Umbilical cord proteins were extracted by cryogenic grinding with mortar and pestle in dry ice of frozen tissue (100 mg) and by suspending in 600 µl of lysis buffer (7 M urea, 2 M thiourea, 4% (w/v) CHAPS, 40 mM DTT, 0.5% ampholytes) added with protease inhibitor (1:100 v/v). The mixture was vortexed, centrifuged at 13,000 g for 15 min and the supernatant was collected. The protein concentration of each extract was determined according to the Bradford method (Bradford, 1976), which is a colorimetric assay based on an absorbance shift of the dye Coomassie Brilliant Blue G-250. It was constructed a calibration curve with bovine serum
30
albumin (BSA) (1 µg/µl, 2.5 µg/µl, 5 µg/µl, 10 µg/µl, 20 µg/µl). 1 µl of lysate was added to 1 ml of the mixture H2O:Bradford reagent (8:2 v/v) and the assay
was performed by UV-visible spectrophotometer at 595 nm.
2.3 One-dimensional gel electrophoresis and in gel digestion
In a first step umbilical cords were analyzed by one-dimensional Sodium Dodecyl Sulfate - PolyAcrylamide Gel Electrophoresis (SDS-PAGE) approach, followed by ‘in gel’ enzymatic digestion with trypsin (Wilm et al., 1996). Briefly, each protein extract (70 µg) was dissolved in SDS-PAGE loading buffer (4% SDS, 20% glycerol, 10% 2-mercaptoethanol, 0.004% bromophenol blue, 0.125 M Tris-HCl, pH 6.8), boiled at 100°C for 5 min, and loaded in triplicate on a 1.5-mm thick 10% polyacrylamide gel. 5 µl of protein standard marker (Protein Marker VI (10 – 245) prestained, AppliChem, Darmstadt, Germany) were loaded alongside of each gel. The protein separation was performed at constant 30 mA/gel for 2 h at room temperature. Gels were stained by colloidal Coomassie Brilliant Blue staining solution and scanned by ImageScanner III LabScan 6.0 software (GE Healthcare). Resulting electrophoretic lanes were cut in 10 slices. The gel slices were washed and destained 3 times in deionized water, cysteines were reduced with 10 mM DTT in 100 mM ammonium bicarbonate buffer for 1 h at 56°C and then alkylated with 50 mM iodoacetamide in 100 mM ammonium bicarbonate buffer for 30 min at room temperature in the dark. Digestion was performed overnight at 37°C with 13 ng/μl trypsin (Promega, Madison, WI, USA) in 25 mM ammonium bicarbonate buffer. The resulting peptides were extracted with 0.1% formic acid in acetonitrile, dried in a vacuum centrifuge, and resuspended in 30 μl 0.1% formic acid in water for mass spectrometric analysis.
2.3.1 Mass spectrometry-based protein identification
Protein identification was performed by reverse-phase high-performance liquid chromatography (RP-HPLC) coupled to electrospray ionization tandem mass
31
spectrometry (ESI-MS/MS). Peptide mixtures produced by tryptic digestion (5 μl) were sequentially loaded on a reversed-phase column (0.1×150 mm, packed with C18, 5 μm, 100 Å) at a flow rate of 60 μl/min with buffer A (0.1% formic acid in water). The samples were run on a 73-min gradient, which consisted of a 5%–45% buffer B (0.1% formic acid in acetonitrile/water 80/20) for 55 min, 90% buffer B for 5 min, and 5% buffer B for 13 min. The peptide analysis was performed using the LTQ ORBitrap XL (Thermo Fisher Scientific) coupled directly to the LC column via a nano-electrospray source. The MS survey scan was obtained for the m/z range 400–1800, and the MS/MS spectra were acquired from the survey scan for the 10 most intense ions as determined by the Xcalibur mass spectrometer software in real time. Dynamic mass exclusion windows of 60 s were used to limit repeated sequencing (Song et al., 2009).
The thirty raw data MS/MS spectra from the three electrophoretic lanes of each sample were converted in MGF format by MM File Conversion tool for subsequent protein identification against the Swiss-Prot Protein Database (542,782 sequence entries, March 2014) through the MS search algorithm on the Mascot search engine (Perkins et al., 1999). The following search parameters were set: Peptide tolerance 25 ppm; MS/MS tolerance 0.8 Da; enzyme specificity: trypsin; 2 missed cleavages permitted; fixed modification: carbamidomethylation of cysteine; variable modification: methionine oxidation; taxonomy: Homo sapiens.
The ten MGF files from each electrophoretic lane were merged into a single search in order to output a single list of identified proteins.
2.4 Two-dimensional gel electrophoresis (2-DE)
Protein lysates (500 μg for each sample) were precipitated in acetone for sample purification, rehydrated with suitable buffer (7M urea, 2M thiourea, 2% w/v CHAPS, 0.5% v/v Pharmalyte pH 3-10, 0,002% v/v Bromophenol blue stock solution 1%) with 2,8 mg/ml of dithiothreitol (DTT) and loaded on IPG strips 18 cm (pH 3-10 nonlinear). IPG strips were inserted in Ettan IPGphor3 system (GE Healthcare) for IEF in first dimension and were subsequently equilibrated with a buffer containing SDS (50mM Tris/HCl, 6M urea, 30% glycerol, 2% SDS) before
32
the electrophoresis in second dimension. An aliquot of equilibration buffer was added with DTT (100 mg in 10 ml of solution) for reduction of denatured proteins, a second aliquot of equilibration buffer was instead added with iodoacetamide (IAA) (250 mg in 10 ml of solution) for subsequent alkylation of the reduced sulfhydryls. Each IPG strip was then loaded on gel for the separation in second dimension. Gels were then fixed in 40% ethanol, 10% acetic acid for 3 h, stained in 0.1% Coomassie Brilliant Blue R-250 and destained in 30% ethanol, 10% acetic acid. After coloration with Coomassie blue, gels were scanned and acquired by Image Scanner III LabScan 6.0 software (GE Healthcare). Gel images were analyzed using ImageMaster 2D Platinum 6.0 software (GE Healthcare) according to manufacturer’s instructions. Image analysis included spot detection, quantification and matching.
2.5 Filter-Aided Sample Preparation (FASP)
In the Filter-Aided Sample Preparation (FASP) method, umbilical cord proteins were extracted by cryogenic grinding with mortar and pestle in dry ice of frozen tissue (100 mg) and by suspending in 600 µl of lysis buffer (4% SDS, 100 mM Tris/HCl pH 7.6, 0.5 mM DTT) added with protease inhibitor (1:100 v/v). The mixture was vortexed, incubated at 95°C for 3 min, centrifuged at 13,000 g for 5 min and the supernatant was collected. The protein concentration of each extract was determined according to the DC Protein Assay (Bio-Rad), which is a colorimetric assay for protein concentration following detergent solubilization similar to the well-documented Lowry assay (Lowry et al., 1951; Peterson, 1979). The assay was performed in duplicate with a 96-well plate. It was constructed a calibration curve with BSA (1 µg/µl, 2.5 µg/µl, 5 µg/µl, 10 µg/µl, 20 µg/µl). 20 μl of reagent S (surfactant solution) were added to 1 ml of reagent A (reagent A'). 5 µl of lysate were loaded into each well. 25 μl of reagent A' and then 200 μl of reagent B were added into each well. After 15 minutes at room temperature in the dark, the absorbances were read by UV-visible spectrophotometer at 750 nm.
The FASP method uses centrifugal filters with a molecular weight cut-off, which allow to desalt and concentrate the sample. The filter unit then acts as a ‘proteomic
33
reactor’ for detergent removal, buffer exchange, chemical modification and protein digestion. The four critical steps of the FASP method are: (i) depletion of detrimental low-molecular-weight components in urea-containing buffer, (ii) carboamidomethylation of thiols, (iii) digestion of proteins and (iv) elution of peptides (Wiśniewski et al., 2009). After some preliminary checks, filters with a cut-off of 10 kDa (Microcon® Centrifugal Filters, EMD MilliporeTM) were used. 50 μg of protein extract were loaded on each filter. Detergent removal by buffer exchange was performed in two successive washes with UA (8M urea in 100 mM Tris-HCl pH 8.5) with a 20 min spin at 13,000 g. Proteins were reduced by adding 100 mM DTT in UA. Proteins were then alkylated with 50 mM IAA in UA at room temperature for 30 min in darkness. Urea was then removed by two washes with 50 mM ammonium bicarbonate with centrifugation at 13,000 g for 15 min. Protein digestion was achieved by adding 0.5 μg of trypsin (enzyme to protein ratio 1:100) in 50 mM ammonium bicarbonate to each filter and incubating at 37°C overnight. Peptides were recovered in two washes with 40 μl of 50 mM ammonium bicarbonate with spinning at 13,000 g for 20 min each. Peptides resulting from digestion were desalted by StageTips (C18 material 200μL, Thermo ScientificTM) according to manufacturer’s instructions and analyzed by LC/MS/MS (LTQ-OrbiTrap XL, Thermo ScientificTM).
2.5.1 Mass spectrometry-based protein identification
Peptides were separated on a EASY-nLC 1000 HPLC system (Thermo Fisher Scientific). Columns (75-μm inner diameter, 25-cm length) were in-house packed with 1.9-μm C18 particles. Peptides were loaded in buffer A (0.1% formic acid) and separated with a gradient from 7% to 60% buffer B (80% acetonitrile, 0.1% formic acid) within 3.5 h at 200 nl/min. A quadrupole Orbitrap mass spectrometer (Thermo Fisher Scientific) was directly coupled to the liquid chromatograph via a nano-electrospray source. The survey scan range was set to 400 to 1,800 m/z. Up to the 10 most abundant isotope patterns with a charge of ≥2 were subjected to Higher-energy collisional dissociation with a normalized collision energy of 25, an isolation window of 2 Th, and a resolution of 17,500 at m/z 200. To limit repeated
34
sequencing, dynamic exclusion of sequenced peptides was set to 60 s. Thresholds for ion injection time and ion target value were set to 20 ms and 3 × 10⁶ for the survey scans and to 60 ms and 106 for the MS/MS scans (Hornburg et al., 2014). Data were acquired using Xcalibur software (Thermo Fisher Scientific). LC/MS/MS analysis was performed in duplicate.
The protein identification and quantification was performed by MaxQuant 1.5.2.8 software (Max Planck Institute of Biochemistry). In MaxQuant all MS files were uploaded simultaneously, specifying the experiment name in order to get a different MaxLFQ (Label-Free Quantification) intensity for each MS run. The MS/MS spectra were searched against the UniProtKB HUMAN fasta database (70,071 forward entries; version of October 2015). MaxQuant validates scoring statistics based on hits to reversed protein entries in a target-decoy database. Therefore, it was necessary to include a reversed version for each original entry in the protein database fasta file. Reversed entries have to be indicated by a recognizable prefix to the protein ID, e.g. ‘REV_’ (Cox et al., 2009). Enzyme specificity was set to trypsin allowing cleavage N-terminal to proline and up to 2 miss cleavages. Peptides had to have a minimum length of 5 amino acids to be considered for identification. Carbamidomethylation was set as fixed modification, acetylation (N-terminus) and methionine oxidation were set as variable modifications. A false discovery rate (FDR) cutoff of 5% was applied at the peptide and protein level. Initial precursor mass deviation of up to 4.5 ppm and fragment mass deviation up to 20 ppm were allowed. Protein identification required a minimum peptide ratio count of 1 and at least one razor peptide. Razor peptides are non-unique peptides assigned to the protein group with the most other peptides (Occam’s razor principle) (Cox et al., 2009). Proteins that could not be discriminated on the basis of unique peptides were grouped into protein groups. MaxLFQ intensities were used to quantify fold changes of proteins across samples, (Hornburg et al., 2014).
2.5.2 Gene Ontology
Gene Ontology was performed using the PANTHER
35
(http://www.pantherdb.org/), which is part of the Gene Ontology Reference Genome Project. The PANTHER matches gene function, ontology, pathways and statistical analysis, and allows to analyze data of large-scale complete genomes coming from experiments of sequencing, proteomics or gene expression. Proteins and their genes are classified according to: family and subfamily; molecular function; biological process; pathway (Mi et al., 2013).
2.6 Gelatin zymography
Zymography is known as an electrophoretic technique, commonly based on SDS-PAGE, suitable for analysis of matrix metalloproteinases (MMPs) in complex biological fluids (serum, synovial fluid) and tissue extracts (heart, liver, kidney, spleen, etc.).
Samples (50 mg) were prepared in a standard, non-reducing loading buffer (62.5 mM Tris-HCl pH 6.8, 2.5% SDS, 0.002% Bromophenol Blue, 10% glycerol) for the separation by SDS-PAGE. No reducing agent (2-mercaptoetanol, DTT) or boiling are necessary since these would interfere with refolding of the enzyme. A suitable substrate (e.g. gelatin for protease detection) was embedded in the resolving gel during preparation of the acrylamide gel (10% polyacrylamide–0.1% gelatin). Protein concentration was determined by DC Protein Assay (Bio-Rad, Berkeley, CA, USA), using BSA as a standard. 150 µg of proteins, of each sample, were loaded on the gel. Following electrophoresis, the SDS was removed from the gel (or zymogram) by incubation in unbuffered Triton X-100 2,5%, followed by incubation in an appropriate digestion buffer (40mM Tris pH 7.5, 0.2M NaCl, 10mM CaCl2) for an optimized length of time (~16 h) at 37 °C. Gels were stained
with Coomassie blue and were then destained. Gelatinolytic activity was visualized as clear bands against a blue background. The intensity of each band present was performed with ImageJ software (http://rsbweb.nih.gov/ij/download.html). The relative mobility was determined using standard protein molecular weight markers.
36
2.7 Western blotting analysis
Umbilical cord whole lysates for immunoblot analysis were prepared according to the standard protocol. Protein concentration was determined by DC Protein Assay (Bio-Rad, Berkeley, CA, USA), using bovine serum albumin (BSA) as a standard. Proteins were fractionated on SDS-PAGE, transferred into nitrocellulose membranes, and immunoblotted with appropriate primary antibodies. Signals were visualized with appropriate horseradish peroxidase-conjugated secondary antibodies and enhanced chemiluminescence (Amersham Biosciences-GE Healthcare, NY, USA). Densitometry of bands was performed with ImageJ software (http://rsbweb.nih.gov/ij/download.html).
2.8 Statistical analysis
Data reported in each figure are the mean values ± SD from at least three experiments, performed in duplicate, showing similar results. Differences between treatment groups were analyzed by Student’s t-test. Differences were considered significant when p < 0.05.
37
39
3 Results and Discussion
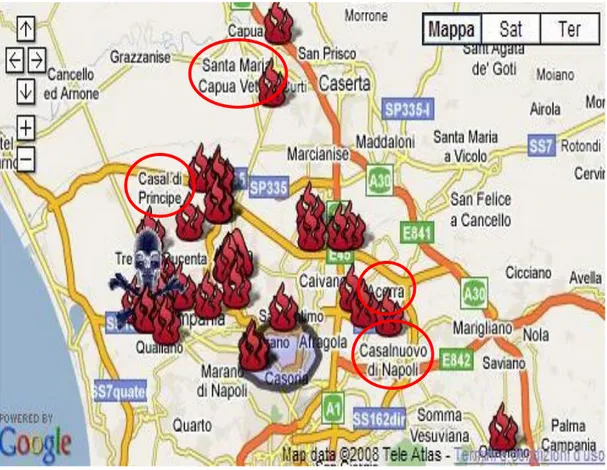
The aim of this project was to study the proteome of umbilical cords from malformed fetuses compared to healthy ones with same gestational age. All umbilical cords were obtained by therapeutic abortions of women living in Napoli or Caserta, in the so-called “land of fires” (Figure 3.1). The collection of the biological samples was carried out in collaboration with the Caserta Hospital “Sant’Anna e San Sebastiano” and with the Avellino Hospital “San Giuseppe Moscati” (The hospital ethics committee has reviewed and approved the project). The comparison between the protein profiles observed in umbilical cords of malformed and healthy fetuses may allow to identify differentially expressed proteins. The down or up-regulated proteins may indicate the biological pathways involved in the contaminants toxicity (González-Fernández et al., 2008). Gene Ontology (GO) classification was used in order to obtain functional information of the differentially expressed proteins, and to correlate them to the embryonic development. Matrix Metalloproteinases (MMPs) have been shown to play significant roles in a number of physiological processes, including embryogenesis and angiogenesis, they also contribute to the development of pathological processes. Thus, gelatin zymography technique was set up and performed for detection of MMPs enzymatic activity in the umbilical cords. At delivery, mothers consented for umbilical cords of fetus and for their hair sample be taken. By the administration of a questionnaire (Appendix A) were obtained data of historical residence of the parents of the malformed fetuses (last 10 years), genetic background, reproductive history, exposures to environmental risks, to use of chemicals. This was important in order to analyze two important aspects in the study of the malformation: the possible genetic background of the family and potential risks arising from the work environment. Data of historical exposure (time of living in a place) are very important to establish correlations between a possible environmental effect and a phenotype (fetal malformation). The metal contamination was measured by Prof. Stefania Papa, Seconda Università di Napoli, and by analyzing the concentrations of the metals in mother hair during the first trimester of pregnancy. The analysis of mother hair for about 25 carcinogenic, teratogenic and toxic metals was performed by atomic spectrometry, the method
40
recommended by the International Atomic Energy Agency (IAEA) to verify the individual exposure to metal contamination present in the environment (Bass et al., 2001). Quali-quantitative measures of the same metals were also performed on some umbilical cord samples.
Figure 3.1. “Land of fires”. The umbilical cords were collected by therapeutic abortions of mothers
living for more than 10 years in the towns of Acerra, Casal di Principe, Casalnuovo di Napoli and Santa Maria Capua Vetere.
41
3.1 Umbilical cords from healthy fetuses
In order to set up the experimental protocols, umbilical cords from healthy fetuses were collected by Dr. G. Rivezzi of the Caserta Hospital “Sant’Anna e San Sebastiano” (Table 3.1). The samples were transported in dry ice, dissected into aliquots of about 100 mg, washed with cold phosphate-buffered saline (PBS: 10 mM NaH2PO4; 2.7 mM KCl; 137 mM NaCl; pH 7.4) to remove contaminating
blood and stored at -80°C.
Table 3.1. Umbilical cords from healthy fetuses.
DIAGNOSIS WEEKS OF GESTATION DATE GR1 Healthy 36 2014 GR2 Healthy 36 2014 GR3 Healthy 34 2014 GR4 Healthy 32 2014 GR5 Healthy 36 2014 GR6 Healthy 36 2014 GR7 Healthy 38 2014 GR8 Healthy 39 2014 GR9 Healthy 36 2014 GR10 Healthy 36 2014
3.2 Protein extraction and quantitative analysis
Umbilical cord proteins were extracted as previously described (see “materials and methods”). The protein concentration of each extract was determined according to the Bradford method (Bradford, 1976). The protein concentrations measured for the different extracts were summarized in the Table 3.2.
42
Table 3.2. Protein extracts.
Sample Protein concentration (µg/µl) GR1 3,20 GR2 14,96 GR3 7,09 GR4 12,73 GR5 3,75 GR6 9,20 GR7 17,32 GR8 5,17
3.3 One-dimensional SDS-PAGE and in-gel digestion
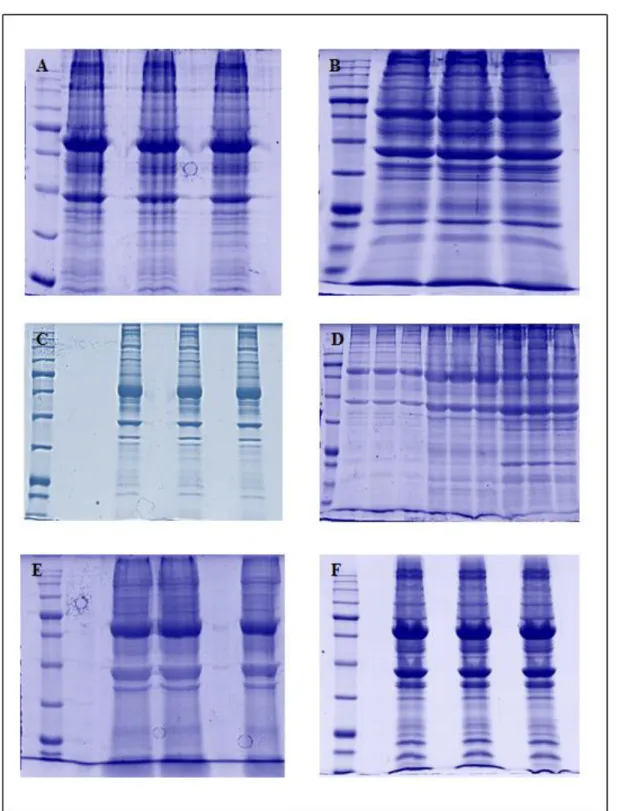
In a first step the umbilical cords were analyzed by one-dimensional SDS-PAGE approach, followed by ‘in gel’ enzymatic digestion with trypsin. Each protein extract (70 µg) was dissolved in SDS-PAGE loading buffer and loaded in triplicate on the polyacrylamide gel (Figure 3.2).
43
Figure 3.2. One-dimensional SDS-PAGE of protein extracts of umbilical cords from healthy
fetuses: A) GR1; B) GR2; C) GR3; D) GR4, GR5, GR6; E) GR7; F) GR8. Each sample was analyzed in triplicate.
44
Resulting electrophoretic lanes were cut in 10 slices, that underwent in-gel tryptic digestion. Peptides were extracted, dried in a vacuum centrifuge, and resuspended for mass spectrometry-based analysis.
3.3.1 Mass spectrometry-based protein identification
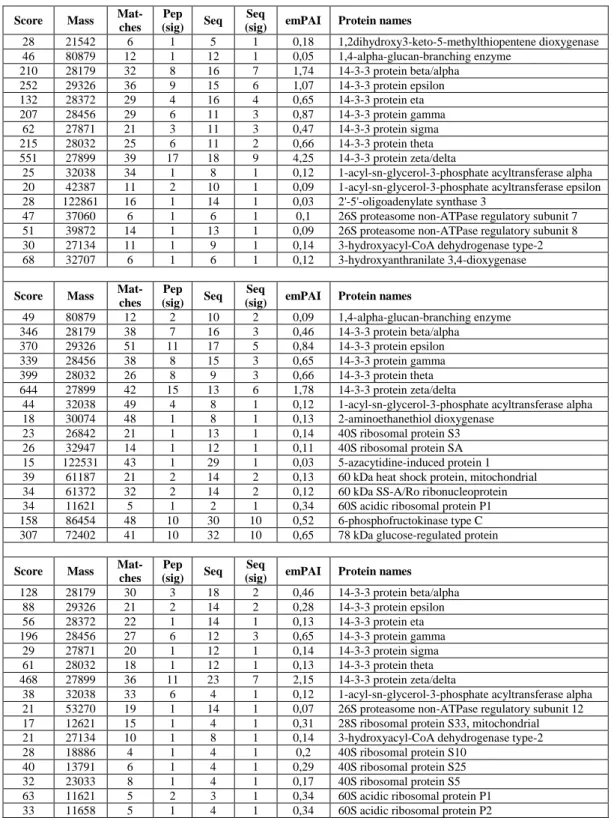
The peptides resulting from the digestion were analyzed by nanoLC/MS/MS. The protein identification was performed by Mascot search engine against the Swiss-Prot Protein Database. Mascot search engine assigns at each protein the parameter emPAI (exponentially modified Protein Abundance Index) for the absolute quantization of the protein in complex protein mixtures (Ishihama et al., 2005).
45
Table 3.3. Three lists of proteins for each sample identified by Mascot search engine.
Score Mass Mat-ches
Pep (sig) Seq
Seq
(sig) emPAI Protein names
28 21542 6 1 5 1 0,18 1,2dihydroxy3-keto-5-methylthiopentene dioxygenase 46 80879 12 1 12 1 0,05 1,4-alpha-glucan-branching enzyme 210 28179 32 8 16 7 1,74 14-3-3 protein beta/alpha 252 29326 36 9 15 6 1,07 14-3-3 protein epsilon 132 28372 29 4 16 4 0,65 14-3-3 protein eta 207 28456 29 6 11 3 0,87 14-3-3 protein gamma 62 27871 21 3 11 3 0,47 14-3-3 protein sigma 215 28032 25 6 11 2 0,66 14-3-3 protein theta 551 27899 39 17 18 9 4,25 14-3-3 protein zeta/delta
25 32038 34 1 8 1 0,12 1-acyl-sn-glycerol-3-phosphate acyltransferase alpha 20 42387 11 2 10 1 0,09 1-acyl-sn-glycerol-3-phosphate acyltransferase epsilon 28 122861 16 1 14 1 0,03 2'-5'-oligoadenylate synthase 3
47 37060 6 1 6 1 0,1 26S proteasome non-ATPase regulatory subunit 7 51 39872 14 1 13 1 0,09 26S proteasome non-ATPase regulatory subunit 8 30 27134 11 1 9 1 0,14 3-hydroxyacyl-CoA dehydrogenase type-2 68 32707 6 1 6 1 0,12 3-hydroxyanthranilate 3,4-dioxygenase
Score Mass Mat-ches
Pep (sig) Seq
Seq
(sig) emPAI Protein names
49 80879 12 2 10 2 0,09 1,4-alpha-glucan-branching enzyme 346 28179 38 7 16 3 0,46 14-3-3 protein beta/alpha 370 29326 51 11 17 5 0,84 14-3-3 protein epsilon 339 28456 38 8 15 3 0,65 14-3-3 protein gamma 399 28032 26 8 9 3 0,66 14-3-3 protein theta 644 27899 42 15 13 6 1,78 14-3-3 protein zeta/delta
44 32038 49 4 8 1 0,12 1-acyl-sn-glycerol-3-phosphate acyltransferase alpha 18 30074 48 1 8 1 0,13 2-aminoethanethiol dioxygenase
23 26842 21 1 13 1 0,14 40S ribosomal protein S3 26 32947 14 1 12 1 0,11 40S ribosomal protein SA 15 122531 43 1 29 1 0,03 5-azacytidine-induced protein 1 39 61187 21 2 14 2 0,13 60 kDa heat shock protein, mitochondrial 34 61372 32 2 14 2 0,12 60 kDa SS-A/Ro ribonucleoprotein 34 11621 5 1 2 1 0,34 60S acidic ribosomal protein P1 158 86454 48 10 30 10 0,52 6-phosphofructokinase type C 307 72402 41 10 32 10 0,65 78 kDa glucose-regulated protein
Score Mass Mat-ches
Pep (sig) Seq
Seq
(sig) emPAI Protein names
128 28179 30 3 18 2 0,46 14-3-3 protein beta/alpha 88 29326 21 2 14 2 0,28 14-3-3 protein epsilon 56 28372 22 1 14 1 0,13 14-3-3 protein eta 196 28456 27 6 12 3 0,65 14-3-3 protein gamma 29 27871 20 1 12 1 0,14 14-3-3 protein sigma 61 28032 18 1 12 1 0,13 14-3-3 protein theta 468 27899 36 11 23 7 2,15 14-3-3 protein zeta/delta
38 32038 33 6 4 1 0,12 1-acyl-sn-glycerol-3-phosphate acyltransferase alpha 21 53270 19 1 14 1 0,07 26S proteasome non-ATPase regulatory subunit 12 17 12621 15 1 4 1 0,31 28S ribosomal protein S33, mitochondrial 21 27134 10 1 8 1 0,14 3-hydroxyacyl-CoA dehydrogenase type-2 28 18886 4 1 4 1 0,2 40S ribosomal protein S10
40 13791 6 1 4 1 0,29 40S ribosomal protein S25 32 23033 8 1 4 1 0,17 40S ribosomal protein S5 63 11621 5 2 3 1 0,34 60S acidic ribosomal protein P1 33 11658 5 1 4 1 0,34 60S acidic ribosomal protein P2
46
3.3.2 Assessment of technical variability
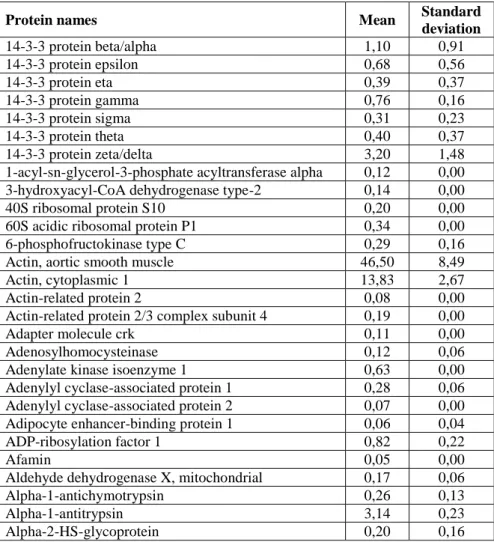
The three lists were aligned manually on the basis of the quantitative mascot parameter (emPAI) in order to calculate mean and standard deviation for the measured amount of each protein. Each protein may be present in only one, two or all three lists. Where a protein wasn’t detected, a zero emPAI value was added. Finally a single list of proteins (~ 1000 identified proteins) was obtained for each sample, where a mean emPAI value and the relative standard deviation was reported for each protein (Table 3.4).
It wasn’t possible to calculate mean and standard deviation for the samples GR1 and GR2, because their three lists were very different as number of identified proteins. Therefore, the samples GR1 and GR2 were discarded.
Table 3.4. Mean and standard deviation of proteins for each sample.
Protein names Mean Standard deviation 14-3-3 protein beta/alpha 1,10 0,91 14-3-3 protein epsilon 0,68 0,56 14-3-3 protein eta 0,39 0,37 14-3-3 protein gamma 0,76 0,16 14-3-3 protein sigma 0,31 0,23 14-3-3 protein theta 0,40 0,37 14-3-3 protein zeta/delta 3,20 1,48 1-acyl-sn-glycerol-3-phosphate acyltransferase alpha 0,12 0,00 3-hydroxyacyl-CoA dehydrogenase type-2 0,14 0,00 40S ribosomal protein S10 0,20 0,00 60S acidic ribosomal protein P1 0,34 0,00 6-phosphofructokinase type C 0,29 0,16 Actin, aortic smooth muscle 46,50 8,49 Actin, cytoplasmic 1 13,83 2,67 Actin-related protein 2 0,08 0,00 Actin-related protein 2/3 complex subunit 4 0,19 0,00 Adapter molecule crk 0,11 0,00 Adenosylhomocysteinase 0,12 0,06 Adenylate kinase isoenzyme 1 0,63 0,00 Adenylyl cyclase-associated protein 1 0,28 0,06 Adenylyl cyclase-associated protein 2 0,07 0,00 Adipocyte enhancer-binding protein 1 0,06 0,04 ADP-ribosylation factor 1 0,82 0,22
Afamin 0,05 0,00
Aldehyde dehydrogenase X, mitochondrial 0,17 0,06 Alpha-1-antichymotrypsin 0,26 0,13
Alpha-1-antitrypsin 3,14 0,23
47
Subsequently, the intra-sample variability was calculated with the following mode (Auger et al., 2000):
Intra-sample variability = Mean of the standard deviationsMean of the means
× 100
The intra-sample variabilities were reported in the Table 3.5.
Table 3.5. Intra-sample variabilities.
Sample Intra-sample variability
GR3 67,23% GR4 24,28% GR5 37,81% GR6 66,53% GR7 101,22% GR8 39,33%
In order to minimize these variabilities, the proteins present in only one of the three lists were omitted, while the proteins present in at least two lists on three were considered. The intra-sample variabilities thus were recalculated and reported in Table 3.6.
Unfortunately, they were still too high and actually not satisfactory.
Table 3.6. Intra-sample variabilities recalculated.
Sample Intra-sample variability
GR3 65,35% GR4 21,86% GR5 29,71% GR6 63,71% GR7 100,22% GR8 34,20%
48
3.4 Two-dimensional gel electrophoresis (2-DE) and image analysis
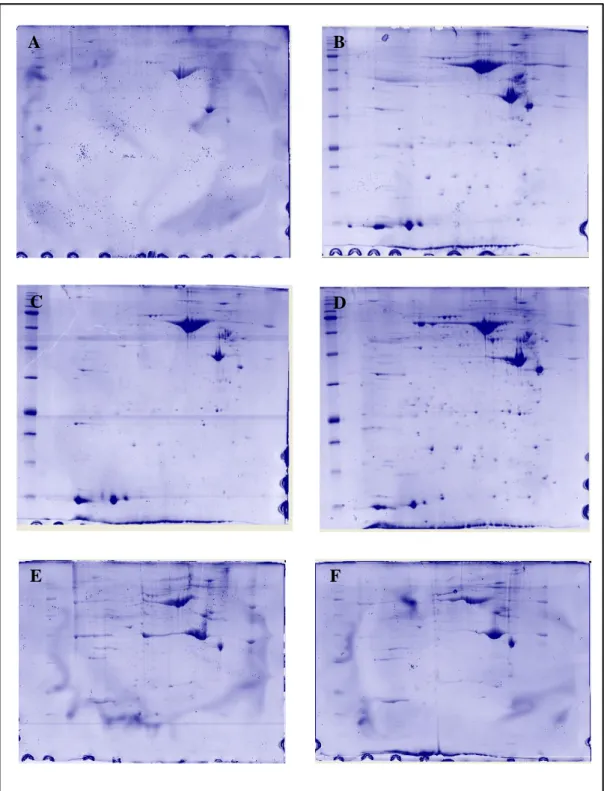
In order to overcome the high technical variabilities showed by one-dimensional SDS-PAGE analysis, it was then set up a proteomic approach based on two-dimensional gel electrophoresis (2-DE). All 2-DE experiments were performed on test samples of umbilical cords from healthy term fetuses. The umbilical cord proteins were separated by IEF using 18 cm IPG strips (pH 3-10NL; GE Healthcare) on the basis of their charge (separation in first dimension) and by SDS-PAGE on the basis of their molecular weight (separation in second dimension). The result is an array of protein spots, characterized by precise coordinates x and y: isoelectric point (pI) and apparent molecular weight (Mw), respectively. Each spot potentially corresponds to a single protein in the sample (Figure 3.3). The gel image analysis was performed by ImageMaster 2D Platinum 6.0 software (GE Healthcare) according to manufacturer’s instructions; the most significant spots, were subjected to ‘in gel’ enzymatic digestion and LC/MS/MS analysis for protein identification. The image analysis included spot detection, gel-to-gel matching and spot quantification (Raman et al., 2002). Manual editing (e.g. deletion of false protein spots and correction of spot shape) during the spot detection is nearly impossible to avoid due to complexity of spots on a gel as well as manual matching because of dissimilarity of spot positions. However, an excessive manual interventions should be avoided to increase the reliability of the image control and the reproducibility of the procedure (Magdeldin et al., 2014). Ambiguous regions, such as crowded areas or areas containing high-molecular-weight proteins that were not well defined, were discarded. Some of the spots detected at the boundaries of the gels and not satisfactorily resolved were also excluded from further analysis. Therefore, the number of the spots detected was always below that expected from the resolution capability of the technique; this result is related to our choose to use a conservative approach for the analysis of the gels, counting only clearly defined spots and not considering outermost and confusing areas.
49
Figure 3.3. 2-DE of protein extracts of umbilical cords from healthy fetuses: A) GR1; B) GR2; C)
GR3; D) GR4; E) GR6; F) GR7.
A B
C D
50
3.4.1 Limitations of 2-DE
Several limitations intrinsically related to the use of a 2-DE electrophoresis-based approach emerged. Firstly, this project involved the screening of a large number of clinical samples; since 2-DE is labor-intensive and has a relative low throughput, that represented a serious obstacle for a project like this.
Secondarily, there could also be a progressive loss of basic proteins during long running of electro-focusing under electric field, leading to low reproducibility and requiring careful monitoring of electric field (Magdeldin et al., 2012).
Different types of proteins can always be missing, due to the difficulty in separating membrane-bound (hydrophobic) and extreme proteins (highly acidic or basic) (Wilkins et al., 1998).
Low dynamic range of proteins is one of the challenging problems encountered during 2-DE. Low-abundance proteins are rarely seen on traditional 2D maps because large quantities of abundant soluble proteins obscure their detection. Moreover, the visualization of faint protein spots (low abundant) separated on 2-DE gels is also governed by staining sensitivity (Chevalier, 2010).
Spot detection software sometimes lead to missing some data because of the mismatching error resulted due to shifted spots between gels or spots overlapping. Furthermore, false positive spots are commonly detected due to staining artifacts. The relationship between the original protein quantity in the sample and the measured spot intensity is affected by various intervening factors (e.g., sample loss occurring during the IEF or while transferring to the second dimension) (Magdeldin et al., 2014).
Finally, the umbilical cord is a heterogeneous tissue containing several different cell types, including mesenchymal stem cells, epithelial cells and endothelial cells. Several umbilical cords had also a significant contamination by blood that represented a serious obstacle for the success of the technique.
Therefore, all these reasons led us to introduce a different gel-free proteomic approach based on “Filter-Aided Sample Preparation (FASP)” technique.