Working
Paper
The effects of air pollution
on COVID-19 related
mortality in Northern Italy
June 2020
Coker Eric, Cavalli Laura, Fabrizi Enrico,
Guastella Gianni, Lippo Enrico, Parisi Maria
Laura, Pontarollo Nicola, Rizzati Massimiliano,
Varacca Alessandro and Vergalli Sergio
The effects of air pollution on COVID-19 related mortality in
Northern Italy
By Coker Eric
1, Cavalli Laura
2, Fabrizi Enrico
3, Guastella Gianni
2,4, Lippo Enrico
2,
Parisi Maria Laura
5, Pontarollo Nicola
5, Rizzati Massimiliano
2, Varacca Alessandro
6and Vergalli Sergio
2,5Abstract
Long-term exposure to air pollutant concentrations is known to cause chronic lung inflammation, a condition that may promote increased severity of COVID-19 syndrome caused by the novel coronavirus. In this paper, we empirically investigate the ecologic association between long-term exposure to fine particulate matter (PM) concentration and excess deaths in the first quarter of 2020 in municipalities of Northern Italian. The study accounts for potentially spatial confounding factors related to urbanization that may have influenced the spreading of the novel coronavirus. Our epidemiological analysis uses geographical information (e.g., municipalities) and Poisson regression to assess whether both ambient PM concentration and excess mortality have a similar spatial distribution. Preliminary evidence confirms the hypothesis and suggests a positive association of ambient PM on excess mortality in Northern Italy
Keywords: COVID-19, mortality, pollution, Italy, municipalities JEL codes: I18, Q53
The opinions expressed in this paper do not necessarily reflect the position of Fondazione Eni Enrico Mattei Corso Magenta, 63, 20123 Milano (I), web site: www.feem.it, e-mail: [email protected]
1 College of Public Health and Health Professions, University of Florida, Gainesville, FL, US 2 Fondazione Eni Enrico Mattei, Milan, IT
3 Department of Economics and Social Sciences, Università Cattolica del Sacro Cuore, Piacenza, IT
4 Department of Mathematics and Physics, Università Cattolica del Sacro Cuore, Brescia, IT 5 Department of Economics and Management. Università degli studi di Brescia, Brescia, IT 6 Department of Agricultural Economics, Università Cattolica del Sacro Cuore, Piacenza, IT
01
Introduction
The spreading of the new coronavirus in Italy has caused tremendous effects on human health, and the consequent containment measures adopted by the central and the regional governments, while securing population from accelerating contagion, are adding the adverse socio-economic effects of lockdown to the already dramatic public health impacts. Official morbidity statistics, although limited by the public health interventions and the emergency status, reveal a strong spatial clustering phenomenon across administrative regions in the country and provinces and municipalities within each region. Such a geographical concentration of both morbidity and mortality is most likely the result of the interaction of multiple factors, among which include the clustering of initially infected individuals, different choices made about testing and contact tracing in order to identify community transmission, and the timely adoption of lockdown measures to control the COVID-19 epidemic (Ciminelli & Garcia-mandicó, 2020). Beyond such factors, however, contextual factors may have played a role. The Northern Italian regions most affected by the spreading of coronavirus (Lombardia, Veneto, Piemonte, Emilia Romagna) are also the most densely populated and heavily industrialized and thereby polluted. These
four regions together host 39% of the national population,1 and approximately one-half of
the Italian GDP is produced there. The spatial concentration of economic activities involves the industrial manufacturing sectors to the largest extent, and the consequent high level of emissions is at least in part responsible for poor air quality.2 In Brescia, among the most
affected cities in Lombardy, the concentration of particulate matter (PM) and ozone exceeded the allowed threshold in 150 days in 2018, making it the most polluted city in Italy. Lodi and Monza follow, with 149 and 140 days respectively, and Milan and Bergamo are sixth and ninth respectively, with 135 and 127 days. Lombardy is also among the most polluted regions in Europe (European Environmental Agency, 2019). Moreover, compared to its overall representation in the population, Lombardy is disproportionately impacted by COVID-19 related mortality with approximately 53% of deaths as of April 15th, 2020 (Odone et
al., 2020)
There are a number of plausible pathways by which airborne PM may impact COVID-19 related morbidity and mortality. Existing data already finds a strong positive correlation between viral respiratory infection incidence and PM concentrations (Ciencewicki & Jaspers, 2007; Sedlmaier et al., 2009). One plausible
1 At January 1st 2019, source: ISTAT.
2 Different components of gas emissions (e.g. nitrogen dioxide, carbon monoxide), derive from many activities like traffic congestion, house heating, agricultural and husbandry practices, as well as industrial combustion. Concentrations are characterized by seasonality, with high levels in Winter, and weather conditions, however the 2020 lockdown measures reduced substantially those derived from traffic but not those derived from agricultural activities (ARPA Lombardia, 2020).
pathway for this phenomenon is the fate and transport of the virus itself within the environment. A recent position paper by the Italian Society of Environmental Medicine argues that PM may act as both a carrier and substrate of the virus and thus influence the virus’ fate and transport in the environment and reaching susceptible receptors (Setti et al., 2020). Another pathway is the increase in susceptibility to COVID-19 mortality from long term exposure to PM. Fine PM is already known to affect cardiovascular and respiratory morbidity and mortality (Cakmak et al., 2018; Jeong et al., 2017; McGuinn et al., 2017; Yin et al., 2017). Moreover, among 1,596 Italian COVID-19 patients who died in the hospitals, and for whom it was possible to analyze clinic charts, data showed substantial comorbidities including ischemic heart disease (27.9%); atrial fibrillation (22.4%); heart failure (15.6%); stroke (10.9%); hypertension (70.6%), and chronic obstructive pulmonary disease (17.9%) (Istituto Superiore di Sanità, 2020). Biologically, long-term PM exposure may be responsible for a chronic inflammation status that causes the hyper-activation of the immune system and the life-threatening respiratory disorders caused by COVID-19 (Shi et al., 2020).
Some empirical evidence is now emerging about COVID-19 that shows a positive
relationship between air pollution and morbidity and mortality. Conticini et al. (2020) use the European Air Quality Index data to provide evidence of this correlation between the relatively high COVID-19 mortality in Northern Italy and atmospheric pollution. A separate analysis by Becchetti et al. (2020) finds empirical evidence of such a positive effect of air pollution on mortality in Italy based on the analysis of death data at the province level.
Similarly, Wu et al. (2020) show a positive association between long term PM exposure and COVID-19-related death in US counties. In this paper, we follow this emerging stream of empirical literature and test the hypothesis that a higher average long-term exposure to PM is positively associated with the current extraordinarily high death toll in Northern Italy. Mortality data are collected at the municipality level for the period January-March 2020. Given that mortality data are not disaggregated by mortality cause, death counts are measured as the difference from the last three-years mean to reflect the abnormal number of deaths caused by the spreading of the pandemic. Since PM can be associated to generic
mortality even in the absence of the pandemic outbreak (Dominici et al., 2003; Katsouyanni et al., 2001; Samet et al., 2000), we also estimate the impact of PM on mortality in the sample using 2019 data, a time in which this coronavirus had not yet spread. Data on PM concentration at the municipality level refer to the years prior 2020 to account for long-term population exposure to pollutants. We obtain municipality PM concentration by simple spatial interpolation of monitoring station data related to years 2015-2019.
We estimate a negative binomial model of excessive deaths on historical PM concentrations and a series of control variables that may plausibly affect both PM concentration and mortality, including population density; the spatial concentration of the industrial manufacturing sites; climatic conditions observed during the first quarter of 2020, such as temperature and humidity; and the demographic composition of the municipal population. In addition, we consider
spatial heterogeneity in the distribution of the number of deaths related to regional and local unobservable factors. We account for region-specific effects because regions, in Italy, are the administrative units in charge of managing the health systems and the measures
taken to trace and contrast the spreading of the pandemic varied greatly among even contiguous regions. We also account for local effects common to functionally linked clusters of municipalities (the Local Labour Systems – LLS). We deem this part of the identification strategy crucial because the relationship between PM and COVID-19 mortality may be
confounded by several other factors, some of which were not observable or measurable, but are nevertheless intrinsically related to the geographical location of the observed units. The remainder of the paper is organized as follows. The next section introduces the empirical strategy and describes the dataset. The results are presented and discussed in section three, considering the total number of (excess) deaths. Section four draws the conclusions and highlights the limitation of the study and the indications for future research.
Official territorial data on COVID-19 mortality in Italy are available at the rather aggregate regional or provincial level, corresponding to the levels 2 and 3 respectively of the European nomenclature units for territorial statistics (NUTS).3 In addition, these data refer to the
deaths of patients tested positive for severe acute respiratory syndrome coronavirus 2 (SARS-CoV2) only and do not include (potential) patients without COVID-19 diagnosis because they were not tested and died at home or elsewhere. Hence, the reported deaths are likely underestimated. Because testing policies vary among regions in Italy, the induced
measurement error is also non-randomly distributed among the provinces. Ciminelli & Garcia-Mandicó (2020) compare the official COVID-19 fatality rates with historical death data and report that deaths were higher than official fatalities throughout the period of COVID-19 epidemic.
Working under the assumption that COVID-19 deaths are underestimated in Italy, the choice is made in this paper to use deaths from the official registries, accordingly, and to scale the analysis at the municipality level, the smallest administrative units, to have a more granular representation of the spatial dimension of the phenomenon. Since we are interested in excess deaths, we take the difference between the number of deaths in the period January 1st – April 4th 2020 and the average number of
deaths in the same period of the previous five years (ExDeaths) and use this ExDeaths metric as the dependent variable in our statistical model.
The variable is assumed to follow a Negative Binomial distribution, a generalization of the Poisson distribution that avoids the restrictive mean-variance equality of the latter, and is modelled as follows:
(1)
where
θ
is the overdispersion parameter to be estimated and μi is the municipality-specific expectation conditional on the value of the covariates. Among the covariates,PM
is the concentration of fine particulate matter in municipalityi
and β is the associated parameter, which we expect positive and statistically different from zero;X
is a vector of control variables that adjusts for the potential confounding effects and includes the (log of) total population as the offset whileε
is a normally-distributed error term.The hypothesis that PM concentration affected COVID deaths, that is
β
1 > 0, is tested among several possible specifications. In model (2) we include regional effects (λj). These effects are expected to capture the aspects related to the02
Empirical strategy and data
3 https://ec.europa.eu/eurostat/web/nuts/background
ExDeaths
i~
NB(μ
i, θ)
management of the outbreak, which may have systematically influenced COVID-19 mortality and that are common to all the municipalities in the same region. Italy has a national health system that ensures equal access to cares to all citizens. The system is managed by regions at the local level and, in the specific case of this pandemic, regions were responsible for defining the testing and contact-tracing protocols and implementing the necessary measures to contain the outbreak, among which the measure to protect healthcare workers. In model (3) we include LLS-specific effects (
e
k) . LLS are spatial clusters ofcontiguous municipalities related by commuting flows that share a common specialization in a specific sector of manufacturing production and correspond to the conceptualization of Marshallian districts (Becattini, 2002). The use of LLS captures the interlinkages within neighbouring municipalities that may have favoured the geographical spreading of coronavirus around specific hotspots.
Mortality data are then expected to vary among municipalities in different LLS, but differences are expected to be non-systematic in this case. In model (4) we include both the regional fixed effects and the LLS random effects.
(2)
(3)
(4)
Control variables to be included in the model were chosen to avoid any potential confounding effect. The population density accounts for the spatial distribution of people over the built-up area. The most densely populated municipalities are among the most polluted due to the spatial concentration of manufacturing and service activities but are also the places where the contagion could have been easier, with a potential impact on mortality. In addition to the density of population, the shares of municipality area occupied by agricultural land and industrial sites respectively are included in the regression because related to pollutant concentration and possibly to mortality. National measures to stop the spreading of the viral infection (lockdown) involved the service sector to the largest extent while all the agricultural and many manufacturing activities, being considered necessary, were left open and, in the absence of social distance and individual protection measures, the
geographical concentration of these activities in a municipality may have influenced mortality. Humidity and average temperature, for which an association with COVID-19 deaths has also been found (Ma et al., 2020), are also included in the regression. COVID-19 incidence has proven to be higher among men than women and people aged 65 or more, and the two variables are considered in the model, even though these aspects are not necessarily connected with the average PM exposure in a municipality. The full details of the variables in the model, including sources and summary statistics, are presented in Table 1.
ExDeaths
i~
NB(μ
ij, θ)
log(μ
ij) = α + βPM
ij+ δ' X
ij+ λ
j+ε
ijExDeaths
i~
NB(μ
ik, θ)
log(μ
ik) = α + βPM
ik+ δ' X
ik+ u
iku
ik=
ε
ik+ e
kExDeaths
i~
NB(μ
ijk, θ)
log(μ
ijk) = α + βPM
ijk+ δ' X
ijk+ λ
i+ u
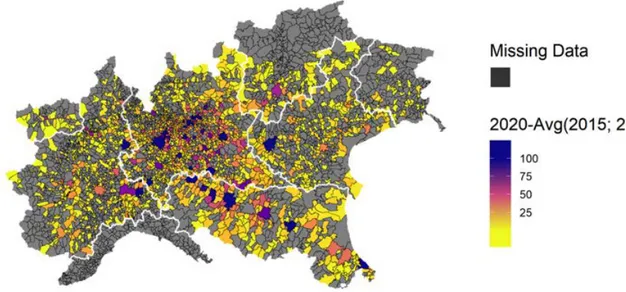
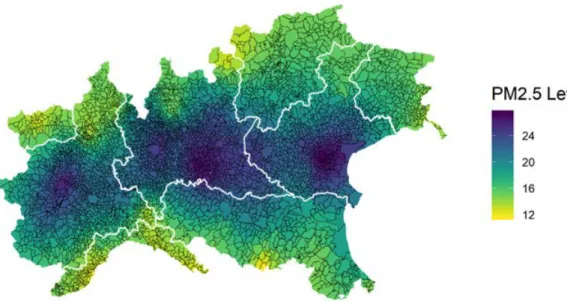
ijkFigures 1 and 2 map the spatial distribution of the dependent variable (ExDeaths) and the main explicative variable (PM2.5), respectively. In both cases, it is possible to appreciate a spatial concentration of the phenomena around hotspots, and there is also a reasonable
degree of coincidence between the location of the hotspots in the two maps, in particular in the Lombardy region, notably the region with the highest number of hotspots. Regional boundaries are highlighted in white in Figure 1.
Table 1: Description of model variables and summary sample statistics
Figure 1: Spatial distribution of cumulative excess deaths in sample municipalities, Northern Italy, January 1st – April 4th 2020
Variable Description Mean Median SD
ExDeaths Number of deaths in the period January 1st – April 4th 2020 – absolute
difference compared to the average of the past five years, source: ISTAT 12.14 6 29.12 PM2.5 Fine particulate matter concentration (2.5 µg/m³) obtained by spatial
interpolation of monitoring stations, average across the years 2015-2019, source: European Environmental Agency
19.679 20.853 4.158 Popd Population density computed as total population in number of inhabitants
on January 1st 2020 over the total artificial area in Km2, sources: ISTAT and
European Environmental Agency – Corine land Cover data
54.38 27.18 78.14 Agriland Share of agricultural area on total municipality surface 0.599 0.676 0.286 Indland Share of industrial area on total municipality surface 0.038 0.018 0.057 Temp Average mean skin temperature during the death observation period, source:
Copernicus ERA5 0.25°x0.25° grid resolution dataset. 5.258 5.705 3.128 Hum Average mean two meters dewpoint temperature during the observation
period, source: Copernicus ERA5 0.25°x0.25° grid resolution dataset. 0.229 0.227 0.039 Ratiofemale Ratio between female and male population 1.031 1.031 0.041 Share65 Share of population older than 65, source: ISTAT 0.223 0.220 0.037
Figure 2: Spatial distribution of PM2.5 concentration levels in the sample municipalities, simple kriging of monitoring stations, average across years 2015-2019
Estimation results are summarised in Table 2 for the four different specifications of the model (1- no effects; 2 regional fixed effects; 3- LLS random effects; 4- regional fixed effects and LLS random effects). In the lower part of the
table, the estimated overdispersion parameter, the Akaike Information Criterion (AIC), and the Moran’s test for the null hypothesis of absence of spatial autocorrelation4 in the residuals
(Moran, 1950) are reported.
03
Results
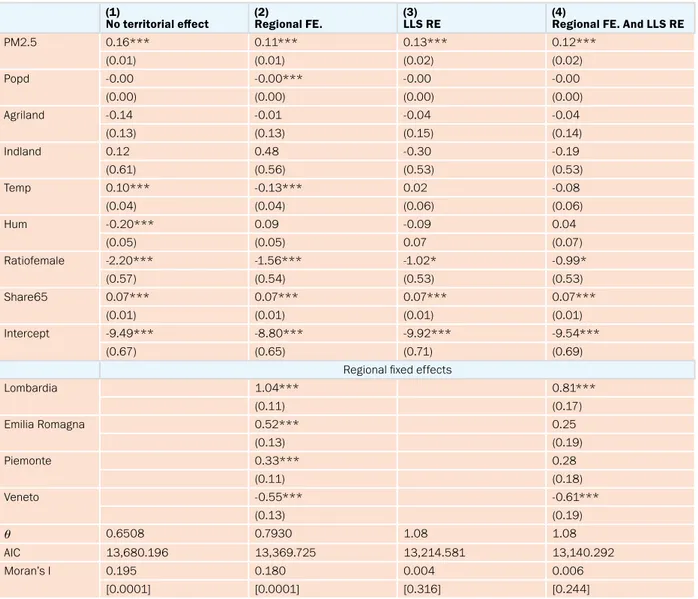
Table 2: Estimation result of main regressions, dependent variable: excess deaths during the period January 1st – April 4th 2020,
municipalities in Northern Italy (N=2499) (1)
No territorial effect (2)Regional FE. (3)LLS RE (4)Regional FE. And LLS RE
PM2.5 0.16*** 0.11*** 0.13*** 0.12*** (0.01) (0.01) (0.02) (0.02) Popd -0.00 -0.00*** -0.00 -0.00 (0.00) (0.00) (0.00) (0.00) Agriland -0.14 -0.01 -0.04 -0.04 (0.13) (0.13) (0.15) (0.14) Indland 0.12 0.48 -0.30 -0.19 (0.61) (0.56) (0.53) (0.53) Temp 0.10*** -0.13*** 0.02 -0.08 (0.04) (0.04) (0.06) (0.06) Hum -0.20*** 0.09 -0.09 0.04 (0.05) (0.05) 0.07 (0.07) Ratiofemale -2.20*** -1.56*** -1.02* -0.99* (0.57) (0.54) (0.53) (0.53) Share65 0.07*** 0.07*** 0.07*** 0.07*** (0.01) (0.01) (0.01) (0.01) Intercept -9.49*** -8.80*** -9.92*** -9.54*** (0.67) (0.65) (0.71) (0.69)
Regional fixed effects
Lombardia 1.04*** 0.81*** (0.11) (0.17) Emilia Romagna 0.52*** 0.25 (0.13) (0.19) Piemonte 0.33*** 0.28 (0.11) (0.18) Veneto -0.55*** -0.61*** (0.13) (0.19) θ 0.6508 0.7930 1.08 1.08 AIC 13,680.196 13,369.725 13,214.581 13,140.292 Moran’s I 0.195 0.180 0.004 0.006 [0.0001] [0.0001] [0.316] [0.244]
Note: Standard errors in parenthesis, *p<0.1, **p<0.05, ***p<0.01 4 The test is performed using queen-contiguity based spatial weights.
The four specifications provide consistent results in terms of slope direction and significance of coefficients to a large extent. The overall effect of PM2.5 on COVID-19 mortality is positive and statistically significant in all models.
In model 2, the regional fixed effects are
significant. They indicate that other things being equal, the number of deaths in municipalities in Lombardy, Emilia Romagna and Piemonte has been systematically higher compared to base category5 and in municipalities in Veneto
has been systematically lower. The significance of the coefficients for Emilia Romagna and
Piemonte, however, drops after including the random effects in the model. Since the first three models are nested into model 4 it is also possible to compare the models in terms of AIC. Model 4 performs substantially better than the other three. In general, the inclusion of RE in models 3 and 4 leads to a decrease in the value of the AIC.
In models 1 and 2 the residuals appear spatially autocorrelated, as the null hypothesis of no spatial autocorrelation is rejected in both cases (p<0.001). The introduction of the LLS random effects appears to solve the issue of autocorrelation.
sample is much higher. In addition, the average PM concentration is also higher (20 µg/m³ in our sample against 8.4 µg/m³ in the US sample).
Among the other covariates, we observe no effect related to population density or the presence of agricultural and industrial activities in the municipality. Likewise there is no
evidence suggesting an effect of temperature or humidity on COVID-19 deaths. We observe, instead, higher mortality in municipalities with high shares of the population aged 65 or more and low ratios of female-to-male population. We finally performed a sensitivity analysis to test the robustness of the results with respect to the choice of the dependent variable. Existing evidence (Dominici et al., 2003; Pascal et al., 2014; Samet et al., 2000; Yin et al., 2017) associates fine PM to severe cardiovascular and respiratory diseases and mortality. In Europen cities, in particular, an estimated increase in the number of daily deaths of 0.7% is associated to an increase of 10 µg/m3 of PM10 (Katsouyanni et al.,
2001). This evidence suggests that long term PM exposure may have had an overall effect In each of the four specifications presented,
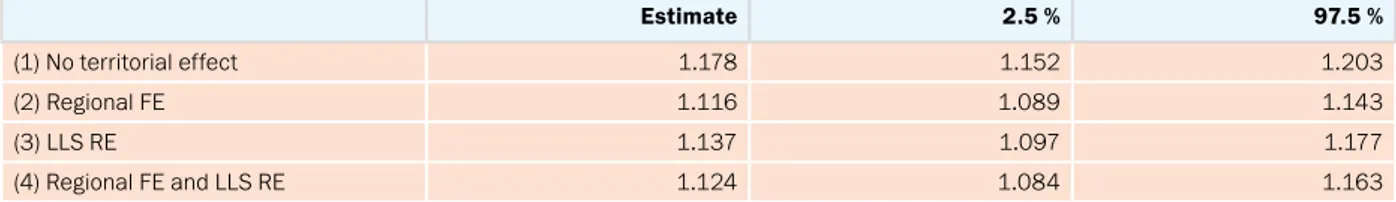
the coefficient related to PM2.5 is always of the expected direction and statistically different from zero, confirming the research hypothesis. Precisely and consistently with previous results for the original SARS-Coronavirus during the 2003 outbreak (Cui et al., 2003), an increase in air pollution exposure is associated with increased mortality for COVID-19. Table 3 reports the point estimates and the 95% confidence interval for the Incidence Rate Ratios (IRR). According to our estimates, the increase in COVID-19 mortality due to a one unit increase in PM2.5 concentration varies between 17.8% (model 1 – highest rate) and 11.6% (model 2 – lowest rate). The 95% confidence interval for the point estimate in model 4 is 8.4%-16.3%. This is in line with the empirical evidence on the association between pollution and mortality in other countries. For the US, it is estimated that the unit increase in PM concentration is associated with an increase in the mortality rate of just 15% (Wu et al., 2020). In that work, however, a total number of 7054 deaths across 3080 counties is considered, in contrast to the more than 30000 deaths in 2500 municipalities in our sample, implying that the mortality rate in our
04
Discussion
Estimate 2.5 % 97.5 % (1) No territorial effect 1.178 1.152 1.203 (2) Regional FE 1.116 1.089 1.143 (3) LLS RE 1.137 1.097 1.177 (4) Regional FE and LLS RE 1.124 1.084 1.163on deaths even before the outbreak in the sample municipalities, making it more difficult to isolate the real effect on COVID-19 deaths. We thus run the same regressions in Table 2 using the total number of deaths in the same observation period of 2019 as the dependent variable to understand whether the effect of fine PM on mortality has been more severe
during the pandemic. We find no evidence of an effect of PM2.5 on total deaths for 2019 in the sample municipalities, as the estimated coefficient is negative and not significantly different from zero. We conclude that the effect of PM exposure on the mortality rate is closely connected to the outbreak.
between PM2.5 concentration and COVID-19 mortality, consistent with the results found in previous literature for the 2003 SARS outbreak. The cross-sectional nature of the dataset and the use of geographically aggregated information in the epidemiological model does not allow concluding a causal effect exists. However, the evidence in the paper shows that the relationship between PM and COVID-19 deaths goes far beyond a simple geographical correlation, and further research is needed to explore the causal effect more in deep. Italy is among the countries most severely
affected by the new coronavirus, with more than 200 thousands confirmed cases and more than 30 thousands deaths. Yet, the spatial distribution of confirmed cases and deaths suggest that the effects of the viral infection spreading largely vary across the regions of the countries but also within regions. In this work, we examined the role of ambient PM in explaining the spatial variation in deaths that occurred during the outbreak. The results in the paper suggest a positive relationship
05
References
ARPA Lombardia. (2020). Analisi preliminare della qualità dell ’ aria in Lombardia durante l ’ emergenza COVID -19. https://www.arpalombardia.it/Pages/ Qualità-dell’aria-durante-l’emergenza-Covid-19,-l’analisi-di-Arpa-Lombardia-.aspx
Becattini, G. (2002). From Marshall’s to the Italian “industrial districts”. A brief critical reconstruction. Contributions to Economics, 83–106. https://doi. org/10.1007/978-3-642-50007-7_6
Becchetti, L., Conzo, G., Conzo, P., & Salustri, F. (2020). Understanding the heterogeneity of adverse COVID-19 outcomes : the role of poor quality of air and lockdown decisions. 1–24.
Cakmak, S., Hebbern, C., Pinault, L., Lavigne, E., Vanos, J., Crouse, D. L., & Tjepkema, M. (2018). Associations between long-term PM2.5 and ozone exposure and mortality in the Canadian Census Health and Environment Cohort (CANCHEC), by spatial synoptic classification zone. Environment International, 111(May 2017), 200–211. https://doi. org/10.1016/j.envint.2017.11.030
Ciencewicki, J., & Jaspers, I. (2007). Air
pollution and respiratory viral infection. In Inhalation Toxicology (Vol. 19, Issue 14, pp. 1135–1146). https://doi.org/10.1080/08958370701665434
Ciminelli, G., & Garcia-mandicó, S. (2020).
COVID-19 in Italy : an Analysis of Death Registry Data COVID-19 in Italy : an Analysis of Death Registry Data •. April.
Conticini, E., Frediani, B., & Caro, D. (2020).
Can atmospheric pollution be considered a co-factor in extremely high level of SARS-CoV-2 lethality in Northern Italy? Environmental Pollution, xxxx, 114465. https://doi.org/10.1016/j.
envpol.2020.114465
Cui, Y., Zhang, Z.-F., Froines, J., Zhao, J., Wang, H., Yu, S.-Z., & Detels, R. (2003). Air pollution and case fatality of SARS in the People’s Republic of China: an ecologic study. Environmental Health, 2(1), 1–5. https://doi.org/10.1186/1476-069x-2-15
Dominici, F., McDermott, A., Zeger, S. L., & Samet, J. M. (2003). Airborne particulate matter and mortality: Timescale effects in four US cities. American Journal of Epidemiology, 157(12), 1055– 1065. https://doi.org/10.1093/aje/kwg087
European Environmental Agency. (2019).
Air quality in Europe — 2019 report — EEA Report No 10/2019 (Issue 10). https://doi. org/10.2800/822355
Istituto Superiore di Sanità. (2020).
Characteristics of COVID-19 patients dying in Italy Report based on available data on March 20 th , 2020. 4–8.
Jeong, S.-C., Cho, Y., Song, M.-K., Lee, E., & Ryu, J.-C. (2017). Epidermal growth factor receptor (EGFR)-MAPK-nuclear factor(NF)-κB-IL8: A possible mechanism of particulate matter(PM) 2.5-induced lung toxicity. Environmental Toxicology, 32(5), 1628– 1636. https://doi.org/10.1002/tox.22390
Katsouyanni, K., Touloumi, G., Samoli, E., Gryparis, A., Le Tertre, A., Monopolis, Y., Rossi, G., Zmirou, D., Ballester, F., Boumghar, A., Anderson, H. R., Wojtyniak, B., Paldy, A., Braunstein, R., Pekkanen, J., Schindler, C., & Schwartz, J. (2001). Confounding and effect modification in the short-term effects of ambient particles on total mortality: Results from 29 European cities within the APHEA2 project. Epidemiology, 12(5), 521–531. https://doi. org/10.1097/00001648-200109000-00011
Ma, Y., Zhao, Y., Liu, J., He, X., Wang, B., Fu, S., Yan, J., Niu, J., Zhou, J., & Luo, B. (2020). Science of the Total Environment Effects of temperature variation and humidity on the death of COVID-19 in Wuhan , China. Science of the Total Environment, 724, 138226. https://doi.org/10.1016/j.
scitotenv.2020.138226
McGuinn, L. A., Ward-Caviness, C., Neas, L. M., Schneider, A., Di, Q., Chudnovsky, A., Schwartz, J., Koutrakis, P., Russell, A. G., Garcia, V., Kraus, W. E., Hauser, E. R., Cascio, W., Diaz-Sanchez, D., & Devlin, R. B. (2017).
Fine particulate matter and cardiovascular disease: Comparison of assessment methods for long-term exposure. Environmental Research, 159(July), 16– 23. https://doi.org/10.1016/j.envres.2017.07.041
Moran, P. A. P. (1950). Notes on Continuous Stochastic Phenomena. Biometrika, 37, 17–23. http://www.jstor.org/discover/10.2307/2332142 ?uid=3738296&uid=2134&uid=2&uid=70&uid =4&sid=21103298783497
Odone, A., Delmonte, D., Scognamiglio, T., & Signorelli, C. (2020). COVID-19 deaths in Lombardy, Italy: data in context. The Lancet Public Health, 2667(20), 30099. https://doi. org/10.1016/S2468-2667(20)30099-2
Pascal, M., Falq, G., Wagner, V., Chatignoux, E., Corso, M., Blanchard, M., Host, S., Pascal, L., & Larrieu, S. (2014). Short-term impacts of particulate matter (PM10, PM10-2.5, PM2.5) on mortality in nine French cities. Atmospheric Environment, 95, 175–184. https://doi.
org/10.1016/j.atmosenv.2014.06.030
Samet, J. M., Dominici, F., Curriero, F. C., Coursac, I. M. S., & Zeger, S. L. (2000). Fine particulate air pollution and mortality in 20 US Cities, 1987-1994. New England Journal of Medicine, 343(24), 1742–1749. https://doi. org/10.1056/NEJM200104193441614
Sedlmaier, N., Hoppenheidt, K., Krist, H., Lehmann, S., Lang, H., & Büttner, M. (2009).
Generation of avian influenza virus (AIV) contaminated fecal fine particulate matter (PM2.5): Genome and infectivity detection and calculation of immission. Veterinary Microbiology, 139(1–2), 156–164. https://doi. org/10.1016/j.vetmic.2009.05.005
Setti, L., Passarini, F., de Gennaro, G., Di Gilio, A., Palmisani, J., Buono, P., Fornari, F., Grazia Perrone, M., Piazzalunga, A., Pierluigi, B., Rizzo, E., & Miani, A. (2020). Evaluation of the potential relationship between Particulate Matter (PM) pollution and COVID-19 infection spread in Italy. SIMA Position Paper. http:// www.simaonlus.it/wpsima/wp-content/ uploads/2020/03/COVID_19_position-paper_ ENG.pdf
Shi, Y., Wang, Y., Shao, C., Huang, J., Gan, J., Huang, X., Bucci, E., Piacentini, M., Ippolito, G., & Melino, G. (2020). COVID-19 infection: the perspectives on immune responses. Cell Death & Differentiation. https://doi.org/10.1038/ s41418-020-0530-3
Wu, X., Nethery, R. C., Sabath, B. M., Braun, D., & Dominici, F. (2020). Exposure to air pollution and COVID-19 mortality in the United States. MedRxiv, 2020.04.05.20054502. https://doi. org/10.1101/2020.04.05.20054502
Yin, P., Brauer, M., Cohen, A., Burnett, R. T., Liu, J., Liu, Y., Liang, R., Wang, W., Qi, J., Wang, L., & Zhou, M. (2017). Long-term fine particulate matter exposure and nonaccidental and cause-specific mortality in a large national cohort of Chinese men. Environmental Health Perspectives, 125(11), 117002-1-117002– 117011. https://doi.org/10.1289/EHP1673
Appendix
Table 4– Estimation results for the placebo regression, dependent variable: total number of deaths during the period Jan1st-April
4th 2019, , municipalities in Northern Italy (N=2499)
(1)
No territorial effect (2)Regional FE. (3)LLS RE (4)Regional FE. And LLS RE
PM2.5 -0.00* -0.00* -0.00 -0.00 (0.00) (0.00) (0.008) (0.010) PopD -0.00** -0.00** -0.00 -0.00 (0.00) (0.00) (0.00) (0.00) Agriland 0.06** 0.04 0.04 0.03 (0.03) (0.03) (0.03) (0.03) Indland -0.30*** -0.32*** -0.26** -0.28** (0.11) (0.11) (0.11) (0.11) Temp 0.00 -0.03*** -0.01 -0.03*** (0.01) (0.01) (0.01) (0.01) Hum -0.01 0.03** 0.00 0.03** (0.01) (0.01) (0.01) (0.01) Ratiofemale 0.17 0.14 0.17 0.15 (0.14) (0.14) (0.14) (0.14) Share65 0.06*** 0.06*** 0.06*** 0.06*** (0.00) (0.00) (0.00) (0.00) Lombardia 0.09*** 0.08*** (0.03) (0.03) Emilia Romagna 0.07*** 0.06** (0.03) (0.03) Piemonte 0.11*** 0.10*** (0.03) (0.03) Veneto 0.01 -0.00 (0.03) (0.03) Intercept -7.11*** -6.96*** -7.09*** -6.98*** (0.16) (0.16) (0.16) (0.17)