World energy consumption and resources:
an outlook for the rest of the century
Gian Paolo Beretta
Dipartimento di Ingegneria Meccanica, Università di Brescia,
via Branze 38, 25123 Brescia, Italy E-mail: [email protected]
Abstract: Historical data on world energy consumption are discussed with
reference to current data on energy resources and general correlations between per capita energy consumption in different countries and their level of social and economic development. A balanced scenario for the energy needs and primary resources consumption mix of the rest of the century is proposed and compared with proved and presumed primary energy reserves. The corresponding carbon dioxide production scenario is compared with global natural carbon exchanges and inventory. Complexity and actual dimensions of the global energy problem are emphasised, to note that out-of-context local energy policies are hardly effective.
Keywords: energy scenario for the 21st century; world energy consumption;
energy reserves; greenhouse gases due to energy consumption.
Reference to this paper should be made as follows: Beretta, G.P. (2007)
‘World energy consumption and resources: an outlook for the rest of the century’, Int. J. Environmental Technology and Management, Vol. 7, Nos. 1/2, pp.99–112.
Biographical notes: Gian Paolo Beretta graduated in 1979 at the Politecnico
of Milano, Italy in Nuclear Engineering and got his PhD in 1981 at the Massachusetts Institute of Technology where he has been Assistant Professor of Mechanical Engineering between 1981 and 1986. Since 1994 he is Full Professor of Thermal Sciences at the University of Brescia, Italy. He has authored over 100 scientific publications in Thermodynamics, Physics, Heat transfer, Fluid mechanics and Energy, some of which co-authored with professors Mario Silvestri and Elias Gyftopoulos, two distinguished energy experts. He is co-author of the reference textbook “Thermodynamics: Foundations and Applications”, Dover Inc. 2005.
1 Introduction
In an uncertain geopolitical situation that will require increasing wisdom, farsightedness and coordination by politicians and decision makers of the entire world, it is extremely important to maintain in mind a balanced outlook of the world energy panorama.
In this paper we briefly review the history of anthropic energy consumption, as related also to other indicators of social and economic development. Data are taken from most credited sources; concepts, perspectives and analyses are gathered from scientific
level scenario studies (see the list of references), with some corrections and choices of which we take responsibility.
Based on current estimates of natural energy resources, we discuss a plausible scenario for the rest of the century, that takes into account key factors such as population growth and social and technological change in developed and developing regions of the globe. In addition, we compare the resulting anthropic non-renewable production of greenhouse gases with the magnitude of natural carbon dioxide exchanges and reserves.
2 Global energy consumption
Global energy consumption has about doubled in the last three decades of the past century. In 2004, about 77.8% of the primary energy consumption is from fossile fuels (32.8% oil, 21.1% natural gas, 24.1% coal), 5.4% from nuclear fuels, 16.5% from renewable resources, of which the main one is hydroelectric, 5.5%, whereas the remaining 11% consists of non commercial biomasses, such as wood, hay, and other types of fodder, that in rural-economies still constitute the main resource.
These ‘rural’ biomasses (mainly fodder) are usually ignored by statistical reviews of energy consumption proposed by oil companies, but for a correct global perspective they ought to be considered, because at least two thirds of human kind still lives in rural and artisanship economies not too different from the European Middle Age (Silvestri, 1988). For example, in the USA in 1850 two thirds of the mechanical energy was obtained from horses, and in 1925 horses were still 30 million.
To fix ideas, the amount of energy currently consumed everyday by human kind corresponds to the heating value of 100 large oil tankers. Not accounting for the 1.2 Gtoe/yr of ‘rural biomasses’,1 the fraction of energy demand covered by fossil fuels in
2004 appears to be 87.7%, a percentage often cited by various sources. Direct solar energy usage is about 11 Mtoe (millions, not billions of toe), less than 0.1% of the global consumption.
Before broadening the temporal perspective, we discuss current consumption vs. population in different regions of our planet. Main data are taken from BP-Amoco (2005), IEA (2002) and WEC (2000).
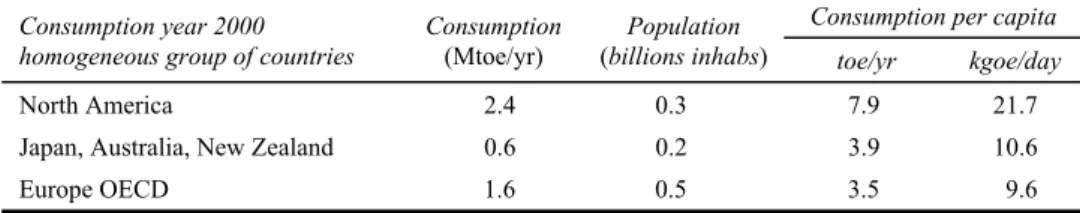
In Table 1 nations are grouped by type of economy, level of industrial development and energy per-capita consumption intensity. Large differences between groups of nations are due to several factors.
Table 1 World energy consumption, population and energy intensity in year 2000 (from BP-Amoco (2005) and Sheffield (1998)), by homogeneous groups of nations with similar type of economy and levels of industrial development and energy intensity
Consumption per capita Consumption year 2000
homogeneous group of countries
Consumption (Mtoe/yr)
Population
(billions inhabs) toe/yr kgoe/day
North America 2.4 0.3 7.9 21.7
Japan, Australia, New Zealand 0.6 0.2 3.9 10.6
Table 1 World energy consumption, population and energy intensity in year 2000 (from BP-Amoco (2005) and Sheffield (1998)), by homogeneous groups of nations with similar type of economy and levels of industrial development and energy intensity (continued)
Consumption per capita Consumption year 2000
homogeneous group of countries
Consumption (Mtoe/yr)
Population
(billions inhabs) toe/yr kgtoe/day
Ex URSS and Central-East Europe 1.3 0.4 3.1 8.4
Latin America 0.8 0.5 1.5 4.1 Middle East 0.5 0.4 1.3 3.6 East Asia 0.6 0.5 1.1 3.1 China 1.4 1.4 1.0 2.6 Africa 0.4 0.7 0.6 1.6 South Asia 0.6 1.4 0.4 1.2 Total globe 10.3 6.2 1.7 0.6 3 Geoclimatic factors
Among such factors are, for example, diverse geographic and climatic conditions. A rigid clima requires intense residential heating; low population density implies transportation needs over long distances; high humidity levels in hot seasons call for intense building and vehicle air conditioning.
Another factor is technical-economical-organisational efficiency in energy resource management, that depends on the type of internal political-economical system. For example, the burocratic mentality that dominates or has dominated in collectivised economies such as exURSS and China, where everything is subjected to meticolous central planning, is a cause of dissipation, even when technological level and social liveliness are high.
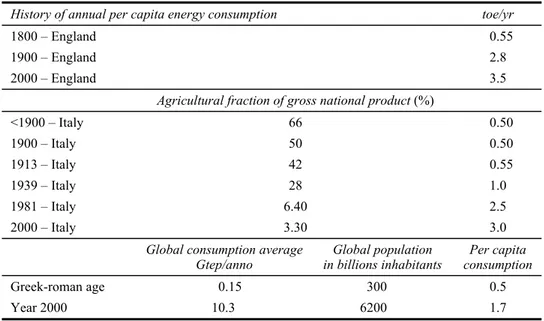
However, the most important factor that determines per capita consumption is the level of social development and industrialisation. Table 2 shows the historical trend. In the last two millennia, global consumption experienced a 70-fold increase, population a 20-fold increase, and per capita consumption little more than a 3-fold increase (from 0.5 toe/yr to 1.7 toe/yr). The transition from rural biomasses to fossil fuels has accompanied and allowed development and industrialisation in selected regions of the globe and has determined profound changes in the quality of human life.
Table 2 Historical evolution of per capita energy consumption
History of annual per capita energy consumption toe/yr
Food for survival (3000 kcal/day) 0.11
After discovery of fire (500,000 years ago) 0.22
Neolithic age, bronze age, iron age 0.45
Table 2 Historical evolution of per capita energy consumption (continued)
History of annual per capita energy consumption toe/yr
1800 – England 0.55
1900 – England 2.8
2000 – England 3.5
Agricultural fraction of gross national product (%)
<1900 – Italy 66 0.50 1900 – Italy 50 0.50 1913 – Italy 42 0.55 1939 – Italy 28 1.0 1981 – Italy 6.40 2.5 2000 – Italy 3.30 3.0
Global consumption average
Gtep/anno in billions inhabitants Global population consumption Per capita
Greek-roman age 0.15 300 0.5
Year 2000 10.3 6200 1.7
4 Technological factors
In each historical period, increases in energy demand have always gone together with improvement in energy efficiency. Technological and scientific advances have determined and are continuing to determine impressive and regular improvements in the efficiency of energy conversion devices.
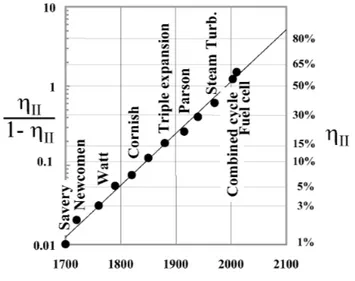
It is a process that follows closely the typical logistic law of human learning, as shown by Figure 1 where we graph the regular growth of the thermodynamic efficiency of energy conversion equipment during the last 300 years. The first steam engines for water extraction from coal mines at the dawn of the industrial revolution were <1% efficient. Today’s combined cycle and fuel cell power plants reach 55–60% net efficiencies. The logistic feature of this regular improvement, shown by the linear growth of the logarithm of ηII/(1 – ηII) where ηII is the so-called second-law
thermodynamic efficiency (Gyftopoulos and Beretta, 2005), indicates with some confidence that scientific learning and technological progress will continue, and by the end of the century will bring second-law thermodynamic efficiency of energy conversion devices to about 80%.
From the analysis of past consumptions, we observe the rapid increase occurred during the last century and can compute the overall past consumption of fossil fuels. In order to estimate the consumption in the current century, we must first estimate population growth.
Figure 1 Regular growth of the second-law thermodynamic efficiency (ηII, right) of energy
conversion equipment during the last 300 years. The linear ’logistic’ growth of the logarithm of ηII/(1 – ηII) (left) is typical of many learning processes and takes
into account the typical saturation of all learning curves. The datum for fuel cells is currently hypothetical
5 Demographic factors
Clearly, there is no room on our planet for an indefinite population growth. All credited studies agree with the estimate that a sustainable future requires that population stabilises at about twice the current population and that this will be achieved around the end of this century. But demographic growth rates will vary from region to region of the globe (Sheffield, 1998; Duncan, 2001). To proceed, we adopt estimates based on the (certainly questionable) assumption that the decrease in birth rates experienced in developed countries can be extrapolated also to countries with entirely different cultures.
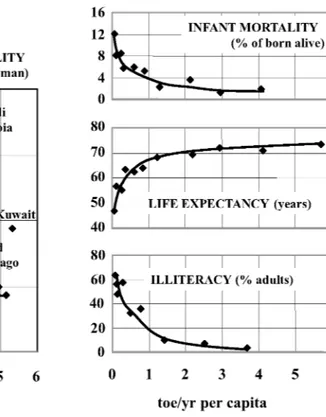
The graphs in Figure 2 highlight the strong inverse correlation that exists between per capita energy consumption and key factors for demographic growth, such as fertility, infant mortality and life expectancy. Indeed, the use of energy allows improvements in living standards, access to medical care, use of contraception, a longer life expectancy, social services that diffuse alphabetisation and access to information, work opportunities for women, lesser need to have a numerous family with enough workpower to sustain the unproductive members (children and elders). Per capita energy consumption is at the same time an indicator and an instrument of socioeconomic development.
Nations with high living standards have little or no demographic growth. Underdeveloped nations have high growth rates, in some instances doubling the population in 25 years. An important threshold appears to be that of one toe/yr per capita. Social conditions improve, life expectancy reaches 70 years, fertility and demographics growth slow down.
Figure 2 Correlations between different socioeconomic level indicators and per capita
energy consumption
Source: Sheffield (1998)
6 A scenario for the 21st century
On the foregoing grounds, Figure 3 shows on the right the population growth expected, overall and for each of the ten groups of nations already considered. In this century the overall population will grow from 6 billion to 11 billion people. Stabilisation for underdeveloped countries will occur with delay with respect to developing and developed countries. Africa and South Asia, that now account for one third of human kind, at the end of the century will account for half. People from North America, Japan, Australia, New Zealand, Ex URSS and Europe, will go from today’s 22% to just 13%.
Together with social and economic development, also technological development will continue to improve efficiency, not only of energy conversion devices but of the entire chain from energy resource extraction to end energy use. By the end of the century the overall energy efficiency is expected to double, so that current living standards in industrialised countries that today require 3 toe/yr per capita will be maintained by consuming only 1.5 toe/yr per capita.
Figure 3 shows (left) the expected reduction in per-capita energy consumption in each of the ten groups of nations (Grübler et al., 1996). It will decrease in industrialised countries as a result of increases in efficiency. It will increase in developing countries to enable the process of industrialisation. Overall, it will decrease from the current 1.7–1.4 toe/yr per capita.
Figure 3 Estimated scenario of population growth for the 21st century (right) and per capita
consumption (left) expected for each of ten groups of nations subdivided by type of economy and levels of industrial development and energy intensity
The product of the two factors represented by these two graphs, per capita consumption and population, provides for each group of nations the scenario of energy consumption for the rest of the century. The result is shown in Figure 4, added to the graph of historical data.
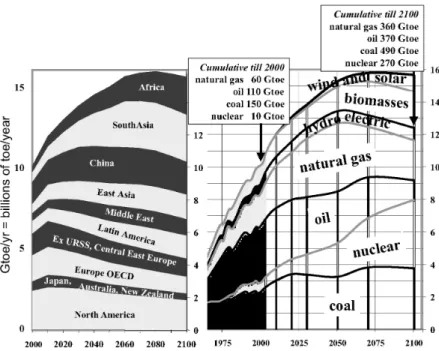
Figure 4 Estimated scenario of global energy consumption for the 21st century.
Left: with subdivision by groups of nations with similar types of economy and levels of industrial development. Right: with a plausible subdivision by primary energy resources
Overall energy consumption, today at 11 Gtoe/yr, will keep increasing rapidly for a few decades, but eventually it will stabilise towards the end of the century at a level of 16 Gtoe/yr. The contribution of today’s most industrialised nations will continue to increase for a decade or two, but soon it will start decreasing to reach about 75% of their current consumption by 2100. The incidence of these nations, however, will drastically fall from 60% to 28% of the overall consumption. Instead, the incidence of Africa and South Asia will triple, from 10% to 33%.
Several detailed outlooks have been studied (see the references) for the many possible ways in which the mix of energy resources that humanity will consume to satisfy the energy needs could evolve. Diverse scenarios depend on many variables, principally the geopolitical context that will develop. Here, we present in Figure 4 one that we consider well balanced, although somewhat optimistic for some aspects.
Coal consumption will continue to grow, because it will be used with increasingly clean technologies. Nuclear energy will recover its rapid growth in 20–25 years, based on the (optimistic) assumptions that the geopolitical context will settle and stabilise so as to allow control of military risks and that technology will resolve the open issues on environmental safety and radioactive waste management and disposal. Oil consumption will peak about 2020 and then start to decline, due to the progressive depletion of wells. Natural gas and ‘clean’ coal will take up oil’s role and will become the predominant resources of the century. Still uncertain is the role that non-conventional oil resources such as tar sands, bituminous shales, heavy crudes and methane hydrates will have. Renewable energy consumption will increase thanks to increasing exploitation of hydroelectric resources, increasing ’sustainable’ uses of biomasses and solid wastes. Direct solar power, wind power, tidal power and other renewables will certainly increase, but most likely will keep their current marginal role for the entire century, although the learning curve of these technologies will also climb up and hopefully contribute more significantly.
Given the scenario in Figure 4, we can compute the cumulative energy consumption. The Figure shows the cumulative figure from 1850 to 2100. These can be compared with current estimates of reserves.
7 Reserves
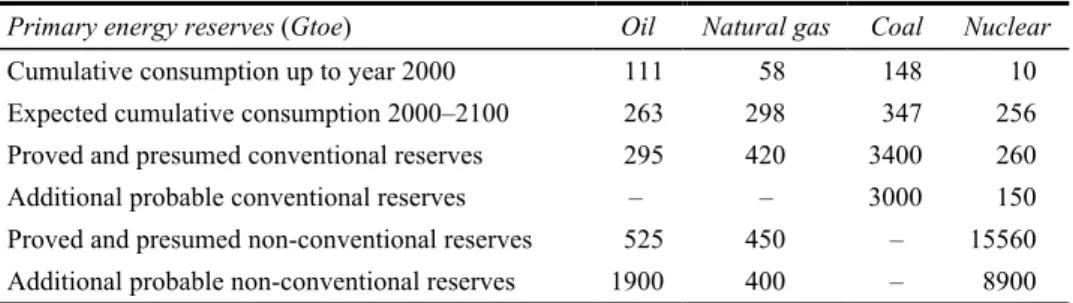
The data in Table 3, from Grübler et al. (1996) propose such a comparison between: cumulative global consumption until 2000 (it is what we have consumed so far); estimated cumulative global consumption until 2100 on the basis of the scenario shown in Figure 4; conventional proved and presumed resources. Data on reserves are from published estimates by oil companies, and should be verified by some independent international organism. Indeed, as suggested by Campbell and Laharrère (1998), numbers may have been deliberately inflated by oil companies to access, according to OPEC rules, larger market shares. On the other hand, we must observe that most of the deep ocean basin is still unexplored.
In any case, we see that only coal reserves are abundant, whereas the proved and presumed reserves of oil and natural gas would be practically used up to meet this century’s energy needs, and the same is true for nuclear reserves, if we continue to use them by means of non-breeding fission technology.
Table 3 Comparison between past and estimated cumulative global consumption for the 21st century (from Figure 4) and proved and presumed reserves of non-renewable conventional resources. Also shown are estimates of proved and presumed reserves of non-conventional resources, as well as probable additional resources
Primary energy reserves (Gtoe) Oil Natural gas Coal Nuclear
Cumulative consumption up to year 2000 111 58 148 10 Expected cumulative consumption 2000–2100 263 298 347 256 Proved and presumed conventional reserves 295 420 3400 260 Additional probable conventional reserves – – 3000 150 Proved and presumed non-conventional reserves 525 450 – 15560 Additional probable non-conventional reserves 1900 400 – 8900 On the other hand, if we include also resources that with today’s methods are considered non conventional and not potentially recoverable, but that presumably could be developed on the time scale we are considering, such as breeding fission technology and the Thorium cycle, and the use of tar sands, bituminous shales, heavy crudes and methane hydrates, then we see that reserves will last well beyond the current century.
We must consider, however, that extraction and transportation costs, also in terms of energy consumption, not only of non-conventional resources, but also of oil, natural gas and coal from depleted wells and mines, may be so high that the net recoverable energy may be much lower than the overall heating value of the reserve. Therefore, when the net recoverable energy becomes negative, the well or mine loses its value and should be closed (this often does not happen due to wrong economic subsidies) in the hope that future lower consumption extraction and transportation technologies may restore some net energy value.
Nuclear fusion is not considered here as an option due to the difficulties it encounters in laboratories and to the decades that will separate physics laboratory demonstrations from engineered industrial installations. In any case, reserves for fusion would be plentiful.
Collecting various kinds of renewable energies, that are naturally abundant but extremely diluted on the globe surface and unavailable on a continuous basis, often imposes significant expense of material and energy, and thus (indirectly) it is a much less sustainable enterprise than often announced by superficial analyses. This is the main reason why many important renewable resources have so far been scarcely competitive and are bound to maintain a quantitatively marginal role in the global context, at least until other non-renewable but more sustainable primary resources can be exploited.
Primary resources are not scarce enough to hinder the expected social and economic development in all regions of the globe. However, the fact that in the long-term the second most abundant resource (after breeding nuclear fission) is coal, raises the environmental concerns that derive from the hypothesis that the amounts of greenhouse gases introduced in the atmosphere by anthropic exploitation of fossil fuels may have a significant influence on the thermal balance of our planet, affecting clima and melting polar ice-caps.
8 Greenhouse gases
Indeed, for every toe of energy released by combustion of fossil fuels, we introduce in the atmosphere a few tons of carbon dioxide. Complex life-cycle assessments taking into account the current mix of exploitation technologies have been made to quantify this impact correctly for each type of primary energy. For the purposes of our discussion, it suffices to say that the resulting figures are not too far from those obtained by simple stoichiometry, that is, for each toe of energy released by combustion of wood, coal, oil, and natural gas we produce, respectively, 4.6, 4, 3.1, and 2.3 ton of CO2.
It is clear that among fossil fuels coal has a greenhouse-gas impact almost double of that of natural gas.
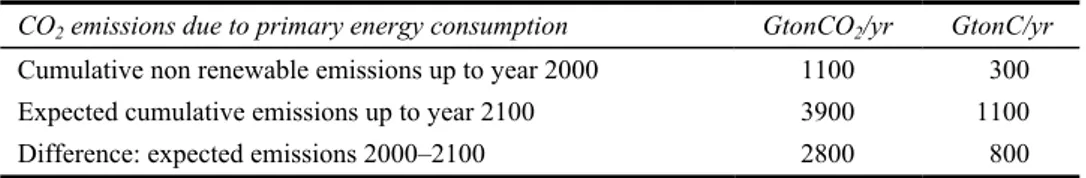
Applying the specific emission figures just cited to the scenario of consumption and mix of resources presented in Figure 4 (see also Nakicenovic, 1996; Grübler and Nakicenovic, 1996), we obtain the scenario of CO2 emissions in Table 4: up to
year 2000, oil 110 Gtoe × 3.1 GtonCO2/Gtoe, natural gas 60 × 2.3, coal 150 × 4, total
1100 GtonCO2, that is 300 GtonC; up to year 2100, oil 370 × 3.1, natural gas 360 × 2.3,
coal 490 × 4, total 3900 GtonCO2, that is 1100 GtonC.
Table 4 Estimated scenario of CO2 emissions due to primary energy consumption in the past
and in the 21st century according to the scenario in Figure 4, with subdivision by energy resource
CO2 emissions due to primary energy consumption GtonCO2/yr GtonC/yr
Cumulative non renewable emissions up to year 2000 1100 300 Expected cumulative emissions up to year 2100 3900 1100 Difference: expected emissions 2000–2100 2800 800 If in the last century human kind has liberated 1100 Gton of CO2 to meet its energy
needs. In the current century it will liberate another 2800 Gton, or even more if the assumption of an acceptable resolution of the problems of nuclear power should turn out to be too optimistic. Of course, in addition to these energy related greenhouse gas emissions, other increasing emissions will be due to many human activities such as the production of cement, losses of natural gas from pipelines, release of biogas from solid waste landfills, release of chlorofluorocarbons and other direct and indirect greenhouse gases, including hydrogen.
To analyse under a correct perspective the expected energy-related emissions of greenhouse gases, we must consider the amounts of carbon, C, instead of CO2, because
carbon dioxide is only one of the intermediate compounds in the complex natural mechanisms that regulate the cycle of organic matter on the globe. In terms of carbon, energy-consumption-related anthropic emissions are about 7 Gton/yr. Past emissions add up to 300 Gton/yr. At the end of the century emissions will add up to 1100 Gton, in the assumed scenario, with additional emissions of 800 Gton in 100 years, 8 Gton/yr. These enormous amounts of carbon that human kind is liberating in a couple of centuries have been laboriously accumulated by Nature for millions of years by the extremely slow conversion in fossil fuels of less than a millionth of the biomass produced by solar energy through photosynthesis on the earth and in the oceans.
Table 5 shows comparisons between natural carbon exchanges and reservoirs, and estimated energy-related anthropic emissions for the rest of the century. The atmosphere exchanges 60 Gton/yr of carbon with earth biomasses and 90 Gton/yr with superficial oceanic layers. The anthropic contribution of about 8 Gton/yr is therefore 5% of the natural yearly exchanges. About 100 Gton/yr is the exchange between deep and intermediate ocean layers and the superficial layer. This is important because large amounts of carbon dioxide, which is heavier than water and air, accumulates and stratifies in ocean depths, where convective flows are normally inhibited, although deep underwater volcanic activity may cause CO2 to surface again. The athmosphere contains
750 Gton of carbon, superficial ocean layers 1000 Gton, land 2200 Gton, deep and intermediate ocean layers 38000 Gton. Cumulative energy-related anthropic emissions according to our scenario will amount to 800 Gton for the entire century, <2% of the overall natural carbon inventory.
Table 5 Comparisons between natural carbon dioxide exchanges and reserves on the earth surface, and estimated energy-related anthropic emissions for the rest of the century
Natural carbon yearly exchanges GtonC/yr
Expected average yearly anthropic emissions 2000–2100 8 Natural exchange between emerged surfaces and atmosphere 60 Natural exchange between oceans surfaces and atmosphere 90 Natural exchange between intermediate and surface ocean layers 100 Ratio of estimated average yearly anthropic emission 2000–2100 to natural yearly
exchanges between Earth surfaces and atmosphere = 8/(60 + 90) ~ 5%.
Natural carbon reserves GtonC
Expected cumulative anthropic emissions 2000–2100 800
CO2 in the atmosphere 750
CO2 in oceans surface layers 1000
CO2 in emerged surfaces 2200
CO2 in intermediate and deep ocean layers 38000
Ratio of estimated cumulative anthropic emission 2000–2100 to natural carbon reserves = 800/(38000 + 2200 + 1000) ~ 2%.
We conclude that primary energy consumption liberates to the atmosphere important amounts of carbon which, however, are introduced into a natural complex of exchanges, equilibria and accumulation that are at least 20 times larger. Moreover, carbon dioxide concentration in the atmosphere is affected by a variety of natural mechanisms and phenomena. It is a fact that during the last century it has increased by 22% from 295 ppm to 360 ppm, and that in the same lapse of time the average earth temperature has increased by 0.6°C, causing important climatic changes. However, we still lack scientific evidence that anthropic emissions should be held responsible for the climatic changes. Rather, the doubt remains that the enormous costs and efforts that are necessary to obtain significant reductions in greenhouse gas emissions could be easily rendered vain by small fluctuations in one the broad natural mechanisms that regulate the thermal equilibrium of our planet.
9 Geopolitical factors
Oil and natural gas resources are not scarce, at least for the current century. However, their uneven geographical distribution has great importance in determining the different possible scenarios of socioeconomic development. In addition to its abundance, another advantage of coal is that it is more evenly distributed.
Nations that are currently under rapid development will require increasing amounts of energy for the next decades until their demographic growth will stop. Paradoxically, this will happen earlier if their per-capita energy consumption will increase faster. The future depends on the geopolitical scenario that human kind will be able to configure to face these problems. The faster the transitions to high per-capita energy consumption economies throughout the globe, the lesser the overall primary energy consumption and final population.
A desirable but perhaps utopian scenario is that of a global free market in a safe and pacific international clima, in which every nation takes charge of these problems according to its possibilities, and safety and stability are sufficiently guaranteed to allow advanced nations to invest in the infrastructures of developing nations, to speed up the developing process. In this pacific context nuclear energy could thrive, with both economic and environmental advantages, and with the possibility to gradually switch to breeding nuclear technologies for long-term sustainability.
On the other hand, knowing human nature we can hardly exclude that an opposite scenario will emerge, maintaining the current features of antagonism, egoism and fanaticism, as novel configurations determine new economic coalitions and new hostility. The hope is that the awareness on environmental problems that spread throughout the globe in the last couple of decades, could contribute to converge as soon as possible to a global equilibrium and a global energy policy, to assure stability and minimise waste of energy resources.
10 Conclusions
The future of energy is uncertain mostly because it depends on the geopolitical scenario that nations will be able to give themselves and, therefore, on the scenario of socioeconomic and demographic growth that will follow, especially for economies currently under development and underdeveloped. It will depend on the strength with which human kind will be able to face together its common challenges.
The uncertainty is not about scarcity of energy reserves, rather it is about which mix of resources will be used to meet the demand. It is not about the estimate of the demand of non-renewable resources for the 21st century, which will hardly be less than 1000 Gtoe, three time the amount consumed in the past century, rather it is about the contribution that not so much renewables but today’s non-conventional resources and technologies will be able to give. There is little doubt that most of the energy demand of the rest of the century will continue to be met by consuming oil, natural gas, coal and nuclear energy, only with relative proportions different from the current. It is therefore important that politicians, policy makers, media and ultimately people at large be critical against misinformation and false promises of easy solutions of the complex energy problem.
It is important to invest in basic and applied scientific research without prejudice. It would be a mistake to force research to focus only on new technologies, on non-conventional resources, on renewable energies or, even worse, on illusory and misleading ideas such as the synthetic production of hydrogen fuel from water to serve as an energy carrier alternative to electricity (on hydrogen see Eaves and Eaves, 2004; Shinnar, 2003). We must invest also in research on mature technologies because small improvements in processing of large amounts of energy determine large primary energy savings. Extraction, exploitation, transportation and conversion of fossil fuels can be improved both in terms of efficiency and environmental sustainability. Advancing nuclear energy technologies and related safety and radioactive waste problems is a priority for all nations, regardless of whether or not they have decided to ban nuclear reactors in their territory. Electricity is a mature, efficient, safe and easily distributed energy carrier, readily and efficiently convertible into end uses such as mechanical work and lighting. As free market rules favour distributed production of electricity, improvements in current long distance and capillary distribution grids are needed to maintain stability and reliability. If zero emission transportation in cities is to be pursued, rather than wasting resources to chase the mirage of an unsustainable hydrogen economy, we should finance research on lighter and faster rechargeable batteries for hybrid and electric cars, which at comparable performance are safer, cleaner, lighter, economical and intrinsically much more energy efficient on a well-to-wheel basis than hydrogen fuel-cell cars (even in an unlikely all renewable scenario, Eaves and Eaves, 2004).
Fossil and nuclear fuels are ‘assets’ of energy that Nature preserved for millions of years and that only since the end of the 18th Century human kind is amply and rapidly ‘investing’ to startup and maintain its industrialisation and its rapid and steady development of new technologies in all fields. If such assets of natural resources will not be used wisely, also to develop in time the energy technologies that are needed to substitute depleting resources with others, the industrial age will be remembered as just a fleeting flash in the history of mankind.
References
BP-Amoco (2005) BP Statistical Review of World Energy, www.bp.com/centres/energy/.
Campbell, C.J. and Laharrère, J.H. (1998) ‘The end of cheap oil’, Scientific American, March, pp.78–83.
Duncan, R.C. (2001) ‘World energy production, population growth, and the road to the olduvai gorge’, Population and Environment, Vol. 22, p.5.
Eaves, S. and Eaves, J. (2004) ‘A cost comparison of fuel-cell and battery electric vehicles’, Journal of Power Sources, Vol. 130, p.208.
Grübler, A. and Nakicenovic, N. (1996) ‘Decarbonizing the global energy system’, Technological Forecasting and Social Change, Vol. 53, p.97.
Grübler, A., Jefferson, M. and Nakicenovic, N. (1996) ‘Global energy perspectives: a summary of the joint study by the IIASA and WEC’, Technological Forecasting and Social Change, Vol. 51, p.237.
Gyftopoulos, E.P. and Beretta, G.P. (2005) Thermodynamics. Foundations and Applications, Dover Publications, New York.
Nakicenovic, N. (1996) ‘Decarbonization: doing more with less’, Technological Forecasting and Social Change, Vol. 51, p.1.
Sheffield, J. (1998) ‘World population growth and the role of annual energy use per capita’, Technological Forecasting and Social Change, Vol. 59, p.55.
Shinnar, R. (2003) ‘The hydrogen economy, fuel cells, and electric cars’, Technology in Society, Vol. 25, p.455.
Silvestri, M. (1988) Il Futuro dell’Energia, Bollati Boringhieri, Milano, Italy.
World Energy Council (WEC) (2000) Energy for Tomorrow’s World: Acting Now, http://www.worldenergy.org/.
Note