https://doi.org/10.5194/essd-12-1985-2020 © Author(s) 2020. This work is distributed under the Creative Commons Attribution 4.0 License.
Dissolved inorganic nutrients in the
western Mediterranean Sea (2004–2017)
Malek Belgacem1,2, Jacopo Chiggiato1, Mireno Borghini1, Bruno Pavoni2, Gabriella Cerrati3, Francesco Acri1, Stefano Cozzi4, Alberto Ribotti5, Marta Álvarez6, Siv K. Lauvset7, and
Katrin Schroeder1
1ISMAR-CNR, Arsenale Tesa 104, Castello 2737/F, 30122 Venice, Italy 2Dipartimento di Scienze Ambientali Informatica e Statistica,
Università Ca’ Foscari Venezia, Campus Scientifico, Mestre, 30170 Venice, Italy
3Department of Sustainability, St Teresa Marine Environment Research Centre, ENEA,
19032 Pozzuolo di Lerici (SP), Italy
4ISMAR-CNR, Area Science Park, Basovizza, 34149 Trieste, Italy 5IAS-CNR, Loc. Sa Mardini snc, Torregrande, 9170 Oristano, Italy
6Instituto Español de Oceanografía, IEO, A Coruña, Spain
7NORCE Norwegian Research Centre, Bjerknes Centre for Climate Research, Bergen, Norway
Correspondence:Jacopo Chiggiato ([email protected])
Received: 5 August 2019 – Discussion started: 3 September 2019 Revised: 16 June 2020 – Accepted: 19 July 2020 – Published: 4 September 2020
Abstract. Long-term time series are a fundamental prerequisite to understanding and detecting climate shifts
and trends. Understanding the complex interplay of changing ocean variables and the biological implication for marine ecosystems requires extensive data collection for monitoring, hypothesis testing, and validation of modelling products. In marginal seas, such as the Mediterranean Sea, there are still monitoring gaps, both in time and in space. To contribute to filling these gaps, an extensive dataset of dissolved inorganic nutrient observations (nitrate, phosphate, and silicate) was collected between 2004 and 2017 in the western Mediterranean Sea and subjected to rigorous quality control techniques to provide to the scientific community a publicly available, long-term, quality-controlled, internally consistent biogeochemical data product. The data product includes 870 stations of dissolved inorganic nutrients, including temperature and salinity, sampled during 24 cruises. Details of the quality control (primary and secondary quality control) applied are reported. The data are available in PANGAEA (https://doi.org/10.1594/PANGAEA.904172, Belgacem et al., 2019).
Data coverage and parameter measured
Available at: https://doi.org/10.1594/PANGAEA.904172
Coverage: 44◦N–35◦S, 6◦W–14◦E
Location name: western Mediterranean Sea
Date/time start: May 2004
Date/time end: November 2017
1 Introduction
Dissolved inorganic nutrients play a crucial role in marine ecosystem functioning. They serve as regulators of ocean biological productivity and are trace elements for biogeo-chemical cycling as well as for natural and anthropogenic sources and transport processes (Béthoux, 1989; Béthoux et al., 1992). They are also non-conservative tracers, since their distribution varies according to both biological (such as primary production and respiration) and physical (such as convection, advection, mixing, and diffusion) processes. Very schematically, inorganic nutrients are continuously
con-sumed by phytoplankton (due to primary production) at the sea surface and regenerated in the mesopelagic layer by bac-teria and animals (due to respiration). Moreover, the sinking of organic matter and its decomposition increase the nutrient concentrations in the intermediate- and deep-water masses over time. To identify the limiting factors for biological pro-duction in the oceans, we need to understand the underly-ing chemical constraints and especially the macro- and mi-cronutrient spatial and temporal variations. Dissolved inor-ganic nutrients may be used as tracers of water masses like salinity and temperature to assess mixing processes and to understand the biogeochemical circumstances of their forma-tion regions. Understanding the complex interplay of chang-ing ocean variables and the biological implication for marine ecosystems is a difficult task and requires not only modelling but also extensive data collection for monitoring, hypothesis testing, and validation. Monitoring gaps still remain in both time and space, especially for marginal seas such as the Arc-tic Ocean or the Mediterranean Sea.
The Mediterranean Sea has been identified as a region sig-nificantly affected by ongoing climatic changes, like warm-ing and a decrease in precipitation (Giorgi, 2006). In addi-tion, it is a region particularly valuable for climate change research because it behaves like a miniature ocean (Béthoux et al., 1999) with a well-defined overturning circulation char-acterized by spatial and temporal scales that are much shorter than for the global ocean, with a turnover of only several decades. Being an intercontinental sea and subjected to more terrestrial nutrient inputs (river runoff, submarine groundwa-ter discharge) and atmospheric deposition, the Medigroundwa-terranean Sea has a nitrate to phosphate N : P ratio that is anomalously high compared to the “classical” world oceans Redfield ra-tio, indicating a general P-limitation regime, which becomes stronger along a west-to-east gradient. The Mediterranean Sea is therefore a potential model for studying global pat-terns that will be experienced in the next decades worldwide, not only regarding ocean circulation but also the marine biota (Lejeusne et al., 2010). Several environmental variables can act as stressors for marine ecosystems, by which climatically driven ecosystem disturbances are generated (Boyd, 2011). These changes affect, among other things, the distribution of biogeochemical elements (including inorganic nutrients) and the functioning of the biological pump and CO2regulation.
Within this context, the aim of this paper is to compile an extensive dataset of dissolved inorganic nutrient obser-vations (nitrate, phosphate, and silicate) collected between 2004 and 2017 in the western Mediterranean Sea (WMED); to describe the quality control techniques; and to provide the scientific community with a publicly available, long-term, quality controlled, and internally consistent biogeo-chemical data product, contributing to previously published Mediterranean Sea datasets like MEDAR/MEDATLAS (time period 1908–1999; Fichaut et al., 2003) and the Mediter-ranean Sea – Eutrophication and Ocean Acidification ag-gregated datasets v2018 (time period 1911–2017) provided
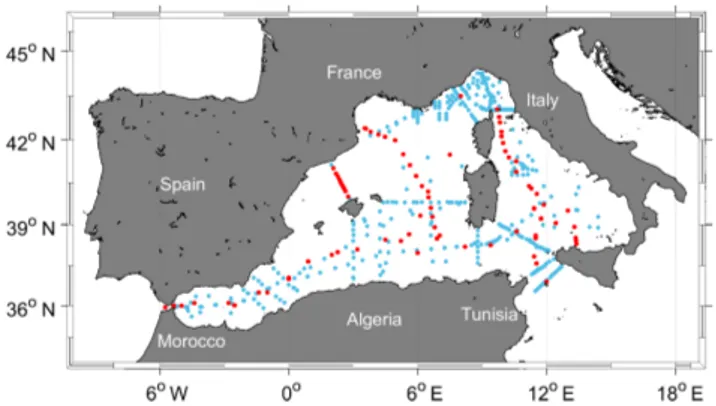
Figure 1.Map of the western Mediterranean Sea showing the bio-geochemical stations (in blue) and the five reference cruise stations (in red).
by EMODnet Chemistry (Giorgetti al., 2018) available at https://www.seadatanet.org/Products/Aggregated-datasets (last access: March 2020).
2 Dissolved inorganic nutrient data collection
2.1 The CNR dissolved inorganic nutrient data in the WMED
Long-term time series, such as the OceanSITES global time series (http://www.oceansites.org, last access: May 2019), are a fundamental prerequisite to understanding and detect-ing climate shifts and trends. However, biogeochemical time series are still limited to the northern part of the western Mediterranean Sea (MOOSE network; Coppola et al., 2019). Yet, inorganic nutrients in the Mediterranean Sea have re-ceived more attention in recent years, and various datasets have been compiled to understand their unique characteris-tics such as the one built by the PERSEUS project consor-tium (Policy-oriented marine environmental research in the southern European seas”, EU FP7 project, grant agreement (GA) no. 287600), which included 100 cruises collected dur-ing the project’s lifetime, in addition to those from other projects like SESAME (EU FP7 project, GA no. GOCE-036949) and data products such as MEDAR/MEDATLAS. In addition to that, the data assembly system EMODnet Chemistry, a leading infrastructure, is supported by the pan-European Directorate-General for Maritime Affairs and Fish-eries (DG MARE; Martín Míguez et al., 2019; Tintoré et al., 2019).
The dataset presented here consists of 24 oceanographic cruises (Fig. 1, Table 1a and b) conducted in the WMED on board research vessels run by the Italian National Research Council (CNR) and the NATO Science and Technology Or-ganization (STO) Centre for Maritime Research and Experi-mentation (CMRE). All cruises were merged into a unified dataset with 870 nutrient stations and ∼ 9666 data points over a period of 13 years (2004–2017). The overall spatial
T ab le 1. (a) Cruise summary table and parameters listed with number of stations and samples. Cruises were identified with an ID number and expedition code (EXPOCODE of format AABBYYYYMMDD – AA: country code; BB: ship code; YYYY : year; MM: month; DD: day indicati v e of cruise starting day). (b) Data sources and links to the reports (last access: June 2020). (a) Cruise Common name EXPO CODE Research v essel Date start and end Stations Samples Samples Samples Maxi mum bottom Chief scientist(s) ID no. (R V) nitrate phosphate silicate depth (m) 1 TRENDS2004 and MEDGOOS8le g2 48UR20040526 Ur ania 26 May–14 Jun 2004 36 255 253 255 3499 Mireno Bor ghini 2 MEDGOOS9 48UR 20041006 Ur ania 6–25 Oct 2004 68 627 626 627 3610 Mireno Bor ghini 3 MEDOCC05 and MFSTEP2 48UR 20050412 Ur ania 12 Apr –16 May 2005 68 828 828 828 3598 Mireno Bor ghini 4 MEDGOOS10 48UR 20050529 Ur ania 29 May–10 Jun 2005 36 577 577 577 3505 Angelo Perilli 5 MEDGOOS11 48UR 20051116 Ur ania 16 No v–3 Dec 2005 14 143 143 143 2810 Angelo Perilli, Mireno Bor ghini, Massimiliano Dibitetto 6 MEDOCC06 48U R20060608 Ur ania 8 Jun–3 Jul 2006 66 787 785 787 2881 Mireno Bor ghini 11 a SIREN A06 06A420060720 Alliance 20 Jul–6 Aug 2006 35 208 208 209 1854 Jef f Haun 8 MEDGOOS13 and MEDBIO06 48UR 20060928 Ur ania 28 Sep–8 No v 2006 37 519 520 520 2862 Alberto Ribotti 9 MEDOCC07 48UR20071005 Ur ania 5–29 Oct 2007 71 977 977 979 3497 Angelo Perilli, Mireno Bor ghini, Alberto Ribotti 10 SESAMEIT4 48UR20080318 Ur ania 18 Mar –7 Apr 2008 11 164 164 164 2882 Chiara Santinelli 11 SESAMEIT5 48UR20080905 Ur ania 5–16 Sep 2008 12 74 74 74 536 Stef ania Sparnocchia, Gian Pietro Gasparini, Mireno Bor ghini 12 MEDCO08 48UR20081103 Ur ania 3–24 No v 2008 24 342 350 348 2880 Alberto Ribotti 13 TYRRMOUNTS 48UR20090508 Ur ania 8 May–3 Jun 2009 41 430 441 440 2559 Gian Pietro Gasparini 14 BIOFUN010 48UR20100430 Ur ania 30 Apr –17 May 2010 26 405 405 405 3540 Elena Mannini, Stef ano Aliani 15 VENUS1 48UR20100731 Ur ania 31 Jul–25 Aug 2010 32 431 432 428 3544 Gian Pietro Gasparini, Mireno Bor ghini 16 BONSIC2010 48UR20101123 Ur ania 23 No v–9 Dec 2010 18 144 143 143 3540 Alberto Ribotti 17 EUR OFLEET11 48UR20110421 Ur ania 21 Apr –8 May 2011 28 277 275 277 3540 Gian Pietro Gasparini, Mireno Bor ghini 18 BONIF A CIO2011 48UR20111109 Ur ania 9–23 No v 2011 13 180 180 181 3541 Alberto Ribotti, Gina La Spada, Mireno Bor ghini 19 T OSCA2011 48MG20111210 Maria Gr azia 10–20 Dec 2011 21 310 310 309 2728 Mireno Bor ghini 20 ICHNUSSA12 48UR20120111 Ur ania 11–27 Jan 2012 21 353 352 323 3551 Alberto Ribotti 21 EUR OFLEET2012 48UR20121108 Ur ania 8–26 No v 2012 53 429 434 434 2633 Mireno Bor ghini 22 ICHNUSSA13 48UR20131015 Ur ania 15–29 Oct 2013 37 405 404 405 3540 Alberto Ribotti 23 OCEANCER T AIN15 48QL20150804 Minerva Uno 4–29 Aug 2015 71 531 531 531 3513 Jacopo Chiggiato 24 ICHNUSSA17 and INFRA OCE17 48QL20171023 Minerva Uno 23 Oct–28 No v 2017 31 251 254 254 3536 Alberto Ribotti, Stef ania Sparnocchia, Mireno Bor ghini
T ab le 1. Continued. (b) Cruise Expedition original name PI(s ) or chief scientist(s) Specific link a (last access: June 2020) ID no. 1 TRENDS2004 and MEDGOOS8le g2 Mi reno Bor ghini https://isramar .ocean.or g.il/perseus_data/CruiseInfo.aspx?criuseid=5821 https://isramar .ocean.or g.il/perseus_data/CruiseInfo.aspx?criuseid=4935 2 MEDGOOS9 M ireno Bor ghini Report submission in progress https://isramar .ocean.or g.il/perseus_data/CruiseInfo.aspx?criuseid=5823 https://doi.or g/10.17882/70340 3 MEDOCC05 and MFSTEP2 M ireno Bor ghini http://ricerca.ismar .cnr .it/CR UISE_REPOR TS/2005/URANIA_MEDOCC05.pdf https://isramar .ocean.or g.il/perseus_data/CruiseInfo.aspx?criuseid=4936 4 MEDGOOS10 Ange lo Perilli http://www .seaforecast.cnr .it/it/observ ation_it.htm https://doi.or g/10.17882/70340 5 MEDGOOS11 Ange lo Perilli, Mireno Bor ghini, Mas-similiano Dibitetto http://ricerca.ismar .cnr .it/CR UISE_REPOR TS/2005/URANIA_MEDGOOS11_05_REP .pdf https://doi.or g/10.17882/70340 6 MEDOCC06 M ireno Bor ghini http://www .seaforecast.cnr .it/reports/Medocc06CR.pdf https://seadata.bsh.de/Cgi-csr/retrie v e_sdn2/vie wReport.pl?csrref=20106010 7 SIREN A06 Jef f Haun Report submission in progress 8 MEDGOOS13 and MEDBIO06 Albe rto Ribotti http://www .seaforecast.cnr .it/reports/Mebio06-Medg13_CR.pdf https://doi.or g/10.17882/70340 9 MEDOCC07 Ange lo Perilli, Mireno Bor ghini, Al-berto Ribotti http://www .seaforecast.cnr .it/reports/Medocc07-MedCo07_Rapp.pdf https://isramar .ocean.or g.il/perseus_data/CruiseInfo.aspx?criuseid=5146 10 SESAMEIT4 Chi ara Santinelli https://isramar .ocean.or g.il/perseus_data/CruiseInfo.aspx?criuseid=5148 https://emodnet-chemistry .maris.nl/search/details.php?step=0012004~0022017~0153~057l04001~058tdin, ntra, phos, slca~00445~0056~00617~00734~0541&count=3592&page=1000&sort=0&header=no 11 SESAMEIT5 St ef ania Sparnocchia, Gian Pietro Gas-parini, Mireno Bor ghini https://isramar .ocean.or g.il/perseus_data/CruiseInfo.aspx?criuseid=5147 12 MEDCO08 Al berto Ribotti http://www .seaforecast.cnr .it/reports/MedCO08_Rapp.pdf 13 TYRRMOUNTS Gi an Pietro Gasparini Report submission in progress 14 BIOFUN010 El ena Mannini, Stef ano Aliani http://www .ismar .cnr .it/products/reports- campagne/2010-2019 15 VENUS1 Gi an Pietro Gasparini, Mireno Bor ghini Report submission in progress 16 BONSIC2010 Al berto Ribotti http://www .seaforecast.cnr .it/reports/Bonif acio2010Sic_Rapp.pdf 17 EUR OFLEET11 Gi an Pietro Gasparini, Mireno Bor ghini Report submission in progress 18 BONIF A CIO2011 Albe rto Ribotti, Gina La Spada, Mireno Bor ghini http://www .seaforecast.cnr .it/reports/Bonif acio2011_Rapp.pdf 19 T OSCA2011 M ireno Bor ghini Report submission in progress 20 ICHNUSSA12 Al berto Ribotti http://www .seaforecast.cnr .it/reports/Ichnussa2012_Rapp.pdf 21 EUR OFLEET2012 M ireno Bor ghini Report submission in progress 22 ICHNUSSA13 Al berto Ribotti http://www .seaforecast.cnr .it/reports/Ichnussa2013_Rapp.pdf 23 OCEANCER T AIN15 Ja copo Chiggiato https://doi.or g/10.1594/P ANGAEA.911046 24 ICHNUSSA17 and INFRA OCE17 Alber to Ribotti, Stef ania Sparnocchia, Mireno Bor ghini Report submission in progress a The specific links are subjectu7 to updates.
distribution of the stations covers the whole WMED, but the actual distribution strongly varies depending on the specific cruise and most of the data are collected along sections. At all stations, pressure, salinity, and temperature were measured with a CTD-rosette system consisting of a CTD SBE 911plus and a General Oceanics rosette with 24 Niskin bottles of 12 L capacity. Temperature measurements were performed with the SBE 3F thermometer with a resolution of 10−3 ◦C; con-ductivity measurements were performed with an SBE 4 sen-sor with a resolution of 3×10⁻⁴S m−1. The probes were cal-ibrated before and after each cruise. During all CNR cruises, redundant sensors were used for both temperature and salin-ity measurements.
Seawater samples for dissolved inorganic nutrient mea-surements were collected during the CTD upcast at standard depths (with slight modifications according to the depth at which the deep chlorophyll maximum was detected). The standard depths are usually 5, 25, 50, 75, 100, 200, 300, 400, 500, 750, 1000, 1250, 1500, 1750, 2000, 2250, 2500, 2750, and 3000 m. No filtration was employed; nutrient samples were immediately stored at −20◦C. Note that sample stor-age and freezing duration varied greatly from one cruise to another (Table 3 shows cruises where this exceeded 1 year).
2.2 Analytical methods for inorganic nutrients
For all cruises, nutrient determination (nitrate, orthosilicate, and orthophosphate) was carried out following standard col-orimetric methods of seawater analysis, defined by Grasshoff et al. (1999) and Hansen and Koroleff (1999). For inor-ganic phosphate, the method is based on the reaction of the ions with an acidified molybdate reagent to yield a phospho-molybdate heteropoly acid, which is then reduced to a blue-coloured compound (absorbance measured at 880 nm). Inor-ganic nitrate is reduced (with cadmium granules) to nitrite that reacts with an aromatic amine, leading to the final for-mation of the azo dye (measured at 550 nm). Then, the nitrite that is separately determined must be subtracted from the to-tal amount measured to get the nitrate concentration only. The determination of dissolved silicon is based on the for-mation of a yellow silicomolybdic acid reduced with ascor-bic acid to a blue-coloured complex (measured at 820 nm).
Nutrient analysis was performed in three laboratories. From 2004 to 2013, all cruises nutrients were analysed by ENEA, while for those of 2015 (cruise no. 23) and 2017 (cruise no. 24), nutrient concentrations were analysed by ISMAR-CNR (ISMAR is the Institute of Marine Sciences). Referring to Table S1 in the Supplement, four different mod-els of autoanalyser were used. Measurements from the auto-analyser were reported in micromoles per litre. Inorganic nu-trient concentrations were converted to the standard unit of micromoles per kilogram, using sample salinity from CTD and a mean laboratory analytical temperature of 20◦C. Data from nutrient analysis were then merged with ancillary CTD bottle data. T ab le 2. Cruise summary table of the reference cruise collection used in the secondary quality control, colle cted from 2001 to 2016. Common name EXPOCODE Date st art and end Stations Nitrate Phosphate Silicate Source Nutrient PI(s) Chief scientist(s) sample sample sam ple M51/2 06MT20011018 18 Oct–11 No v 2001 6 79 79 82 GLOD APv2 Bernd Schneider W olfg ang Roether TRANSMED_LEGII 48UR20070528 28 May–12 Jun 2007 4 78 77 78 CARIMED (not yet av ailable) Stef ano Cozzi, V aleria Ibello Maurizo Azzaro M84/3 06MT20110405 5–28 Apr 2011 20 339 343 – GLOD APv2 Giuseppe Ci vitarese T oste T anhua HO TMIX 29AH20140426 26 Apr –31 May 2014 18 144 140 144 CARIMED (not yet av ailable) Xosé Anton Álv arez-Salg ado Ja vier Ariste gui T AlPr o-2016 29AJ20160818 18–28 Aug 2016 42 293 293 293 MedSHIP programme Laurent Coppola Loïc Jullion, Katrin Schroeder
Figure 2.Overview of the reference cruise spatial coverage and vertical distributions of the inorganic nutrients. (a) Geographical distribution
map; (b) vertical profiles of nitrate (µmol kg−1); (c) vertical profiles of phosphate (µmol kg−1); (d) vertical profiles of silicate (µmol kg−1).
2.3 Reference inorganic nutrient data
In addition to the data collected during the above-mentioned cruises and in order to perform the secondary quality control (described below), we identified five reference cruises (Ta-ble 2), based on their spatial and temporal distribution and the reliability of the measurements (see Fig. 2 and Table S3 and Fig. S1 in the Supplement). Cruises 06MT20110405 and 06MT20011018 are the only two Mediterranean cruises in-cluded in the publicly available Global Ocean Data Anal-ysis Project version 2 (GLODAPv2; Olsen et al., 2016). These cruises, conducted on board the R/V Meteor, pro-vide a reliable reference because nutrient analysis strictly followed the recommendation of the World Ocean Circula-tion Experiment (WOCE) and the GO-SHIP protocols (Hy-des et al., 2010; Tanhua et al., 2013). Cruises 29AH20140426 and 48UR20070528 are to be included in the CARIMED data product (personal communication by Marta Álvarez, in preparation but not yet available) and have undergone rigorous quality control following GLODAP routines. Fi-nally, 29AJ20160818 was carried out in the framework of the MedSHIP programme (Schroeder et al., 2015), and its data are available at https://doi.org/10.1594/PANGAEA.902293 (Tanhua, 2019).
3 Quality assurance and quality control methods
Combining inorganic nutrient data from different sources, collected by different operators, stored for different amounts of time, and analysed by multiple laboratories is not a straightforward task. This is widely recognized in the biogeo-chemical oceanographic community. Since the 1990s, sev-eral studies and programmes (e.g. World Ocean Database, World Ocean Atlas, WOCE) have been devoted to facilitating the exchange of oceanographic data and developing quality control procedures to compile databases by the estimation of systematic errors (Gouretski and Jancke, 2000) to increase inter-comparability, generate consistent datasets, and accu-rately observe long-term change.
An example of a first quality control procedure is the use of reference materials that are available for salinity (IAPSO – International Association for Physical Sciences of the Ocean, salinity standard by OSIL – Ocean Scien-tific International Limited) and temperature (SPRT – stan-dard platinum resistance thermometer). As for the inorganic carbon, total alkalinity (Dickson et al., 2003), and inorganic nutrients (Aoyama et al., 2016), certified reference materi-als (CRMs) have been recently made applicable for oceano-graphic cruises. However, since CRMs are not always avail-able or used for biogeochemical oceanographic data, Lau-vset and Tanhua (2015) developed a secondary quality con-trol tool to identify biases in deep data. The method suggests
adjustments that reduce cruise-to-cruise biases, increase ac-curacy, and allow for the inter-comparison between data from various sources. This approach, based on a crossover and in-version method (Gouretski and Jancke, 2000; Johnson et al., 2001), was used to generate the CARbon dioxide IN the At-lantic Ocean (CARINA; see Hoppema et al., 2009), GLO-DAPv2.2019 (Olsen et al., 2019), and PACIFICA (Suzuki et al., 2013) data products.
3.1 Primary quality control
Each individual cruise was first subjected to a primary qual-ity control (first QC) that included a check of apparent and extreme outliers in CTD salinity, nitrate, phosphate, and sili-cate. Each parameter included a quality control flag, follow-ing standard WOCE flags (Table 3). The surface, intermedi-ate, and deep layer were evaluated separately because nutri-ent observations evolve differnutri-ently in each layer. The coef-ficient of variation (CV, defined as standard deviation over mean) was computed for each depth layer. Coefficients of variation in the surface layer (0–250 db) were high (nitrate CV = 1.16, phosphate CV = 1.005, silicate CV = 0.75) due to air–sea interaction (Muniz et al., 2001) occurring in this layer rendering it difficult to flag. These influences are of re-duced importance in the intermediate layer (250–1000 db; ni-trate CV = 0.23, phosphate CV = 0.31, silicate CV = 0.24) and the deep layer (> 1000 db; nitrate CV = 0.15, phosphate CV = 0.22, silicate CV = 0.14), decreasing the total vari-ance. Flags in the upper and intermediate layer were thus set based on outliers within pressure ranges defined according to standard pressures (0–10, 10–30, 30–60, 60–80, 80–160, 160–260, 260–360, 360–460, 460–560, 560–1000 db).
Below 1000 db, flagging included an inspection of nitrate to phosphate (N : P) and nitrate to silicate (N : Si) ratios. The median and median absolute deviation (MAD) were com-puted by classes of pressure: we considered outliers to be any atypical observation and any value that departs from the median by more than three MADs in the different pressure ranges for each cruise.
An overview of the nutrient distribution is provided with scatter plots, showing also the flagged measurements (Fig. 3). Each measurement was flagged as 2 (“Accept-able/measured”) or flagged as 3 (“Questionable”); 4.1 % of nitrate data, 3.37 % of phosphate data, 3.16 % of silicate data, and 0.07 % of CTD salinity data were considered outliers and flagged as 3. As highlighted by Tanhua et al. (2010), the pri-mary QC can be subjective depending on the expertise of the person flagging the data, thus flagging could bring in some uncertainties.
In order to have a first assessment of the precision of each cruise set of measurements, the standard deviation of obser-vations deeper than 1000 db was calculated along with av-erages and standard deviations for each cruise and by sub-region to have an overview of nutrient content variability in the deep layer and of the observations’ spatial spread of
individual cruises (Table 4). Following the subdivision of Manca et al. (2004), the WMED has been divided into sub-regions (Fig. S2, Table S2) according to the general circu-lation patterns (details in Manca et al., 2004). Table 4 dis-plays the comparison of standard deviation of deep mea-surements for each cruise and within subregions. The over-all standard deviation between cruises in the deep layer var-ied between 0.51 and 1.41 µmol kg−1 for nitrate, between 0.1 and 1.64 µmol kg−1for silicate, and between 0.025 and 0.078 µmol kg−1 for phosphate. Regional standard devia-tion of nitrate measurements below 1000 db varied between 0.08 µmol kg−1in the Gulf of Lion (DF2) with cruise no. 9 and 1.6 µmol kg−1in the Balearic Sea (DS2) observations of cruise no. 14. The lowest phosphate regional standard devia-tion was 0.01 µmol kg−1found in the observations of cruise no. 9 in the Gulf of Lion (DF2), cruise no. 10 in the Balearic Sea (DS2) and Algerian West (DS3), cruise no. 14 and cruise no. 15 in the Tyrrhenian South (DT3), and cruise no. 18 in Algero-Provençal (DF1) and the Sardinia Channel (DI1), while the highest standard deviation was 0.1 µmol kg−1in the observations of cruise no. 12 in the Algerian West (DS3). As for silicate, the lowest standard deviation was 0.02 µmol kg−1 observed in cruise no. 9 measurements of the Gulf of Lion subregion (DF2) and the highest deep standard deviation was observed in cruise no. 6 in all its subregions together with cruise no. 5 measurements in the Tyrrhenian North (DT1) with a 1.83 µmol kg−1standard deviation.
Cruises no. 3, no. 6, and no. 9 had the largest spatial exten-sion (see right side of Fig. 9) with a high number of samples over more than seven subregions (Table 4); the geographi-cal variability in the distribution of dissolved inorganic nu-trients results thus in the largest standard deviations. Con-versely, cruises with smaller spatial coverages have lower standard deviations. Therefore, a relatively small spatial cov-erage and high standard deviation is considered as indicative of data with low precision (Olsen et al., 2016). This applies to cruises no. 1, no. 5, and no. 16. Despite the small spatial cov-erage, samples of nitrate and phosphate of cruise no. 5 have an overall standard deviation of 1.35 and 0.07 µmol kg−1, respectively, a high standard deviation was also pointed out in the regional standard deviation of deep measure-ments in the Tyrrhenian North (DT1) and South (DT3). Cruise no. 1, with few stations in the Tyrrhenian North (DT1) and South (DT3) subregions and 21 samples below 1000 db, has an overall standard deviation of 1.25 µmol kg−1 for nitrate, 0.06 µmol kg−1 for phosphate, and 1.64 µmol kg−1 for silicate. The regional standard deviation was relatively high for nitrate (0.51–1.32 µmol kg−1), phosphate (0.02– 0.065 µmol kg−1), and silicate (0.53–1.83 µmol kg−1). A comparison with the deviations from e.g. cruise no. 2, car-ried out in the same year and e.g. cruise no. 17 (with a sim-ilar cruise track) confirms the lower precision of the data of cruise no. 1. Similar considerations apply to the quality of nitrate samples (0.87–1.02 µmol kg−1) and silicate (0.87– 0.9 µmol kg−1) from cruise no. 16, covering a small area in
Table 3.WOCE flags used in the original data product and in the adjusted product.
WOCE flag value Interpretation in original dataset Interpretation in adjusted product
2 Acceptable/measured Adjusted and acceptable
3 Questionable/not used Adjusted and recommended questionable
9 Not measured/no data
Figure 3.Scatter plots of (a) phosphate vs. nitrate (µmol kg−1) and (b) silicate vs. nitrate (µmol kg−1). Data that have been flagged as questionable (flag 3) are in red; the colour bar indicates the pressure (dbar). The black lines represent the best linear fit between the two
parameters, and the corresponding equations and r2values are shown in each plot. Average resulting N : P ratio is 20.87; average resulting
N : Si ratio is 1.05 (whole depth).
the Tyrrhenian North (DT1) and South (DT3), compared to cruise no. 17, carried out in the same regions (right side of Fig. 9 and Table 4).
Deep silicate measurements of cruise no. 6 have twice the overall standard deviation of silicate data of cruise no. 8 from the same year. Adding to that, in the seven subregions, the regional standard deviation of deep silicate observations was the highest, between 1.04 and 2 µmol kg−1, which was rel-atively high compared to the surrounding cruises that have observations in the same subregions. This is again sugges-tive of limited precision. On the other hand, trying to ex-plain the source of relatively high standard deviations in spe-cific cruises is not always straightforward, as they could stem from a variety of sources, sampling, and conservation and analysis methods. The bottom water in the WMED exhibits a high nutrient content below 1000 db (Table 4), due to the longer residence time. Dividing the WMED into subregions has effectively removed the natural spatial change in nutri-ents, making the interpretation of the standard deviation a matter of the precision of the measurements only.
In Table 4, deep averages by subregions show that overall nutrient concentration fluctuated at around 7.4 ± 0.9 µmol kg−1 for nitrate, 0.3 ± 0.06 µmol kg−1 for phos-phate, and 7.7 ± 0.8 µmol kg−1for silicate; similar findings were reported by Manca et al. (2004). Comparing cruise av-erages in each region enabled the identification of “suspect”
cruises. Cruise no. 24 has the lowest deep average in ni-trate in the Algero-Provençal (DF1) and Tyrrhenian North (DT1) subregions and in the Sardinia Channel (DI1). Sili-cate of cruises no. 24 and no. 16 was very low compared to the overall regional average in the Liguro-Provençal (DF3) and Tyrrhenian South (DT3) subregions. The deep average of phosphate did not show any outlier cruises in all subre-gions. Different reasons could explain the low precision in the samples; freezing is one. Although it is a valid preser-vation method (Dore at al., 1996), the error is higher when samples are not analysed immediately (Segura-Noguera et al., 2011), so the storage time could be influential.
3.2 Secondary quality control – the crossover analysis
The method used to perform the secondary QC on the WMED dissolved inorganic nutrient dataset makes use of the quality-controlled reference data and the crossover analysis toolbox developed by Tanhua (2010) and Lauvset and Tan-hua (2015). The computational approach is based on com-paring the cruise dataset to a high-quality reference dataset to quantify biases, described in detail in Tanhua et al. (2010). Here, we summarize the technique with emphasis on in-organic nutrients. The first step consisted of selecting ref-erence data, as described in Sect. 2.3. The second step is the crossover analysis that was carried out using a
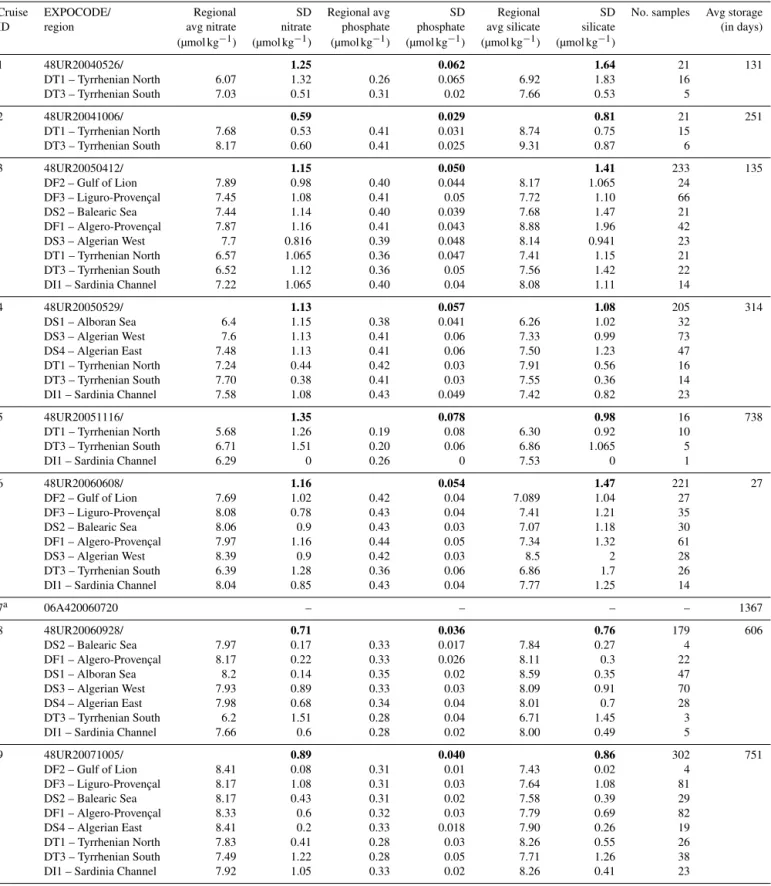
MAT-Table 4.Average and standard deviations of nitrate, phosphate, and silicate measurements by cruise and for each region with number of samples deeper than 1000 db included in the second QC. Average storage time is the minimum storage time defined as time difference between the cruise ending day and the first day of the laboratory analysis.
Cruise EXPOCODE/ Regional SD Regional avg SD Regional SD No. samples Avg storage ID region avg nitrate nitrate phosphate phosphate avg silicate silicate (in days)
(µmol kg−1) (µmol kg−1) (µmol kg−1) (µmol kg−1) (µmol kg−1) (µmol kg−1)
1 48UR20040526/ 1.25 0.062 1.64 21 131 DT1 – Tyrrhenian North 6.07 1.32 0.26 0.065 6.92 1.83 16 DT3 – Tyrrhenian South 7.03 0.51 0.31 0.02 7.66 0.53 5 2 48UR20041006/ 0.59 0.029 0.81 21 251 DT1 – Tyrrhenian North 7.68 0.53 0.41 0.031 8.74 0.75 15 DT3 – Tyrrhenian South 8.17 0.60 0.41 0.025 9.31 0.87 6 3 48UR20050412/ 1.15 0.050 1.41 233 135 DF2 – Gulf of Lion 7.89 0.98 0.40 0.044 8.17 1.065 24 DF3 – Liguro-Provençal 7.45 1.08 0.41 0.05 7.72 1.10 66 DS2 – Balearic Sea 7.44 1.14 0.40 0.039 7.68 1.47 21 DF1 – Algero-Provençal 7.87 1.16 0.41 0.043 8.88 1.96 42 DS3 – Algerian West 7.7 0.816 0.39 0.048 8.14 0.941 23 DT1 – Tyrrhenian North 6.57 1.065 0.36 0.047 7.41 1.15 21 DT3 – Tyrrhenian South 6.52 1.12 0.36 0.05 7.56 1.42 22
DI1 – Sardinia Channel 7.22 1.065 0.40 0.04 8.08 1.11 14
4 48UR20050529/ 1.13 0.057 1.08 205 314 DS1 – Alboran Sea 6.4 1.15 0.38 0.041 6.26 1.02 32 DS3 – Algerian West 7.6 1.13 0.41 0.06 7.33 0.99 73 DS4 – Algerian East 7.48 1.13 0.41 0.06 7.50 1.23 47 DT1 – Tyrrhenian North 7.24 0.44 0.42 0.03 7.91 0.56 16 DT3 – Tyrrhenian South 7.70 0.38 0.41 0.03 7.55 0.36 14
DI1 – Sardinia Channel 7.58 1.08 0.43 0.049 7.42 0.82 23
5 48UR20051116/ 1.35 0.078 0.98 16 738
DT1 – Tyrrhenian North 5.68 1.26 0.19 0.08 6.30 0.92 10
DT3 – Tyrrhenian South 6.71 1.51 0.20 0.06 6.86 1.065 5
DI1 – Sardinia Channel 6.29 0 0.26 0 7.53 0 1
6 48UR20060608/ 1.16 0.054 1.47 221 27 DF2 – Gulf of Lion 7.69 1.02 0.42 0.04 7.089 1.04 27 DF3 – Liguro-Provençal 8.08 0.78 0.43 0.04 7.41 1.21 35 DS2 – Balearic Sea 8.06 0.9 0.43 0.03 7.07 1.18 30 DF1 – Algero-Provençal 7.97 1.16 0.44 0.05 7.34 1.32 61 DS3 – Algerian West 8.39 0.9 0.42 0.03 8.5 2 28 DT3 – Tyrrhenian South 6.39 1.28 0.36 0.06 6.86 1.7 26
DI1 – Sardinia Channel 8.04 0.85 0.43 0.04 7.77 1.25 14
7a 06A420060720 – – – – 1367 8 48UR20060928/ 0.71 0.036 0.76 179 606 DS2 – Balearic Sea 7.97 0.17 0.33 0.017 7.84 0.27 4 DF1 – Algero-Provençal 8.17 0.22 0.33 0.026 8.11 0.3 22 DS1 – Alboran Sea 8.2 0.14 0.35 0.02 8.59 0.35 47 DS3 – Algerian West 7.93 0.89 0.33 0.03 8.09 0.91 70 DS4 – Algerian East 7.98 0.68 0.34 0.04 8.01 0.7 28 DT3 – Tyrrhenian South 6.2 1.51 0.28 0.04 6.71 1.45 3
DI1 – Sardinia Channel 7.66 0.6 0.28 0.02 8.00 0.49 5
9 48UR20071005/ 0.89 0.040 0.86 302 751 DF2 – Gulf of Lion 8.41 0.08 0.31 0.01 7.43 0.02 4 DF3 – Liguro-Provençal 8.17 1.08 0.31 0.03 7.64 1.08 81 DS2 – Balearic Sea 8.17 0.43 0.31 0.02 7.58 0.39 29 DF1 – Algero-Provençal 8.33 0.6 0.32 0.03 7.79 0.69 82 DS4 – Algerian East 8.41 0.2 0.33 0.018 7.90 0.26 19 DT1 – Tyrrhenian North 7.83 0.41 0.28 0.03 8.26 0.55 26 DT3 – Tyrrhenian South 7.49 1.22 0.28 0.05 7.71 1.26 38
Table 4.Continued.
Cruise EXPOCODE/ Regional SD Regional avg SD Regional SD No. samples Avg storage ID region avg nitrate nitrate phosphate phosphate avg silicate silicate (in days)
(µmol kg−1) (µmol kg−1) (µmol kg−1) (µmol kg−1) (µmol kg−1) (µmol kg−1)
10 48UR20080318/ 0.51 0.026 0.34 66 31 DF2 – Gulf of Lion 8.54 0.6 0.35 0.03 8.62 0.43 5 DS2 – Balearic Sea 9.12 0.18 0.38 0.01 8.40 0.21 9 DF1 – Algero-Provençal 9.02 0.36 0.38 0.03 8.65 0.25 15 DS3 – Algerian West 8.93 0.46 0.36 0.01 8.69 0.35 20 DS4 – Algerian East 8.43 0.25 0.38 0.02 8.32 0.22 10
DI1 – Sardinia Channel 7.62 0.6 0.34 0.03 8.49 0.36 3
11a 48UR20080905 – – – – 211 12 48UR20081103/ 1.11 0.077 0.10 110 536 DS1 – Alboran Sea 6.4 1.21 0.21 0.06 7.20 1.43 26 DS3 – Algerian West 7.58 0.9 0.27 0.1 7.89 0.9 30 DS4 – Algerian East 7.15 1.04 0.23 0.04 7.38 0.9 35 DT3 – Tyrrhenian South 7.44 0.5 0.22 0.05 8.28 0.4 10
DI1 – Sardinia Channel 7.40 1.23 0.17 0.04 8.09 0.45 9
13 48UR20090508/ 1.41 0.051 1.42 88 164
DT1 – Tyrrhenian North 5.95 1.55 0.24 0.05 6.28 1.58 46
DT3 – Tyrrhenian South 6.76 0.77 0.24 0.03 7.37 0.77 29
DI1 – Sardinia Channel 7.62 1.1 0.28 0.05 7.76 0.9 13
14 48UR20100430/ 1.06 0.036 1.03 159 213 DS2 – Balearic Sea 7.66 1.6 0.25 0.03 7.38 1.75 33 DF1 – Algero-Provençal 8.43 0.29 0.26 0.03 8.06 0.31 61 DS3 – Algerian West 8.5 0.14 0.26 0.03 8.25 0.3 26 DT1 – Tyrrhenian North 6.88 0.8 0.23 0.022 7.17 0.77 11 DT3 – Tyrrhenian South 6.38 1.35 0.22 0.01 6.76 1.56 7
DI1 – Sardinia Channel 7.71 0.87 0.23 0.02 7.80 0.74 21
15 48UR20100731/ 1.34 0.053 0.14 149 213 DS1 – Alboran Sea 7.30 1.18 0.29 0.05 7.21 1.11 25 DS3 – Algerian West 7.67 1.15 0.28 0.045 7.24 1.16 54 DS4 – Algerian East 7.38 0.89 0.29 0.03 7.00 0.78 29 DT1 – Tyrrhenian North 7.66 0.96 0.29 0.05 7.89 1.07 10 DT3 – Tyrrhenian South 5.4 0.67 0.22 0.01 5.52 1.56 30
DI1 – Sardinia Channel 4.92 0 0.20 0 5.55 0 1
16 48UR20101123/ 1.02 0.045 1.02 14 170 DT1 – Tyrrhenian North 6.34 0.87 0.27 0.02 6.12 0.87 8 DT3 – Tyrrhenian South 5.43 1.02 0.22 0.04 5.08 0.9 6 17 48UR20110421/ 0.62 0.029 0.52 56 160 DT1 – Tyrrhenian North 7.77 0.45 0.28 0.02 8.11 0.35 21 DT3 – Tyrrhenian South 7.76 0.7 0.28 0.03 8.017 0.6 35 18 48UR20111109/ 0.68 0.025 0.70 77 74 DF3 – Liguro-Provençal 6.68 0 0.33 0 6.26 0 1 DF1 – Algero-Provençal 8.17 0.5 0.32 0.01 8.16 0.66 43 DT1 – Tyrrhenian North 7.26 0.93 0.29 0.02 8.15 1.03 12 DT3 – Tyrrhenian South 7.61 0.37 0.30 0.02 8.18 0.35 11
DI1 – Sardinia Channel 7.64 0.45 0.29 0.01 8.08 0.41 10
19a 48MG20111210 – – – – 38
20 48UR20120111/ 0.97 0.051 0.26 152 317
DF1 – Algero-Provençal 8.45 0.49 0.31 0.039 7.91 0.53 23
DT1 – Tyrrhenian North 7.67 0.83 0.27 0.02 8.29 0.8 30
DT3 – Tyrrhenian South 7.65 1.06 0.31 0.06 8.03 1.26 69
DI1 – Sardinia Channel 7.65 0.96 0.31 0.03 7.86 0.78 30
21a 48UR20121108 – – – – 72 22 48UR20131015/ 1.03 0.043 0.79 98 76 DF1 – Algero-Provençal 8.54 0.64 0.33 0.02 7.96 0.38 36 DS4 – Algerian East 7.67 1.28 0.27 0.04 6.82 1.07 8 DT1 – Tyrrhenian North 6.47 0.83 0.24 0.025 7.12 0.84 10 DT3 – Tyrrhenian South 7.81 0.71 0.30 0.03 8.09 0.65 28
Table 4.Continued.
Cruise EXPOCODE/ Regional SD Regional avg SD Regional SD No. samples Avg storage ID region avg nitrate nitrate phosphate phosphate avg silicate silicate (in days)
(µmol kg−1) (µmol kg−1) (µmol kg−1) (µmol kg−1) (µmol kg−1) (µmol kg−1)
23 48QL20150804/ 0.84 0.038 0.85 94 30 DF3 – Liguro-Provençal 8.51 0.96 0.39 0.03 8.06 0.85 23 DS2 – Balearic Sea 7.75 0.66 0.36 0.02 7.86 0.81 20 DF1 – Algero-Provençal 7.9 0.59 0.37 0.03 8.34 0.68 23 DS3 – Algerian West 7.84 0.67 0.36 0.02 7.75 0.68 6 DT1 – Tyrrhenian North 7.92 0.61 0.37 0.02 8.75 0.4 8 DT3 – Tyrrhenian South 7.23 0.75 0.34 0.025 8.2 0.94 13
DI1 – Sardinia Channel 6.30 0 0.25 0 5.36 0 1
24 48QL20171023/ 0.68 0.055 1.24 55 30
DF3 – Liguro-Provençal 6.63 0.41 0.40 0.05 10.76 1.07 3
DF1 – Algero-Provençal 5.14 0.7 0.43 0.02 7.94 1.19 6
DT1 – Tyrrhenian North 4.98 0.58 0.36 0.02 8.10 0.87 9
DT3 – Tyrrhenian South 5.43 0.5 0.36 0.04 9.03 0.87 26
DI1 – Sardinia Channel 5.16 0.76 0.41 0.07 7.58 1.17 11
aCruise not included in the second QC (Sect. 4). In bold: the overall standard deviation by cruise; in normal font: regional standard deviation by cruise.
LAB toolbox (available online at https://cdiac.ess-dive.lbl. gov/ftp/oceans/2nd_QC_Tool_V2/, last access: April 2018) where crossovers are generated as the difference between two cruises using the “running cluster” crossover routine. Each cruise is thus compared to the chosen set of reference cruises. For each crossover, samples deeper than 1000 db are selected within a predefined maximum distance set to a 2 arcdeg dis-tance, defined as a crossing region, to ensure the quality of the offset with a minimum number of crossovers and to min-imize the effect of the spatial change. The reason to select measurements deeper than 1000 db is to remove the high frequency variability associated with mesoscale features, bi-ological activity, and the atmospheric forcing acting in the upper layers that might induce changes in the biogeochemi-cal properties of water masses. On the other hand, the deep Mediterranean also cannot be considered truly unaffected by changes, as it is intermittently subjected to ventilation (Schroeder et al., 2016; Testor et al., 2018) and the real vari-ability can be altered in adjusting data. The computational approach takes this into account, since weights are given to the less variant profile in the crossing region, according to the confidence in the determined offset of the compared pro-files (i.e. the weighted mean offset of a given crossover pair is weighted to the depth where the offsets of all compared profiles have the smallest variation, which indeed is strongly interlinked with the degree of variance of each profile; for further details see Lauvset and Tanhua, 2015).
Before identifying crossovers, each profile was interpo-lated using the piecewise cubic Hermite method and the dis-tance criteria outlined in Lauvset and Tanhua (2015) in their Table 1a, detailed in Key et al. (2004). The crossover is a comparison between each interpolated profile of the cruise being evaluated and the interpolated profile of the reference cruise. The result is a weighted offset (defined as the ratio be-tween cruise and reference) and a standard deviation of the
offset. The standard deviation is indicative of the precision – however, it is important to note that this assumption only works because it is a comparison to a reference – and the absolute offset is indicative of accuracy.
The third step consists of evaluating and selecting the sug-gested correction factor that was applied to the whole wa-ter column. The correction factor was calculated from the weighted mean offset of all crossovers found between the cruise and the reference dataset, involving a somewhat sub-jective process.
For inorganic nutrients, offsets are multiplicative so that a weighted mean offset > 1 means that the measurements of the corresponding cruise are higher than the measurements of the reference cruise in the crossing region and applying the adjustment would decrease the measured values. The mag-nitude of an increase or a decrease is the difference in the weighted offset from 1. In general, no adjustment smaller than 2 % (accuracy limit for nutrient measurements) is ap-plied (detailed description is found in Hoppema et al., 2009; Lauvset and Tanhua, 2015; Olsen et al., 2016; Sabine et al., 2010; Tanhua et al., 2010).
The last step is the computation of the weighted mean (WM) to determine the internal consistency and quantify the overall accuracy of the adjusted product (Hoppema et al., 2009; Sabine et al., 2010; Tanhua et al., 2009), with the dif-ference that our assessment is based on the offsets with re-spect to a set of reference cruises. This WM reflects the ab-solute weighted mean offset of the dataset compared to the reference dataset; hence the smaller the WM, the higher the internal consistency. The accuracy was computed from the individual absolute weighted offsets. The WM, which will be discussed in Sect. 4.4, was computed using the individual
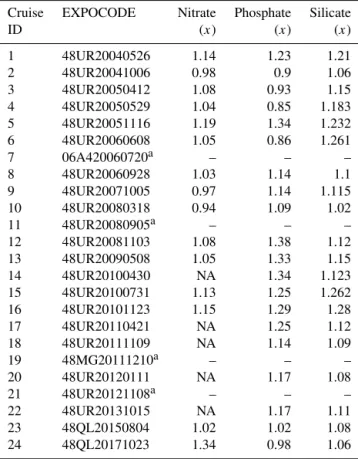
Table 5.Summary of the suggested adjustment for nitrate, phos-phate, and silicate resulting from the crossover analysis. Adjust-ments for inorganic nutrient are multiplicative. NA denotes not ad-justed, i.e. data of cruises that could not be used in the crossover analysis, because of the lack of stations or because data are outside the spatial coverage of reference cruises.
Cruise EXPOCODE Nitrate Phosphate Silicate
ID (x) (x) (x) 1 48UR20040526 1.14 1.23 1.21 2 48UR20041006 0.98 0.9 1.06 3 48UR20050412 1.08 0.93 1.15 4 48UR20050529 1.04 0.85 1.183 5 48UR20051116 1.19 1.34 1.232 6 48UR20060608 1.05 0.86 1.261 7 06A420060720a – – – 8 48UR20060928 1.03 1.14 1.1 9 48UR20071005 0.97 1.14 1.115 10 48UR20080318 0.94 1.09 1.02 11 48UR20080905a – – – 12 48UR20081103 1.08 1.38 1.12 13 48UR20090508 1.05 1.33 1.15 14 48UR20100430 NA 1.34 1.123 15 48UR20100731 1.13 1.25 1.262 16 48UR20101123 1.15 1.29 1.28 17 48UR20110421 NA 1.25 1.12 18 48UR20111109 NA 1.14 1.09 19 48MG20111210a – – – 20 48UR20120111 NA 1.17 1.08 21 48UR20121108a – – – 22 48UR20131015 NA 1.17 1.11 23 48QL20150804 1.02 1.02 1.08 24 48QL20171023 1.34 0.98 1.06
aCruise not included in the second QC (Sect. 4.).
weighted absolute offset (D) of the number of crossovers (L)
and the standard deviation (σ ): WM =
L P i=1 D(i)/(σ (i))2 PL i=11/(σ (i))2 .
4 Results of the secondary QC and
recommendations
The results of the secondary QC revealed the necessary cor-rections for nitrate, phosphate, and silicate. Four cruises were not considered in the crossover analysis: cruises no. 7 and no. 11 do not have enough stations > 1000 db (at least three are needed to obtain valid statistics), while cruises no. 19 and no. 21 were outside the spatial coverage of the reference cruises. Cruises that were not used for the crossover anal-ysis are made available in the original dataset but were not included in the final data product (see Supplement – Part 2, A2).
Overall, we found a total number of 73 individual crossovers for nitrate, 72 for phosphate, and 54 for silicate.
An example of the running cluster crossover output is shown in Fig. 4. Results of the crossover analysis is an adjustment factor for each cruise and each nutrient, which are shown in Table 5 and Figs. 5–7. The adjustment factor was calculated from the weighted mean of the absolute offset summarized in Table 6 and Figs. S3–S5. Table 6 details the improvement of the weighted mean of the absolute offset by cruise prior to and after adjustments; the information is also displayed graphically in Figs. S3–S5. Cruises are in chronological or-der in all figures and tables.
4.1 Nitrate
The crossover analysis suggests a significant adjustment for nitrate concentrations on 15 cruises, between 0.94 and 0.98 (for adjustments < 1) and between 1.02 and 1.34 (for ad-justments > 1; Table 5 and Fig. 5). Offsets suggest that the deep measurements of cruises no. 1, no. 3, no. 4, no. 5, no. 6, no. 8, no. 12, no. 13, no. 15, no. 16, no. 23, and no. 24 need to be adjusted towards higher concentrations when compared to the respective reference (Fig. S3).
Nitrate observations of cruises no. 2, no. 9, and no. 10 on the other hand were higher than the reference cruises and exhibit variation outside the accepted accuracy limit, thus re-quiring a downward adjustment.
Finally, five cruises (no. 14, no. 17, no. 18, no. 20, and no. 22) were consistent with the reference data and no adjust-ment was necessary. Considering the weighted mean of ab-solute offset after adjustments shown in Table 6, two cruises (no. 5 and no. 24) required large correction factors but re-main outside the accuracy threshold (Fig. 5). These cruises are considered in detail later (Sect. 4.4).
4.2 Phosphate
For phosphate the crossover analysis suggests adjustments for 20 cruises, as shown in Fig. 6. Deep phosphate measuments of 15 cruises (Table 6) appear to be lower than the re-spective reference measurements (i.e. phosphate data of these cruises require an upward adjustment), while the data of five cruises (no. 2, no. 3, no. 4, no. 6, no. 24) are higher (i.e. they need a downward adjustment; Fig. S4). Applying all the in-dicated adjustments, the large offsets of cruises no. 2, no. 3, no. 4, no. 6, no. 8, no. 9, no. 10, no. 18, no. 20, no. 23, and no. 24 are reduced and become consistent with the reference. Cruises no. 1, no. 5, no. 12, no. 13, no. 14, no. 15, no. 16, no. 17, and no. 22 retain an offset even after applying the indicated adjustment. These cruises are considered in detail later.
According to Olsen et al. (2016), if a temporal trend is detected in the offsets, no adjustments should be applied. There is indeed a decreasing trend between 2008 and 2017 in the phosphate correction factor (Fig. 6) and thus an in-creasing one in the weighted mean offset (Fig. S4), imply-ing a temporal increase in phosphate. Therefore, phosphate
Figure 4. An example of the calculated offset for silicate between cruise 48UR20131015 and cruise 29AJ2016818 (reference cruise).
(a) Location of the stations that are part of the crossover and statistics. (b) Vertical profiles of silicate data (µmol kg−1) of the two cruises
that fall within the minimum distance criteria (the crossing region), below 1000 dbar. (c) Vertical plot of the difference between both cruises (thick dotted black line) with standard deviations (thin dotted black lines) and the weighted average of the offset (solid red line) with the weighted standard deviations (dotted red lines).
Figure 5.Results of the crossover analysis for nitrate, before (grey) and after (blue) adjustment. Error bars indicate the standard devia-tion of the absolute weighted offset. The dashed lines indicate the 2 % accuracy limit for an adjustment to be recommended.
data of the cruises being part of the trend were not flagged as questionable, except some cruises that are discussed further in Sect. 4.4.
Comparing phosphate before and after adjustment, the cor-rections did minimize the difference with the reference while the actual variation with time was preserved (Fig. 6). The
Figure 6.The same as Fig. 5 but for phosphate.
temporal trend towards higher phosphate concentrations in the Mediterranean Sea is considered to be real, even though studies concerning the biogeochemical trends in the deep lay-ers of the WMED are scarce (Pasqueron et al., 2015). How-ever, this variation could be consistent with the findings of Béthoux et al. (1998, 2002) and the modelling studies by Moon et al. (2016) and Powley et al. (2018), who indeed found an increasing trend in phosphate concentrations over
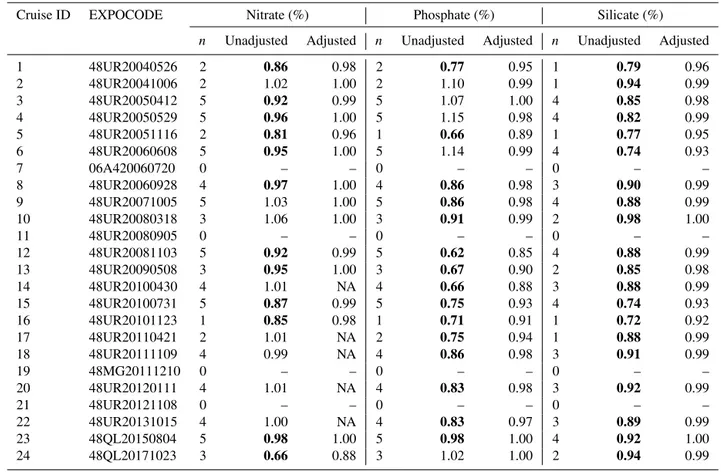
Table 6.Secondary QC toolbox results: improvements of the weighted mean of absolute offset per cruise of unadjusted and adjusted data;
nis the number of crossovers per cruise. The numbers in bold (less than 1) indicate that the cruise data are lower than the reference cruises.
NA: not adjusted.
Cruise ID EXPOCODE Nitrate (%) Phosphate (%) Silicate (%)
n Unadjusted Adjusted n Unadjusted Adjusted n Unadjusted Adjusted
1 48UR20040526 2 0.86 0.98 2 0.77 0.95 1 0.79 0.96 2 48UR20041006 2 1.02 1.00 2 1.10 0.99 1 0.94 0.99 3 48UR20050412 5 0.92 0.99 5 1.07 1.00 4 0.85 0.98 4 48UR20050529 5 0.96 1.00 5 1.15 0.98 4 0.82 0.99 5 48UR20051116 2 0.81 0.96 1 0.66 0.89 1 0.77 0.95 6 48UR20060608 5 0.95 1.00 5 1.14 0.99 4 0.74 0.93 7 06A420060720 0 – – 0 – – 0 – – 8 48UR20060928 4 0.97 1.00 4 0.86 0.98 3 0.90 0.99 9 48UR20071005 5 1.03 1.00 5 0.86 0.98 4 0.88 0.99 10 48UR20080318 3 1.06 1.00 3 0.91 0.99 2 0.98 1.00 11 48UR20080905 0 – – 0 – – 0 – – 12 48UR20081103 5 0.92 0.99 5 0.62 0.85 4 0.88 0.99 13 48UR20090508 3 0.95 1.00 3 0.67 0.90 2 0.85 0.98 14 48UR20100430 4 1.01 NA 4 0.66 0.88 3 0.88 0.99 15 48UR20100731 5 0.87 0.99 5 0.75 0.93 4 0.74 0.93 16 48UR20101123 1 0.85 0.98 1 0.71 0.91 1 0.72 0.92 17 48UR20110421 2 1.01 NA 2 0.75 0.94 1 0.88 0.99 18 48UR20111109 4 0.99 NA 4 0.86 0.98 3 0.91 0.99 19 48MG20111210 0 – – 0 – – 0 – – 20 48UR20120111 4 1.01 NA 4 0.83 0.98 3 0.92 0.99 21 48UR20121108 0 – – 0 – – 0 – – 22 48UR20131015 4 1.00 NA 4 0.83 0.97 3 0.89 0.99 23 48QL20150804 5 0.98 1.00 5 0.98 1.00 4 0.92 1.00 24 48QL20171023 3 0.66 0.88 3 1.02 1.00 2 0.94 0.99
In bold: data lower than reference.
time, due to the increase in the atmospheric and terrestrial inputs.
4.3 Silicate
The results of the crossover analysis for silicate suggest cor-rections for all cruises (Fig. 7). The crossovers indicate that deep silicate measurements are lower in the evaluated cruises than in the corresponding reference cruises (i.e. they need to be adjusted upward; Fig. S5). This is likely to be a direct result of freezing the samples before analysis, since the re-active silica polymerizes when frozen (Becker et al., 2019). After applying the adjustment (Table 5), as expected, the off-sets are reduced (Table 6), but five cruises (no. 1, no. 5, no. 6, no. 15, and no. 16) remain outside the accuracy envelope. Due to the large offsets, these cruises will be discussed fur-ther in Sect. 4.4.
4.4 Discussion and recommendations
Adjustments were evaluated for each cruise separately. As a general rule, no correction was applied when the suggested adjustment was strictly within the 2 % limit (indicated with
NA in Table 5). The average correction factors were 1.06 for nitrate, 1.14 for phosphate, and 1.14 for silicate, respectively. To verify the results, we reran the crossover analysis and re-computed offsets and adjustment factors using the adjusted data (as shown in blue in Figs. S3–S5 and 5–7). Most of the new adjustments are within the accuracy envelope and few are outside the limit, except for the cruises belonging to the above-mentioned phosphate trend and the other outlying cruises which are detailed hereafter. By the application of ad-justments, the deep-water offsets were reduced. This can be seen in the decrease in the weighted mean offset between the data before adjustments (after first QC, Figs. S3–S5, in grey) and the adjusted data (after second QC, Figs. S3–S5, in blue). Referring to the analysis detailed in Sect. 3.2, the inter-nal consistency of the nutrient dataset has improved and in-creased significantly after the adjustment, from 4 % for ni-trate, 19 % for phosphate, and 13 % for silicate to a more unified dataset with 3 % for nitrate, 6 % for phosphate, and 3 % for silicate.
A comparison between the original and the adjusted nu-trient observations is shown in Fig. 8a–c, indicating an im-provement in the accuracy based on the reference data and a relatively reduced range particularly for phosphate (Fig. 8b). Figure 8d–e scatter plots show that after the quality control, nutrient stoichiometry slopes obtained from regressions, be-tween tracers along the water column, demonstrate a strong coupling and provide a nitrate-to-phosphate ratio of ∼ 22.09 and a nitrate-to-silicate ratio of ∼ 0.94. These values are con-sistent with nutrient ratio ranges found in the WMED as re-ported in Lazzari et al. (2016), Pujo-Pay et al. (2011), and Segura-Noguera et al. (2016). The regression model is more accurate after adjustments with an improved r2 for N : P (from 0.81 to 0.90) and for N : Si (from 0.85 to 0.87).
In the following some details on the adjustment of specific cruises are given.
Cruise no. 2 (48UR20041006) needed an adjustment of 0.98 for nitrate, 0.9 for phosphate, and 1.06 for silicate. Most of the crossover profiles occur in the Tyrrhenian Sea (Tyrrhe-nian North and Tyrrhe(Tyrrhe-nian South subregions). After adjust-ment, the cruise is inside the 2 % envelope.
Cruise no. 3 (48UR20050412) appeared to be outside the 2 % envelope before adjustments. Its offsets with five refer-ence cruises, crossing the Tyrrhenian Sea, Sardinia Channel, Gulf of Lion, and Algero-Provençal subregions, showed ni-trate and silicate values to be relatively low, and thus an ad-justment of 1.08 and 1.15 was applied, respectively. On the other hand, phosphate values were relatively high, and a 0.93 adjustment was applied.
The cruise no. 4 (48UR20050529) correction factor es-timate was based on five crossovers that covered five sub-regions: the Tyrrhenian South, Sardinian Channel, Algerian East and West, and Alboran Sea. Table 4 shows that there are no large differences between regional averages within the cruise which justify an adjustment of 1.04 for nitrate, 0.85 for phosphate, and 1.183 for silicate.
Cruise no. 8 (48UR20060928) was adjusted by 1.03 for nitrate, 1.14 for phosphate, and 1.1 for silicate, because it showed values to be low compared to four references. After adjustment, the data were inside the acceptable range.
Cruise no. 9 (48UR20071005) values of nitrate were slightly outside the 2 % envelope before adjustments, simi-lar to phosphate and silicate which were lower compared to the reference. The adjustments of 0.97 for nitrate, 1.14 for phosphate, and 1.115 for silicate suggested by the mean off-set against the reference cruises were recommended.
Cruise no. 10 (48UR20080318) has only three crossovers in the Algero-Provençal subregion, showing that nitrate is too high compared to the reference, while phosphate and silicate are slightly lower. We therefore applied the adjustments of Table 5, since the deep averages in each region (Table 4) did not show large regional differences.
Cruise no. 13 (48UR20090508) has three crossovers in the common crossing zone that included the Tyrrhenian North, Tyrrhenian South, and Sardinia Channel subregions. The crossover suggests that this cruise has too low values and needs an adjustment of 1.05 for nitrate, 1.33 for phosphate, and 1.15 for silicate.
Cruise no. 14 (48UR20100430) has a mean offset with four reference cruises that suggests an adjustment factor of 1.34 for phosphate and 1.123 for silicate. Nitrate fell within the accuracy envelope; no adjustment was needed.
Cruise no. 17 (48UR20110421) crossover analysis did not suggest any correction for nitrate; however, with an offset based on two crossovers in the Tyrrhenian North and South subregions, adjustments were recommended for phosphate (1.25) and silicate (1.12), for being lower than the reference cruises.
Cruise no. 18 (48UR20111109) is similar to cruise no. 17, since it was suggested to adjust phosphate by 1.14 and sil-icate by 1.09, based on four crossovers in the Tyrrhenian North and South, Sardinia Channel, and Algero-Provençal subregions.
Cruise no. 20 (48UR20120111) has four crossovers over the Tyrrhenian North and South and Algero-Provençal sub-regions. Its measurements were slightly lower than the refer-ence cruises, suggesting a correction factor of 1.17 for phos-phate and 1.08 for silicate.
Cruise no. 22 (48UR20131015) has similar correction fac-tors to cruise no. 20, based on three crossovers in the Sar-dinia Channel and Tyrrhenian North and South subregions, with measurements being lower than the reference.
Cruise no. 23 (48QL20150804) showed nutrient values slightly lower than the reference cruises as well, suggesting small correction factors of 1.02 for both nitrate and phos-phate and 1.08 for silicate, correction factors that were based on offsets with five cruises.
Below, we discuss the recommended flags in the final product (Table 3; see Supplement Part 2, A2) assigned for some cruises that needed further consideration, since they re-quired larger adjustment factors:
Figure 8.Dataset comparison before (black) and after (blue) adjustment, showing vertical profiles of (a) nitrate (µmol kg−1), (b) phosphate
(µmol kg−1), and (c) silicate (µmol kg−1). Scatter plots of the adjusted data from all depths after first and second quality control for (d)
phos-phate vs. nitrate (µmol kg−1) and (e) silicate vs. nitrate (µmol kg−1). The black lines represent the best linear fit between the two parameters,
and the corresponding equations and r2values are shown in each plot. Average resulting N : P ratio is 22.09; average resulting N : Si ratio is
0.94 (whole depth).
Cruise no. 1 (48UR20040526). The adjusted values are
still lower than the reference (Figs. 5–7, S3–S5) and are still outside the 2 % accuracy range. This cruise had stations in the Strait of Sicily, Tyrrhenian North and South, and Ligurian East subregions (Fig. 9, right side), and only four stations were deeper than 1000 db (those within the Tyrrhenian Sea). The low precision of this cruise had already been evidenced during the first QC (Sect. 3.1). We recommend flagging this cruise as questionable (flag 3).
Cruise no. 5 (48UR20051116).This cruise took place be-tween the Strait of Sicily and the Tyrrhenian North and South (Fig. 9, right side). Nitrate, phosphate, and silicate data were lower than those from other cruises (no. 3 and no. 4) run the same year (Figs. 5–7, S3–S5) and are still biased after adjust-ments. Considering the limited precision and the low number of crossovers, it is recommended to flag the cruise as ques-tionable (flag 3).
Cruise no. 6 (48UR20060608).This cruise had an offset with five cruises, giving evidence that adjustments of 1.05 for nitrate, 0.86 for phosphate, and 1.26 for silicate are needed. The silicate bias was reduced after adjustment but remained large with respect to the accuracy limit (Figs. 7, S5). This cruise has a wide geographic coverage, with stations along nine sections (Fig. 9, right side). Considering also the high
standard deviation (Table 4), which is partially attributed to the spatial coverage of the cruise, there is still uncertainty about the quality of the samples. It is recommended to flag silicate data of cruise no. 6 as questionable (flag 3).
Cruise no. 12 (48UR20081103).Phosphate data have low
accuracy with respect to the reference cruises (Figs. 6, S4). This cruise has stations along a longitudinal section from the Strait of Sicily to the Alboran Sea, which might explain the large standard deviation of deep phosphate samples (Ta-ble 4). Cruise no. 12 was given a correction of 1.08 for ni-trate, 1.12 for silicate, and 1.38 for phosphate. The mean offset from five crossovers computed within the Tyrrhenian South, Sardinia Channel, Algerian East, Algerian West, and Alboran Sea subregions suggests that this cruise has lower nutrient values than the reference cruise. After adjustment, cruise no. 12 is within the acceptable range for nitrate and silicate but not for phosphate as highlighted in Sect. 3.2. In addition, considering the relatively high number of sta-tions > 1000 db and a plausible trend in phosphate, it is rec-ommended to flag the phosphate data as good/acceptable (flag 2).
Cruise no. 15 (48UR20100731).This cruise has 149 sta-tions along a similar track to cruise no. 12 but shows larger offsets for phosphate and silicate (Figs. 6–7, S4–
Figure 9.Vertical profiles of the inorganic nutrients in the dataset after adjustments and spatial coverage of each cruise (reference to cruise ID is above each map). The whole WMED adjusted product is shown in black, while the data of each individual cruise are shown in blue (flag 2) and green (flag 3).
S5) compared to cruise no. 12. Considering that deep sili-cate data were not of low quality (small standard deviation; see Table 4) and that deep phosphate data fall within the phosphate trend discussed above, these data are flagged as good/acceptable (flag 2).
Cruise no. 16 (48UR20101123).The cruise shows large
offsets for phosphate and silicate (Figs. 6–7, S4–S5), similar to cruise no. 15. Considering that the overall cruise standard deviation of silicate samples below 1000 db was relatively high (1.02 over 14 samples; see Table 4); that it has only one crossover between the Tyrrhenian North and South sub-regions (Table 6); and that when comparing deep regional averages, this cruise had the lowest average silicate value, it is recommended to flag silicate data of cruise no. 16 as ques-tionable (flag 3). As for phosphate, the cruise is part of the phosphate trend and is therefore flagged as good/acceptable (flag 2).
Cruise no. 24 (48QL20171023).This cruise has the largest offset for nitrate even after adjustment. It is very likely due to a difference between laboratories (calibration standards) concerning nitrate, which needs to be flagged as questionable (flag 3) in the final product.
There are several sources of bias in the observation. One of the main reasons for an upward or downward bias would be the difference in the nutrient’s chemical analytical method and the lack of use of CRMs in all cruises as also noted in CARINA (Tanhua et al., 2009) or in the most recent global comparability study by Aoyama (2020).
Cruises discussed in this section were not removed from the final product but were retained along with their recom-mended quality flag (Table 3), detailed above and in the Sup-plement – Part 2, A2. We have carried out the evaluation of their overall quality but leave up to the users how to appro-priately use these data.
4.5 Product assessment – comparison with MEDATLAS
Average water mass biogeochemical properties have been computed from the adjusted product (Table 7) and compared to the MEDAR/MEDATLAS annual climatological profiles, downloaded from the Italian National Oceanographic Data Centre (NODC) website (http://doga.ogs.trieste.it/medar/, last access: February 2020) given by Manca et al. (2004), in order to evaluate and assess the new product. Since nutrient properties exhibit differences with depths, we compared av-erage nutrient concentrations of the three main water masses in 12 subregions of the WMED (Table 7, Fig. S2).
The results of Table 7 compare water mass biogeochemi-cal properties with the reference climatology. The new prod-uct agrees well with the MEDATLAS climatology. However, there are some distinctions. The surface layer (0–150 db) is characterized by a low nutrient content. The surface nitrate
varies between 0.69 and 2.75 µmol kg−1 with a maximum
found in the Ligurian East (DF4) and a minimum in the Alboran Sea (DS1) subregions; similar values were recorded
in the climatology (0.61–3.00 µmol kg−1). The differences in nitrate averages in the surface layer are observed in the Gulf of Lion (DF2) where the new product is higher than the cli-matology and slightly lower in the Liguro-Provençal (DF3). As for the surface content in phosphate, it varied between 0.04 and 0.16 µmol kg−1with a maximum found in the Lig-urian East (DF1) and a minimum in the Alboran Sea (DS1), like the MEDATLAS climatology, where phosphate aver-ages fluctuate between 0.05 and 0.19 µmol kg−1. The new product is slightly lower compared to the climatology. As to the average surface in silicate, it varies between 1.36 and 2.91 µmol kg−1with a minimum found in the Ligurian East (DF4) and a maximum in the Gulf of Lion (DF2), while in the climatology, it varied between 1.27 and 2.31 µmol kg−1 (the minimum in the Ligurian East – DF4 – and the maxi-mum in the Alboran Sea – DS1). The new product is slightly higher in silicate.
Overall, the differences in the surface layer are observed in the Gulf of Lion (DF2), the Liguro-Provençal (DF3), and the Ligurian East (DF4) regions which could be due to the in-tense variability of the vertical mixing occurring in the north-ern WMED compared to in the other subregions.
In the intermediate layer, averages were computed from the depth of the salinity maximum (Smax) ± 100 m from a
regional average profile, indicative of the Levantine Inter-mediate Water (LIW) core. The nitrate average varied be-tween 4.94 and 9.32 µmol kg−1where the minimum content was recorded in the Strait of Sicily (DI3) and the maximum in the Algerian West, (DS3) while in the MEDATLAS cli-matology, nitrate was between 5.14 and 8.60 µmol kg−1. On average, the lowest content in nitrate was in the Tyrrhenian North (DT1) and South (DT3), Sardinia Channel (DI1), and Strait of Sicily (DI3), while LIW of the Gulf of Lion (DF2), Liguro-Provençal (DF3), Ligurian East (DF4), Balearic Sea (DS2), Algero-Provençal (DF1), Alboran Sea (DS1), and Al-gerian West (DS3) and East (DS4) subregions was relatively rich in nitrate compared to the MEDATLAS product, though the new product was slightly higher mainly in the Gulf of Lion (DF2), Ligurian East (DF4), and Balearic Sea (DS2). As for phosphate, LIW averages showed similar behaviour to nitrate: the lowest phosphate content (0.21–0.27 µmol kg−1) was observed in the eastern subregions of the WMED (DI3, DI1, DT3, and DT1), while the maximum concentrations (0.4–0.37 µmol kg−1) were reported in the western subre-gions of the WMED (DS1, DS3 and DS4, DS2, and DF2). The large differences between the two products were in the Ligurian East (DF4) and the Alboran Sea (DS1), subregions with low numbers of observations.
Concerning silicate, the lowest average concentration (5.25 µmol kg−1) was observed in the LIW core of the Strait of Sicily (DI3) and the maximum concentrations (8.66– 8.77 µmol kg−1) were in the Alboran Sea (DS1) and Gulf of Lion (DF2); similar values were recorded in the MEDATLAS climatology (4.86–7.95 µmol kg−1). There are some discrep-ancies where the new product was higher particularly in the
Table 7.Water mass properties and regional average concentrations of inorganic nutrients: comparison between the new adjusted product and the MEDAR/MEDATLAS climatology (with standard deviations and number of observations in brackets).
Region and water mass Nitrate (µmol kg−1) Phosphate (µmol kg−1) Silicate (µmol kg−1) Avg new product Avg Medar Avg new product Avg Medar Avg new product Avg Medar DF2 – Gulf of Lion
Surface water (0–150 db) 2.68 ± 2.53 (68)a 1.7 ± 1.1 0.15 ± 0.06 (68) 0.13 ± 0.04 2.91 ± 1.33 (68) 1.72 ± 0.64 LIW core (Smaxdepth range: 300–500 db) 8.49 ± 0.18 (17) 6.13 ± 0.32 0.38 ± 0.02 (17) 0.34 ± 0.01 8.67 ± 0.69 (17) 6.12 ± 0.61 Deep water (> 1500 db) 8.03 ± 0.43 (33) 7.64 ± 0.31 0.37 ± 0.01 (33) 0.37 ± 0.015 8.7 ± 0.67 (33) 7.95 ± 0.06
DF3 – Liguro-Provençal
Surface water (0–150 db) 2.31 ± 2.4 (205) 3.0 ± 2.6 0.12 ± 0.07 (205) 0.19 ± 0.05 2.45 ± 1.05 (205) 2.16 ± 1.05 LIW core (Smaxdepth range: 300–500 db) 8.05 ± 0.18 (76) 7.74 ± 0.13 0.36 ± 0.01 (76) 0.35 ± 0.01 7.49 ± 0.55 (76) 6.26 ± 0.60 Deep water (> 1500 db) 8.18 ± 0.25 (142) 7.79 ± 0.04 0.37 ± 0.02 (142) 1.03 ± 1.29 8.98 ± 0.39 (142) 7.60 ± 0.21
DF4 – Ligurian East
Surface water (0–150 db) 0.7 ± 0.69 (228) 0.61 ± 1.03 0.05 ± 0.02 (228) 0.18 ± 0.02 1.37 ± 0.45 (228) 1.27 ± 1.86 LIW core (Smaxdepth range: 300–500 db) 6.8 ± 0.4 (23) 5.54 ± 0 0.3 ± 0.02 (21) 0.36 ± 0.06 5.86 ± 0.9 (24) 4.86 ± 0
Deep water (> 1500 db) – – – – – –
DS2 – Balearic Sea
Surface water (0–150 db) 1.32 ± 1.46 (196) 1.19 ± 1.5 0.08 ± 0.04 (196) 0.11 ± 0.04 1.61 ± 0.64 (196) 1.54 ± 0.78 LIW core (Smaxdepth range: 300–500 db) 8.32 ± 0.32 (58) 6.92 ± 0.12 0.37 ± 0.02 (60) 0.39 ± 0.003 7.31 ± 0.9 (60) 7.55 ± 0.62 Deep water (> 1500 db) 8.2 ± 0.35 (88) – 0.37 ± 0.01 (88) – 8.71 ± 0.51 (88) 8.45 ± 0.8
DF1 – Algero-Provençal
Surface water (0–150 db) 0.87 ± 0.85 (372) 1.08 ± 1.7 0.05 ± 0.02 (372) 0.07 ± 0.05 1.42 ± 0.3 (372) 1.28 ± 0.73 LIW core (Smaxdepth range: 300–500 db) 8.07 ± 0.34 (126) 7.51 ± 0.18 0.36 ± 0.02 (126) 0.34 ± 0.008 6.84 ± 0.95 (126) 5.96 ± 0.77 Deep water (> 1500 db) 8.36 ± 0.27 (300) 7.87 ± 0.13 0.38 ± 0.02 (300) 0.38 ± 0.001 9.01 ± 0.33 (300) 8.18 ± 0.10 DS1 – Alboran Sea
Surface water (0–150 db) 2.75 ± 2.87 (299) 2.51 ± 2.23 0.17 ± 0.11 (299) 0.16 ± 0.07 2.07 ± 1.38 (299) 2.31 ± 1.14 LIW core (Smaxdepth range: 400–600 db) 8.89 ± 0.4 (77) 8.14 ± 0.11 0.42 ± 0.02 (77) 0.37 ± 0.008 8.77 ± 1.66 (76) 7.95 ± 0.34 Deep water (> 1500 db) 7.72 ± 0.81 (65) – 0.36 ± 0.04 (65) – 8.98 ± 0.63 (65) 8.16 ± 0
DS3 – Algerian West
Surface water (0–150 db) 1.8 ± 1.88 (254) 1.82 ± 2.01 0.11 ± 0.05 (354) 0.11 ± 0.06 1.71 ± 0.68 (354) 2.10 ± 0.91 LIW core (Smaxdepth range: 400–600 db) 9.33 ± 0.08 (70) 8.28 ± 0.15 0.41 ± 0 (73) 0.38 ± 0.012 8.1 ± 0.53 (72) 6.68 ± 0.80 Deep water (> 1500 db) 8.37 ± 0.27 (246) 8.047 ± 0.013 0.37 ± 0.02 (246) 0.36 ± 0.006 9.22 ± 0.35 (246) 8.87 ± 0.23
DS4 – Algerian East
Surface water (0–150 db) 0.94 ± 0.77 (170) 0.75 ± 1.26 0.07 ± 0.02 (170) 0.05 ± 0.03 1.53 ± 0.12 (170) 1.35 ± 0.52 LIW core (Smaxdepth range: 400–600 db) 8.5 ± 0.25 (43) 8.60 ± 0.06 0.38 ± 0.03 (43) 0.38 ± 0.008 7.27 ± 0.67 (42) 7.092 ± 0.55 Deep water (> 1500 db) 7.94 ± 0.24 (132) 8.06 ± 0.06 0.36 ± 0.02 (132) 0.38 ± 0.006 8.73 ± 0.38 (132) 9.04 ± 0.24 DT1 – Tyrrhenian North
Surface water (0–150 db) 1.03 ± 1.14 (231) 0.88 ± 1.2 0.06 ± 0.02 (231) 0.09 ± 0.03 1.64 ± 0.52 (231) 2.19 ± 0.59 LIW core (Smaxdepth range: 400–600 db) 5.95 ± 0.49 (43) 5.86 ± 0.36 0.27 ± 0.03 (44) 0.308 ± 0.02 7.06 ± 0.08 (44) 6.76 ± 0.59 Deep water (> 1500 db) 7.75 ± 0.37 (194) 7.12 ± 0.47 0.36 ± 0.03 (194) 0.40 ± 0.02 9.19 ± 0.47 (194) 7.51 ± 0.49
DT3 – Tyrrhenian South
Surface water (0–150 db) 1.21 ± 1.38 (711) 1.23 ± 1.80 0.06 ± 0.03 (711) 0.061 ± 0.04 1.58 ± 0.61 (711) 1.55 ± 1.05 LIW core (Smaxdepth range: 300–500 db) 6.2 ± 0.28 (225) 6.42 ± 0.01 0.26 ± 0.02 (225) 0.254 ± 0.005 6.28 ± 0.65 (224) 6.68 ± 0.44 Deep water (> 1500 db) 7.88 ± 0.4 (227) 7.12 ± 0.26 0.37 ± 0.02 (227) 0.31 ± 0.007 9.04 ± 0.52 (227) 8.02 ± 0.07
DI1 – Sardinia Channel
Surface water (0–150 db) 1.22 ± 1.39 (271) 1.42 ± 1.95 0.07 ± 0.03 (271) 0.064 ± 0.03 1.57 ± 0.68 (271) 1.39 ± 1.01 LIW core (Smaxdepth range: 300–500 db) 6.52 ± 0.17 (89) 6.45 ± 0.22 0.27 ± 0.02 (89) 0.250 ± 0.01 6.36 ± 0.67 (89) 6.27 ± 0.70 Deep water (> 1500 db) 7.91 ± 0.62 (107) – 0.37 ± 0.03 (107) 0.32 ± 0 8.64 ± 0.91 (107) – DI3 – Strait of Sicily
Surface water (0–150 db) 0.87 ± 0.68 (583) 0.77 ± 0.81 0.06 ± 0.02 (583) 0.063 ± 0.02 1.53 ± 0.29 (583) 1.44 ± 0.58 LIW core (Smaxdepth range: 200–400 db) 4.95 ± 0.47 (80) 5.14 ± 0.14 0.21 ± 0.02 (78) 0.194 ± 0.004 5.26 ± 0.79 (81) 6.744 ± 0.41
Deep water (> 1500 db) – – – – – –
aAverage (Avg) ± standard deviation of inorganic nutrients (the number of observations within depth range) for three layers from the adjusted or new product and MEDATLAS vertical