Alma Mater Studiorum – Università di Bologna
DOTTORATO DI RICERCA INMeccanica e scienze avanzate dell’ingegneria
Ciclo XXIX
Settore Concorsuale di afferenza: 09-C1 Settore Scientifico disciplinare: ING-IND/08
TITOLO TESI
Real-Time Engine Diagnostic and Control Based on
Acoustic Emissions Analysis
Presentata da:
Dott. Ing. Andrea Businaro
Coordinatore Dottorato
Relatore
Prof. Nicolò Cavina
Prof. Nicolò Cavina
i
Abstract
Engine developers are putting more and more emphasis on the research of maximum thermal and mechanical efficiency in the recent years. Research advances have proven the effectiveness of downsized, turbocharged and direct injection concepts, applied to gasoline combustion systems, to reduce the overall fuel consumption while respecting exhaust emissions limits. These new technologies require more complex engine control units.
The sound emitted from a mechanical system encloses many information related to its operating condition and it can be used for control and diagnostic purposes. The thesis shows how the functions carried out from different and specific sensors usually present on-board, can be executed, at the same time, using only one multifunction sensor based on low-cost microphone technology.
A theoretical background about sound and signal processing is provided in chapter 1. In modern turbocharged downsized GDI engines, the achievement of maximum thermal efficiency is precluded by the occurrence of knock. Knock emits an unmistakable sound perceived by the human ear like a clink. In chapter 2, the possibility of using this characteristic sound for knock control propose, starting from first experimental assessment tests, to the implementation in a real, production-type engine control unit will be shown. Chapter 3 focus is on misfire detection. Putting emphasis on the low frequency domain of the engine sound spectrum, features related to each combustion cycle of each cylinder can be identified and isolated. An innovative approach to misfire detection, which presents the advantage of not being affected by the road and driveline conditions is introduced. A preliminary study of air path leak detection techniques based on acoustic emissions analysis has been developed, and the first experimental results are shown in chapter 4. Finally, in chapter 5, an innovative detection methodology, based on engine vibration analysis, that can provide useful information about combustion phase is reported.
ii
Sommario
Negli ultimi anni, nel panorama automobilistico mondiale è stata introdotta una nuova generazione di motori, che rappresentano la ricerca della massima efficienza termica e meccanica. Numerose ricerche hanno dimostrato l'efficacia dei concetti di iniezione diretta, riduzione della cilindrata, sovralimentazione applicate a sistemi di combustione ad accensione comandata, per ridurre il consumo e rispettare i limiti di emissioni. Queste nuove tecnologie richiedono sistemi di gestione sempre più complessi.
Il suono emesso da un sistema meccanico racchiude molte informazioni relative alla sua condizione operativa e attraverso una opportuna elaborazione può essere utilizzato con finalità di controllo e diagnostica. Nella tesi verrà mostrato come funzioni specifiche svolte da sensori differenti presenti in vettura, possono essere eseguite tramite un unico sensore multifunzione basato su una tecnologia microfonica a basso costo.
Il primo capitolo introdurrà alcune nozioni di acustica e del trattamento dei segnali. Il capitolo 2 illustra lo sviluppo di indici di detonazione basati sull’elaborazione del segnale acustico applicati sia a motori automobilisti che motociclistici. Questa tecnica di identificazione è stata implementata in una reale centralina di produzione. Nel terzo capitolo viene analizzata la capacità di rilevamento di mancate accensioni mediante l’analisi sonora. Nel dominio delle basse frequenze sonore, è possibile individuare caratteristiche relative a ciascun ciclo di combustione di ogni cilindro. Il vantaggio presentato da questa metodologia di identificazione è di non essere influenzato dalle condizioni della linea di trasmissione e della strada, come invece accade per la tecnologia più largamente utilizzata, che è basata sull’analisi della velocità istantanea dell’albero motore.
Nel capitolo 4 vengono mostrati i primi studi e risultati sperimentali nello sviluppo di una tecnica di identificazione di perdite del giro aria mediante analisi acustica. Nel capitolo 5 verrà descritta una metodologia di analisi innovativa del segnale accelerometrico in grado di fornire informazioni utili per la determinazione della fase di combustione.
iii
Index
Chapter 1 1.1 Sound theory ... 1 1.2 Microphone ... 7 1.3 Experimental setup ... 9 Chapter 2 2.1 Knock detection feasibility study ... 152.1.1 Combustion Chamber Vibration Modes ... 15
2.1.2 Knock Detection Results ... 18
2.1.3 Turbocharger speed measurement ... 20
2.1.4 Simultaneous monitoring of turbocharger speed and knock intensity ... 21
2.2 Knock control strategy implementation in real ECU ... 23
2.2.1 Calibration procedure ... 25
2.2.2 Experimental results ... 28
2.3 Knock detection for motorcycle engine ... 333
2.3.1 Experimental setup ... 33
2.3.2 In-cylinder pressure analysis ... 34
2.3.3 Accelerometer and microphone signals analysis ... 36
2.3.4 Filter design ... 39
2.3.5 Window Definition ... 41
2.3.6 Calibration parameters definition ... 45
2.3.7 Performance comparison ... 45
Chapter 3 3.1 Engine misfire acoustic characteristics……….……….……48
3.2 Steady state tests ………...…50
Chapter 4 4.1 Preliminary tests………57
4.2 First tests on real engine……….……….59
Chapter 5 5.1 Preliminary analysis of the vibration signal……. ... 64
5.2 Peak pressure position detection for the gasoline engine ... 66
Conclusion………...………..71
1
Chapter 1
1.1 Sound theory
The sensation of sound is a result of vibrations in the air caused by pressure fluctuations, which can be measured with a sound level meter (phonometer/microphone). Vibrations are more commonly associated with mechanical systems, but air, also, has mass and stiffness, and sound travels in the air which is locally compressed and expanded. Sound waves can be defined as pressure oscillations that spread from a vibration source through the surrounding environment [1].
Figure 1. Sound source model.
Figure 1 shows a possible sound source model. The crankshaft moves the piston inside a cylinder. Due to piston relative movement, the particles in front of it are compressed and expanded. By means of a chain reaction, the molecules that are in contact with the piston compress the adjacent molecules, creating a longitudinal pressure wave. The air particles oscillate continually around their position and the sound wave moves forward at a constant speed. A sound wave generates an energy movement not a molecular flow (Figure 2).
2
Figure 2. Pressure wave diffusion.
Sound waves travels in the space at a constant speed. The low amplitude of the pressure waves allows the hypothesis of isentropic transformation to be done. Bearing in mind this concept, the sound speed can be defined as:
𝑐
0= √(
𝜕𝑃𝜕𝜌
)
𝑠 (1.1)
With the isentropic hypothesis is possible write:
𝑑(𝑝𝑣
𝑘) = 0
𝑣
𝑘𝑑𝑝 = −𝑘𝑣
𝑘−1𝑝𝑑𝑣
𝑑𝑝 𝑝= −𝑘
𝑑𝑣 𝑣= 𝑘
𝑑𝜌 𝜌→
𝑑𝑝 𝑑𝜌)
𝑠= 𝑘
𝑝 𝜌 (1.2)Using equations 1.1 and 1.2, the sound speed can be expressed as:
𝑐
0= √𝑘𝑅𝑇
(1.3)Where:
K: ratio of specific heats, R: gas constant,
3 For example, the sound speed in air at 20°C is equal to 343 [m/s]. In a fluid, as water, at the same temperature, at 1 [bar], the sound speed can reach 1414 [m/s] and in a solid, as aluminium, can increase up to 6300 [m/s].
A wave can be described using two quantities: frequency and amplitude. Frequency is related to the human sound intensity felling. The sounds with a frequency lower than 16 [Hz] are called infrasound, instead the sounds with a frequency higher than 20000 [Hz] are called ultrasound. Amplitude is the signal characteristic that allows to classify the sound with low and high intensity or more commonly called as sound “volume”. The human ear is a pressure sensor able to transduce the pressure oscillation in an electric signal for the human brain (Figure 3).
Figure 3. Human ear structure.
The intensity of sound can be measured as a local pressure oscillation around the ambient pressure. In this case the sound intensity is called Sound Pressure Level (SDP) [Pa]. More often, sound intensity is measured using Decibel [dB]. The Decibel is one tenth of the [bel]. Although nowadays the [bel] is not used, but it remains the principal unit. Decibel is a non-dimensional scale; indeed, it is defined as the logarithm of the ratio of two homogenous quantities. From an acoustic point of view, the sound intensity measured by [dB] is equal to:
𝑆𝑃𝐿 =
20log
(
𝑃𝑃0
)
[dB]
(1.4)
Where P0 represent the sound pressure at audible border equal to 2.97x10⁻⁵ [Pa].
As previously mentioned, sound is a pressure wave, whereby it is a periodic function that can be described by a sinusoidal function. An acoustic signal composed of a unique harmonic element is
4 called pure tone. The majority of sounds that can be listened are composed by different tones (Figure
4).
Figure 4. Real acoustic signal structure.
To analyse the signal structure, Fourier Transform (FFT) can be a useful mathematical processing. The FFT decomposes a function of time into the frequencies that make it up, in a way similar to how a musical chord can be expressed as the frequencies of its constituent notes. The FFT of a function of time itself is a complex-valued function of frequency, whose absolute value represents the amount of that frequency, present in the original function, and whose complex argument is the phase offset of the basic sinusoid in that frequency. The FFT is called the frequency domain representation of the original signal [2] and its mathematical formulation is expressed by equation 1.5.
𝑓(𝑡) =
12𝜋
∫
𝐹(𝜔)𝑒
𝑖𝜔𝑡
𝑑𝜔
+∞
5
Figure 5. Periodic signal and its Fourier transform
Figure 5 shows the application of FFT to a periodic signal. By the analysis of the second graph in the figure, it can be noted that the signal is composed from 3 different harmonic components which have different amplitude and frequency. This mathematical treatment allows extracting more detailed information and characteristics from the signal, but it can be applied only in steady state conditions. Indeed, when an acoustic signal evolves in time, as an example, a sound that increases its frequency in time (Figure 6), FFT cannot provide accurate results, because FFT supplies information about a periodic signal with infinite length that doesn't change its frequency and amplitude.
6
Figure 7. FFT of a transient signal.
Figure 7 shows the FFT applied to the transient signal shown in figure 6. By the analysis of figure 7, it is not possible identify the transient nature of the signal. To extract information about frequency and intensity of a non periodic signal, a more complex analysis must be performed. In this case, Short Time Fourier Transformation (STFT) [3] is applied instead of FFT.
Figure 8. Spectrogram of the signal shown in figure 6.
Figure 8 shows the result of the application of STFT to the signal shown in previous Figure 6. The spectrogram in figure 8 clarifies the real transient nature of the signal frequency content.
7
1.2 Microphone
The device used to acquire the environment sound is called microphone (Figure 9).
Figure 9. Microphone.
A microphone collects the pressure waves and forwards them like a mechanical vibration through a diaphragm to a sensitive element. Different principles can be used to transduce the mechanical vibration in an electrical signal. On the basis of the technology used inside the microphone, they can be categorized as:
• Dynamic: A dynamic microphone is the inverse of a dynamic loudspeaker. In a dynamic microphone, the sound pressure variations move the cone, which moves the attached coil of wire in a magnetic field, which generates a voltage (Figure 10.a). • Ribbon: the air movement associated with the sound moves the metallic ribbon in the
magnetic field, generating a voltage signal between the ends of the ribbon which is proportional to the velocity of the ribbon (Figure 10.b).
• Condenser: sound pressure changes the spacing between a thin metallic membrane and the stationary back plate.A change in plate spacing causes a change in charge and forces a current through resistance. The current signal is related to the sound pressure, making this a "pressure" microphone (Figure 10.c).
• Electret condenser: The electret class of microphones are condenser microphones that use a permanently polarized electret material for their diaphragms, thus avoiding the necessity for the biasing DC voltage required for the conventional condenser (Figure 10.d).
8 • Piezoelectric: Crystals that demonstrate the piezoelectric effect and produce voltage
differences when they are deformed. The crystal microphone uses a thin strip of piezoelectric material attached to a diaphragm. The two sides of the crystal acquire opposite charges when the crystal is deflected by the diaphragm. The charges are proportional to the amount of deformation and disappear when the stress on the crystal disappears (Figure 10.e).
Figure 10. Microphone sensitive elements types.
Further microphone characteristic is the directionality. Microphones can be divided in: • Monodirectional: it is primarily sensitive to sounds from only one direction.
• Bidirectional (stereo): the sensitivity is specular in opposite directions (Figure 11.a). • Omnidirectional: microphone's response is generally considered to be a perfect sphere in
three dimensions (Figure 11.b).
9
Figure 11. Microphone directionality.
1.3 Experimental setup
All the tests carried out during the research activity have been executed on the same engine. The engine used is a 4 cylinder 1.4L turbocharged direct injection engine, for passenger car applications. Its technical data are summarized in Table 1.
Displacement 1390 cm3 Stroke 75.6 mm Bore 76.5 mm Compression ratio 10:1 Max torque 220 Nm @ 1500-4000rpm Max power 103 kW @ 6000 rpm
Intake system Super and turbo charger
Injection system Direct Injection
Table 1. Technical data of the engine used during the experimental tests
During the experiments, carried out on the test bench, the in-cylinder pressure of each cylinder has been measured by means of Kistler 6052A piezoelectric sensors. A microphone-based sensing device, developed by Magneti Marelli, has been used for acquiring acoustic emissions. To compare the results
10 obtained by the sound analysis with the performance of the sensors, normally used for on-board application, the signal provided from the accelerometer already present on the production engine, placed behind the volumetric compressor, between cylinders 2 and 3 (Figure 12), has also been acquired. This type of sensor is a widespread solution adopted for knock onset detection in gasoline engines [4]. The four in-cylinder pressure, accelerometer and acoustic emission signals have been acquired simultaneously at 200 kHz by means of an On-Board Indicating analysis system (OBI-M2) by Alma Automotive [5]. A turbo SPEED DZ135 sensor by Micro-Epsilon, facing the compressor of the turbocharger, has been used to directly measure its rotational speed [6].
Moreover, the most important ECU and test bench variable have been acquired at low frequency using the ECU interface software INCA provide by ETAS [7] and by means of the test bench management software.
One of the most important aspects that must be taken into consideration when performing an acoustic analysis is the microphone position. In fact, the acoustic waves emitted by a source may be partially or totally shielded by the presence of a barrier along their path, when diffusing through the surrounding environment. The microphone position has been defined after a preliminary investigation. The placement with the highest signal to noise ratio has been identified in the intake side of the engine, under the intake manifold (Figure 13). Usually, on-board application requires a further optimization step for finding the best microphone position, but the signal to noise ratio is typically higher on-board the vehicle than in the test cell, due to noise absorption characteristics and shape of the engine compartment.
11
13
Chapter 2
The introduction in gasoline engines of concepts such as downsizing, turbocharging and direct injection (GDI), has recently led to a significant reduction of fuel consumption and greenhouse gas emissions.
In modern GDI engines, knock represents one of the main constraints for the maximum thermal efficiency to be reached. Knock is one of the possible types of abnormal combustion that can occur in gasoline engines. After the spark discharge, the flame front propagates from the spark plug through the combustion chamber. While the flame front moves towards the cylinder walls, the fresh, end gas zone is compressed due to expansion of the burned gas, and heated by the flame front. When the unburned fresh charge reaches certain temperature and pressure levels, it may self-ignite [8,9]. If the flame front does not reach the fresh gas before it self-ignites, the end gas gives rise to extremely rapid and uncontrolled combustions, called knock. Some of them produce extremely high temperature peaks and degenerate in pressure shock waves, thus possibly causing permanent thermo-mechanical damage to the combustion chamber components. Combustion chamber geometry, spark advance, fuel type, pressure and temperature levels are the main knock-related parameters. Limiting the spark advance with respect to the value that corresponds to maximum thermal efficiency, in an open loop control chain, enables minimizing the probability of knock onset. On the other hand, several uncontrolled parameters influence the detonation outset, as an example: fuel quality, intake pressure and temperature. To detect knocking combustions, a pressure sensor directly facing the combustion chamber provides extremely useful information, but this type of technology does still not meet automotive constraints in terms of cost and reliability. To overcome these issues, alternative sensors have been developed. The most diffused knock detection systems are based on vibration sensors screwed on the engine, in a specific position [10-14], or devices able to use the spark plug as a current sensor to detect the ion concentration variations inside the combustion chamber [15-17].
During on-board operation, the turbocharger speed may be estimated by implementing a static compressor model within the Engine Control Unit (ECU); unfortunately, the compressor steady state characteristic provides inaccurate values during transient operation, and it does not consider the possibly large part-to-part variations that characterize turbochargers production. A safety margin has therefore to be guaranteed by the boost control management, with the aim of preserving the turbocharger from over speeding. Such limitation imposed on the turbocharger controller implies a suboptimal performance in terms of maximum achievable boost pressure, and of turbo-lag reduction
14 during transient operation. A potential solution to improve the boost control management involves the direct measurement of the rotational speed, thus enabling a more accurate closed-loop control of the turbocharger speed. Unfortunately, the use of a specific sensor for the turbocharger speed measurement is not always compatible with the cost constraints typical of mass production passenger cars. Alternative techniques, based on indirect measurements and low cost sensors, have recently been developed and illustrated in literature [18, 19]. Engine sound emissions contain relevant information about its operating conditions, as demonstrated by several studies [20-23]. In particular, the characteristic whistle emitted from the turbocharger and the clink audible when knocking combustions occur, can be captured and analysed in order to extract useful information for the engine management [21, 22].
In the first part of chapter, the development of a novel methodology to derive a knock index based on engine acoustic emissions, will be presented. Also, will be shown how the very same microphone can be used to capture the sound emission of the turbocharger, to perform an indirect measurement of its rotational speed. This dual functionality of knock detection and turbo speed measurement, achievable by using only one microphone, is demonstrated, along with the experimental validation of both methods. About the turbo speed measurement technique, a short theoretical backing will be provided, because this technique has been developed in previous studies not exanimated during this research activity. A detailed description of the measurement principles can be found in specific papers by Cavina et.al [21]. In this work, the same technique has been applied to a gasoline turbocharged direct injection engine, which represents a more complex application due to lower rotating turbocharger speeds compared to the diesel engine applications.
During these first tests three engine operating points have been taken in account (Table 2).
Op. Point # Engine Speed Intake Manifold Pressure 1 2000 rpm 1300 mbar 2 2500 rpm 1500 mbar 3 3000 rpm 1500 mbar
Table 2. List of operating points tested during the first experimental phase
One of the most important aspects that must be taken into consideration when performing an acoustic analysis is the microphone position. In fact, the acoustic waves emitted by a source may be partially or totally shielded by the presence of a barrier along their path, when diffusing through the surrounding environment. Thirteen different locations around the engine have been tested during the experimental phase, to determine the ones that enable knocking clink and turbocharger whistle to be sensed at the same time.
15 In the second part of the chapter instead, the calibration procedure followed to implement the audio-based knock detection system in a standard ECU is shown. More specifically, it will be shown how it has been possible to switch from a standard knock control system based on accelerometer signal, to a fully sound-based one, by simply performing a recalibration procedure. The feasibility will be proved for incipient knock conditions by closing the spark advance loop using the acoustic knock index as a control variable on a real engine.
Finally, the audio based knock detection technique is compared to accelerometer in a motorcycle engine application. This type of engine operates at high rotational speed, which represent a challenging task for knock monitoring performed by acoustic and vibration signal analysis due to the low signal to noise ratio. An analysis and optimization of all the parameters that constitute the knock index is performed to maximize the correlation level.
2.1 Knock detection feasibility study
2.1.1 Combustion Chamber Vibration ModesThe combustion chamber can be considered as a bi-dimensional membrane that vibrates if excited by pressure waves. The vibration modes of the membrane are strictly correlated to the geometry of the combustion chamber itself and to the thermal state of the trapped gas [24-26]. The Draper’s frequencies can be calculated by Equation (1).
B
c
r
C
fr
s
(
,
)
(2.1) Where: fr: resonant frequency, Cs: speed of sound, B: cylinder bore. ρ: wave number.For the engine taken into account in this study, the first four vibration modes have been calculated using Equation (2.1). They are listed in Table 3.
16 r,c Ρ fr [-] [-] [kHz] 1,0 1.84 7.67 2,0 3.05 12.72 3,0 4.20 17.52 4,0 5.32 22.19
Table 3. Combustion chamber resonant modes
Preliminary experimental tests were performed by inducing knocking levels of different intensity (by acting on the SA), to verify whether the in-cylinder pressure signal was actually excited at the estimated resonant frequencies shown inTable 3, and whether such “signature” was observable also on the engine acoustic emission. Figure 14 shows the Power Spectral Density (PSD) calculated for the in-cylinder pressure signal under non-knocking, light-knocking and heavy-knocking conditions (at a given engine speed), confirming the sensitivity of in-cylinder pressure to knock intensity, and the resonant frequencies values calculated by Equation (2.1). The data shown in Figure 15 are related to the same tests of Figure 14, but in this case the PSD has been extracted from the acoustic emission signal, demonstrating that its frequency content is affected by knock in a similar way, and therefore proving that in principle the acoustic emission can be used to measure knocking intensity.
17
Figure 15. Acoustic emission signal energy distribution
Comparing the figures above, it may be noted that in both signals the same frequencies are excited during knocking combustions. Further, the intensity of the energy in the acoustic emission spectrum increases in the same way as for the in-cylinder pressure signal. On the other hand, observing Figure 15, it is visible that the engine sound wave spectrum contains significant frequency components that are not correlated to knock intensity. This consideration suggests that the knock detection should be performed through an analysis of frequency bands close to combustion chamber natural modes, in order to avoid the influence of other acoustic sources.
Many types of knock indexes have been developed in the last decades. A detailed review of the main approaches has been presented by Millo et al. [24], and more recently by Worret et al. [27].
To assess the quality of the knocking information contained in the audio signal with respect to the one that can be extracted from the cylinder pressure, the first step of the study has been the definition of different knock intensity indexes based on acoustic emissions, and the comparison with an in-cylinder pressure based knocking index assumed as a reference. In particular, the Maximum Amplitude Pressure Oscillation (MAPO) defined by Equation (2.2) has been considered as the reference pressure-based knocking index [26].
|)
max(|
Pcyl
filtMAPO
(2.2)For MAPO evaluation, the in-cylinder pressure is high pass filtered at 5 kHz. MAPO values are strictly associated to the intensity of the pressure waves produced by the auto-ignition process, and therefore to the main knock-related damage mechanisms [28]. For sound based knock intensity, two different indexes have been considered [11, 22], defined by Equations (2.3) and (2.4):
18
2 1|
|
1
1 2
Sound
d
Int
filt (2.3)
3
2 1max
max
max
filt filt filtSound
Sound
Sound
SDBP
(2.4)For Int calculation, the acoustic emission signal (Sound) has been band-pass filtered between 7 and 8 kHz. This frequency band corresponds to the first vibration mode, which resulted as the most sensitive in both pressure and sound signals. The frequency bands corresponding to the first three vibration modes, which resulted more evident in the acoustic spectrum, have instead been chosen for the definition of SDBP. Int represents the knocking index typically implemented within production ECUs for accelerometer-based knock-detection, and it is therefore particularly interesting to verify, in this study, the correlation level that may be achieved with in-cylinder pressure based knocking indexes using this type of algorithm.
The positions and widths of the angular windows used for knock evaluation for both in-cylinder pressure and sound emission are the same. Another aspect that should be taken into account, in sound analysis, is the transport time between sound emission and the moment that the sound wave reaches the microphone. By compensating this time delay, it is possible to maximize the signal to noise ratio and to assign the knocking event to the right cycle and cylinder. In the real time algorithm, the time delay has been initially estimated by measuring the air temperature and the distance between the microphone and each cylinder. The sound speed has been evaluated using Equation (1.3):
KRT
C
s
(1.3)2.1.2 Knock Detection Results
For each of the thirteen microphone positions, knocking has been induced for the three engine operating conditions summarized in Table 2. The complete engine operating range has not been explored because the goal of this first part of the study was the determination of the position with the best signal to noise ratio. For each operating condition, 500 subsequent engine cycles have been acquired and processed.
19 To evaluate the results, in terms of knock intensity detection, the Pearson’s linear correlation coefficient has been calculated between MAPO and the two sound-based knocking indexes.
The Pearson correlation coefficient is a statistical measure of the linear dependency between two variables x and y defined in equation 2.5. It can vary between +100% and −100%. A correlation level equal to 100% means that the two quantities change in the same way, therefore, the same information can be found in both signals.
100 ) ( ) ( ) )( ( ) , ( 1 2 1 2 1
N i i N i i N i i i y y x x y y x x y x r (2.5)The experimental results, obtained in the position considered as optimal for the knock detection (intake engine side, with the microphone placed very close to the engine) are reported in the following Figure 16, Table 4, Figure 17, and Table 5.
Figure 16. Correlation levels between MAPO and Int audio knock index
Point # rpm-mbar Cyl. 1 Cyl. 2 Cyl. 3 Cyl. 4
1 2000-1300 91.54% 89.74% 92.66% 91.19% 2 2500-1500 77.12% 63.84% 85.52% 71.35% 3 3000-1500 69.41% 40.17% 65.49% 63.36%
Table 4. Correlation levels between MAPO and Int audio knock index
40% 50% 60% 70% 80% 90% 100% 1 2 3 Co rr e lation Level [% ] Operating Point
MAPO vs Int
Cyl 1 Cyl 2 Cyl 3 Cyl 420
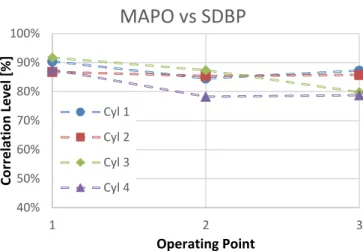
Figure 17. Correlation levels between MAPO and SDBP audio knock index
Point
# rpm-mbar Cyl. 1 Cyl. 2 Cyl. 3 Cyl. 4
1 2000-1300 91.82% 86.32% 92.60% 89.61% 2 2500-1500 82.30% 77.39% 86.98% 73.48% 3 3000-1500 84.58% 83.07% 78.15% 77.18%
Table 5. Correlation levels between MAPO and SDBP audio knock index.
By analyzing the results reported above, it may be noted that Int knock index shows high correlation levels for the first operating point, but it highlights a decreasing trend when engine speed increases. On the other hand, the SDBP index presents a more stable behavior for the three operating conditions examined, and very high correlation levels. Lee et al. [11] explain these two different trends by analyzing the behavior of the combustion chamber natural frequencies. When the engine runs at high speed, the contribution of the higher resonating modes becomes preponderant with respect to the resonances related to lower frequencies. As already clarified, Int index considers only one frequency band, whereas SDBP index takes into account also the natural frequencies that become more relevant when the engine runs at higher speeds. Based on such considerations, SDBP has been chosen as the sound-based knocking index to be implemented in the real-time knock control strategy.
It should finally be noted that the correlation levels presented in Figure 5 are particularly high. Slightly lower correlation levels were in fact obtained for the same data set by using the standard, production type accelerometer mounted on the engine for knock detection and control.
2.1.3 Turbocharger speed measurement
The characteristic sound emitted from the turbocharger group contains useful information strictly related to its rotating speed. In fact, when the blades rotate inside the compressor they generate pressure waves, which can be perceived by the human ear as a whistle. The frequency of the sound emission is related to the compressor speed and to the number of its blades. Once the number of
40% 50% 60% 70% 80% 90% 100% 1 2 3 Co rr e lation Level [% ] Operating Point
MAPO vs SDBP
Cyl 1 Cyl 2 Cyl 3 Cyl 421 blades is known, turbocharger speed can be detected in real time through an acoustic signal processing stage, based on a time-frequency tracking algorithm. The algorithm has been optimized for on-board application, and implemented into a dedicated device.
Figure 18 shows a comparison between direct and indirect turbocharger speed measurements, during a
load transient profile carried out on the test bench. In particular, the direct speed measurement is performed with an eddy current, laboratory-type, turbo speed sensor, whereas the indirect speed measurement results from the acoustic emission analysis algorithm. The microphone used to capture the sound trace has been positioned in front of the compressor, in the location that presents the highest Signal-to-Noise Ratio (SNR).
Figure 18. Comparison between direct and indirect turbocharger speed measurements
2.1.4 Simultaneous monitoring of turbocharger speed and knock intensity
The results that have been shown so far, in terms of knock detection capability and turbocharger speed measurement by using the engine’s acoustic emissions, were related to the best microphone position associated to each task. The simultaneous detection of both signals with high SNR is unfeasible when using either of the identified positions. If a limited reduction of the SNR is accepted, it could be possible to identify a position (on the intake side, below the intake manifold) that enables both measurements to be performed, using the very same microphone. Figure 19 shows the comparison between direct (uEpsilon) and indirect turbocharger speed measurements, for such “compromise” position of the microphone, as previously presented in Figure 6 (for the “best” turbocharger speed detection position, in that case).
22
Figure 19. Comparison between direct and indirect turbocharger speed measurements.
By comparing Figure 18 and Figure 19, it turns out that the new position of the microphone does not jeopardize at all the turbo speed indirect measurement.
Regarding the knock detection, the new identified position (defined as “compromise” location) guarantees fully comparable results (Figure 20 and Table 6) with those associated to the “best” knock detection position.
Figure 20. Correlation levels between MAPO and SDBP audio knock index.
Point # rpm-mbar Cyl. 1 Cyl. 2 Cyl. 3 Cyl. 4 1 2000-1300 95.37% 94.40% 95.40% 90.07% 2 2500-1500 89.12% 84.40% 93.95% 80.66% 3 3000-1500 86.05% 79.10% 87.78% 78.12% Table 6. Correlation levels between MAPO and SDBP audio knock index.
23
2.2 Knock control strategy implementation in real ECU
In the previous paragraphs the feasibility of using the acoustic emission as knock information source has been proved and implemented in real time. In this part of the study, the possibility to switch from accelerometer to acoustic signal source only performing a recalibration procedure is demonstrated. For the tests, the engine control has been managed by means of a Magneti Marelli standard ECU. The knock control strategy implemented in the ECU has been the same used in the standard accelerometer-based production system. Knock has been externally induced by applying controlled spark advance increments. The MAPO defined by equation 2 has been considered as the reference pressure-based knocking index, expressed in bar.
To maintain only the knock-related information contained in the in-cylinder pressure signal, it has been high-pass filtered at 5 kHz. The observation window adopted for MAPO evaluation starts from the Top Dead Center (TDC) and ends at 70 crankshaft angle degree (CAdeg) after Top Dead Center (ATDC), for all the tests that have been executed. In order to assess the ability of the audio-based knock system to maintain a light knock intensity, and to compare it to the standard, accelerometer-based one, an empirical MAPO value limit considered as Light Knock Intensity Threshold (LKTH) has been set as shown by equation 2.6, in bar.
𝐿𝐾𝑇𝐻 =
EngineSpeed [rpm]2000 [𝑟𝑝𝑚
𝑏𝑎𝑟]
(2.6)
Furthermore, a second MAPO limit, in this case as High Knock intensity Threshold (HKTH) has been defined by equation 2.7.
𝐻𝐾𝑇𝐻 =
EngineSpeed [rpm]1000 [𝑟𝑝𝑚
𝑏𝑎𝑟]
24 This distinction is useful to set an appropriate trade-off between performance and engine safe operating conditions.
Table 7 collects the engine operating conditions and the corresponding MAPO limits for light and high knock. Engine speed [rpm] Load MAPO Light knock threshold (LKTH) MAPO High knock threshold (HKTH)
2000 WOT 1.00 [bar] 2.00 [bar]
2500 WOT 1.25 [bar] 2.50 [bar]
3500 WOT 1.75 [bar] 3.50 [bar]
Table 7. Engine operating conditions investigated during the tests.
The aim of this study is to demonstrate the possibility of substituting the accelerometer with a microphone as provider of knock intensity information in a standard engine management system, by only performing a knock detection strategy recalibration process. To evaluate the actual possibility to switch the standard knock control algorithm from vibration to sound, one of the hard constraints is that the structure of the knock index evaluated by the control system is to be the same for both signals. Recalibration procedure has involved only the parameters related to the knock observation windows (opening and closing crankshaft angles) and the ECU knock intensity thresholds. In particular, the mathematical structure of the Knock Index (KI) evaluated by the engine management system depends on the signal energy defined by Equation 2.8 [29].
Signal_energy =
1N
∑
x(i)
filt 6−16 kHz Ni=1
(2.8)
Where N is the number of samples acquired in the angular period, and band-pass filtered, by the ECU, in the range between 6 to 16 kHz. Considerations regarding the dynamics of the average signal energy,
25 its statistical distribution and the calibration efforts at the engine test bench, suggest to realize a logarithmic transformation by the following equation:
𝐾𝐼 = log (𝑆𝑖𝑔𝑛𝑎𝑙𝐸𝑛𝑒𝑟𝑔𝑦) − 𝜇 − 𝐾𝐼𝐻(𝑟𝑝𝑚. 𝑙𝑜𝑎𝑑)
(2.9)Where 𝜇 is the mean value of the statistical distribution estimated by a low pass filter applied to the current and previous estimated mean value, whereas KITH (RPM, load) is a threshold function of the engine operating point.
A detailed description of the algorithm implemented in the ECU can be found in a dedicated publication [29]. The main task that a knock controller should accomplish is the maximization of the engine performance (maximization of the combustion efficiency) while preserving the engine from damages caused by knocking combustion. Figure 21 illustrates the two typical operating regions of engine: the bottom area, indicated by “1”, is the non-knocking region, whereas the top area, labelled as “2”, is characterized by the onset of knocking combustions. The boundary line that divides the two regions represents the goal of the knock control strategy. When the engine runs at an operating condition located near the boundary line, it means that the maximization of the combustion efficiency has been achieved, while guaranteeing a non-damaging knock intensity level.
Figure 21. Main operating regions of engine: 1) non-knocking 2) knocking
2.2.1 Calibration procedure
In the first part of the calibration procedure, the study of the index, which will be used as control variable to measure the knock intensity, is performed. A comparison between MAPO and the
26 accelerometer/sound-based knock intensity indexes is carried out by the evaluation of the Pearson percentile correlation coefficient (eq. 2.5).
To investigate the feasibility of the indexes, their statistical populations have been acquired by forcing the spark advance to obtain the 2% of detonation combustions or, it is the same, 98thMAPO percentile = LKTH calculated on a statistical relevant number of engine cycles, e.g. from 3000 to 5000. It should
be noticed that the population is acquired under incipient knocking conditions, and heavy knock events – which means MAPO > HKTH, should be avoided as much as possible in this phase. Figure 22 describes an experiment at 2000 rpm WOT performed using the microphone as signal source; each blue dot defines the pair (MAPO, log(Signal_energy )-μ) calculated for each combustion, whereas the magenta and red vertical dashed lines describe LKTH and HKTH, respectively. The test was run at light knock conditions, and for this case the expected correlation level is relatively low (around 66%, as shown in the legend), as confirmed by the relatively large scatter in the data.
Figure 22. Example of knock threshold setting.
Figure 22 shows the first step of the calibration procedure. In this case, the goal of the procedure is to determine the KITH threshold level to be used in equation 2.9, so that KI would assume positive values only for knocking combustions. The elements that are present in Figure 22 are:
• Magenta vertical dashed line: Light Knock intensity Threshold (LKTH) • Red vertical dashed line: High Knock intensity Threshold (HKTH)
• Orange horizontal dashed line: it defines the threshold KITH that needs to be set.
By the analysis of Figure 22 it becomes possible to set the KITH to the appropriate level. In order to define the knock intervention threshold KITH, it is necessary to take into account that false positives, which occur when MAPO< LKTH and KI>KITH, have to be minimized because an intervention of
the control would uselessly worsen the performance by overly retarding the SA. This is also valid for false negatives that occur when KI<KITH and MAPO>LKTH; they are critical especially when
27
MAPO> HKTH because a heavy knock event has not been detected. Working in these conditions for
some consecutive cycles can be harmful for the engine.
Increasing KITH threshold would decrease the percentage of false negatives and would limit the intervention of the controller only for severe knock events. On the other hand, a lower threshold would let the controller intervene more often, increasing the percentage of false detections.
The knock intensity measured is performed for each cylinder, and the closed-loop reaction on the spark advance angle is performed before the subsequent combustion event.
The controller is constituted by a linear proportional integral regulator, with a time constant tunable depending on the engine operating point. It can apply Spark Advance (SA) corrections in both negative and positive directions, with respect to the optimum spark advance, depending on the difference between the knock intensity estimation and the threshold, set as a function of the engine operating point.
When knock is present, the controller reacts with a proportional term depending mainly on engine speed. Otherwise, when the knock intensity is below the threshold, an integral term corrects the spark advance to bring it closer the optimum value, at a tunable speed.
To validate the performance of the knock controller, a second phase is required. The thresholds KITH previously set, are refined by a dynamic procedure with the aim of investigating the capability of the controller in real time operation. The controller is initially switched off and certain values of SA are imposed to bring the system under heavy knocking conditions, with a certain MAPO percentile - e.g.
HKTH. Later, the control is activated and the settling time to bring the system under safe operating
conditions is monitored; in particular, the controller should lead the system to a 98th-MAPO percentile
equal or near to LKTH in order not to worsen the performance in terms of Indicated Mean Effective Pressure (IMEP). Knock Index (KI) both for accelerometer and microphone can be re-tuned to obtain the desired MAPO percentile under steady state conditions. Clearly, the settling time depends mainly on the gain of the proportional term, but the reliability of the index is also important to give the right correction and let the system get away from the dangerous zone.
Moreover, still in steady state conditions, when MAPO is stabilized, the controller should avoid severe oscillations of MAPO percentile, and it should react only in case of high knocking events. As a result of the calibration procedure previously described, the identification of angular
observation windows and knock control thresholds for accelerometer- and sound-based controllers has been achieved
28
2.2.2 Experimental results
After the calibration procedure, a series of validation tests for each operating point have been performed. To assess the overall performance of the system, two types of tests have been performed. The first test has been performed in steady state conditions. Initially, knock is forced by adding a spark advance increment to the value calculated from the base map, thus enabling the knock controller to take action. The controller response is then observed and evaluated after steady-state conditions have been reached again. The SA increment has been the same for the test run with the accelerometer and the microphone, since the aim of this experiment is the assessment of the steady-state calibration procedure.
Figure 23. Results for steady state test runs at 2000 rpm WOT for vibration.
29
Figure 25 Results for steady state test runs at 3500 rpm WOT for vibration.
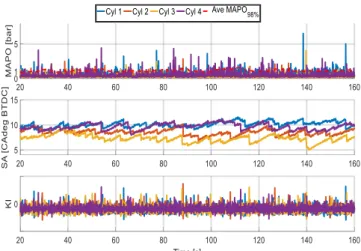
Figure 26. Results for steady state test runs at 3500 rpm WOT for sound.
By the comparison of the couples of figures 23-24 and 25-26, which compare the same test performed using the vibration and sound signals, it can be appreciated as, for both signal sources, the control system has approximately the same behaviour. For all the tests, the average MAPO percentile target has been reached. It is possible to see that the controller forces an oscillation of the MAPO percentile value around the target level (Table 7). In Figure 26, it can be noted a high frequency spark advance component superimposed to the normal oscillation, at low frequency, imposed by the knock controller. This behaviour can be due to the calibration of the controller proportional and integral gains, which have been maintained equal for the two knock information sources. The high frequency oscillation can be avoided by performing an appropriate calibration of these parameters. The false positive percentages detected during the steady state tests have been calculated and collected in Table 8 and Table 9. Very few events are misinterpreted.
False Positives percentage
Cylinder 1 Cylinder 2 Cylinder 3 Cylinder 4
2000 rpm 1.28% 1.14% 0.72% 0.48%
2500 rpm 1.31% 0.96% 0.74% 0.15% 3500 rpm 0.40% 0.68% 0.37% 0.51%
30
Table 8. Percentage of false positives occurred during the static test using accelerometer source.
False Positives percentage
Cylinder 1 Cylinder 2 Cylinder 3 Cylinder 4
2000 rpm 1.45% 0.03% 1.99% 2.39%
2500 rpm 0.72% 0.91% 0.42% 0.34%
3500 rpm 0.41% 0.94% 0.81% 0.90%
Table 9. Percentage of false positives occurred during the static test using sound source.
Table 8 and Table 9 show that the results obtained are similar for both the cases. The difference between the two detection methodologies is greater comparing cylinder 3 and 4 in the test at 2000 rpm, but the percentage values obtained are compatible with the standard production targets.
After the steady state validation, a transient test has been performed, with the purpose of comparing the stability and the reactiveness of the controller. In this case, the test starts under light knock condition (the spark advance actuated is the same calculated from the spark advance base map), and after a few seconds a manual spark advance increment is forced. After reaching steady state condition, an instantaneous reduction of the spark advance angle w.r.t. the base map is forced. The aim of this test is the assessment of the ability of reaching (and maintaining) light knock conditions from two opposite directions. Because the aim of the knock controller is not only to safeguard the engine integrity, but to reach the maximum thermal efficiency while respecting the knock limit calibrated by the engine manufacturer. In this case, the knock threshold (Table 7) is not only a border line for the engine integrity, but at the same time, it is a thermal efficiency target, and as such the engine should work as close as possible to this limit.
31
Figure 28. Results for transient state test runs at 2000 rpm WOT for sound
Figure 29. Results for transient state test runs at 2500 rpm WOT for vibration.
32
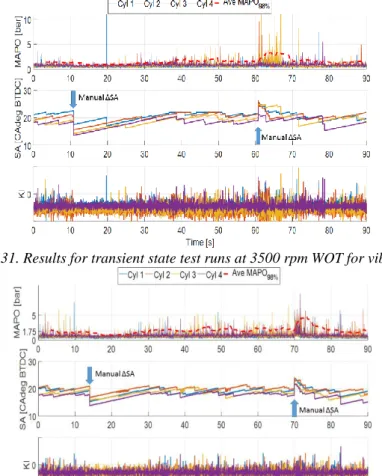
Figure 31. Results for transient state test runs at 3500 rpm WOT for vibration.
Figure 32. Results for transient state test runs at 3500 rpm WOT for sound.
As in the previous case, the couples of figures 27-28, 29-30 and 31-32, compare the same type of test performed during different engine operating conditions, using the vibration and sound sources. It is clearly emphasized how the control system tracks the light knock condition, keeping the engine in an oscillation around the MAPO percentage target similar to the calibration value, both in the case of increment or decrement of the spark advance from the base condition, and for both sound- and vibration-based systems. The time needed to recover a target condition (recovery time) is similar for the two systems based on different sensors, and the steady-state SA values (and the corresponding knocking levels) reached after rejecting the disturbance are also very similar, demonstrating the feasibility of a sound-based knock-controller based on the very same signal processing architecture as the production one, based on accelerometer sensors.
33
2.3 Knock detection for motorcycle engines
In this section, it will be firstly presented the experimental setup used to collect knocking data from a motorcycle engine, then a first analysis of pressure, sound and vibration knock indexes will be shown. The discussion will then move towards calibration and optimization of acoustic and vibration indexes.
The application of acoustic and accelerometer sensors to knock detection has always been considered critical at high engine speeds, mainly due to increasing background mechanical noise. This field of application is today of key importance for motorbike engines, since they will be subjected to more stringent regulations in near feature [30]. Adopting on-board knock systems able to operate at high rotational speeds could open both to performance increase of the engine, as well as fuel quality recognition and, to a lower extent, to a reduction of mixture enrichment, thus improving fuel consumption.
2.3.1 Experimental setup
In the interest of assessing the capability to detect knocking combustions in motorcycle engines using accelerometers and low cost microphone sensors, experiments have been carried out on the chassis dynamometer using a motorbike equipped with an engine that can reach up to 13,000 rpm. To perform the test, the engine has been equipped with in-cylinder pressure sensors (Kistler 6052). No one knock sensor is present on the engine in the production configuration. A standard accelerometer, mounted on the engine head, has been added. The engine acoustic emissions have been acquired by means of a microphone-based sensing device, developed by Magneti Marelli. All signals have been acquired simultaneously at high frequency (200 kHz) [3]. All the experimental tests have been executed in full load condition, the operating condition more affected by knock [8]. Knock has been externally induced by applying controlled spark advance increments. The engine operating points taken into consideration during the tests are listed in Table 10.
Engine speed [rpm] Load
3000 WOT 5000 WOT 6000 WOT 8000 WOT 10000 WOT 11000 WOT 13000 WOT
34
2.3.2 In-cylinder pressure analysis
The extremely rapid combustion of the end gas produces pressure waves, which spread out inside the combustion chamber. The characteristic frequencies of knock pressure waves are influenced by the chamber geometrical dimensions and by the gas thermodynamic state. In literature the combustion chamber has been modelled as a planar circular membrane, and under this simplification it becomes possible to calculate its natural frequencies by using equation 2.1.
When knock occurs, it becomes possible to identify a high frequency vibration in the in-cylinder pressure signal, typically starting after Top Dead Center (TDC). By comparing, in the frequency domain, the pressure traces related to the power stroke of engine cycles with and without knock, it clearly emerges that, in knock cycles, more energy is present in the frequency bands near to the combustion chamber resonant modes.
For the engine taken into account in this study, the combustion chamber natural frequencies are reported in table 11.
Wave number Frequency [kHz]
0,1 15.62 0,2 28.67 0,3 42.13 1,0 7.53 1,2 21.80 1,3 34.89 2,0 12.27 2,1 27.61 2,3 41.51
Table 11. Engine combustion chamber natural frequencies.
Knock intensity can be calculated using different methods. In the scientific literature, it is possible to find different indexes definition [11,30,33]. The index taken more often as a reference in the literature is the Maximum Amplitude of Pressure Oscillations (MAPO), in the high frequency range. For the first analysis step, the in-cylinder pressure is high pass filtered at 5 kHz, then MAPO has been evaluated for all engine cycles by equation 2.2.
Based on their MAPO value, engine cycles have been divided in three groups: 1. No knock cycles;
2. Knock cycles; 3. Heavy knock cycle.
35
Figure 33. Engine cycles classification based on MAPO values.
Figure 33 shows, as an example, the classification of engine cycles for the test run at 3000 rpm. It can be seen how engine cycles are divided into the three categories according to their MAPO: no knock (below 3 bar), knock (between 3 bar and 10 bar) and heavy knock cycles (above 10 bar). The two threshold values have been set based on previously defined criteria, and their definition is beyond the scope of this work. To clearly show the different characteristics between no knocking and knocking cycles, the combustions with MAPO lower than 3 bar and greater than 10 bar have been compared in the frequency domain. This type of analysis allows identifying the effects related to knock on the in-cylinder pressure signals, and removing the noise related to other sources. The expansion strokes have been extracted from the pressure cycles using a Hanning window.
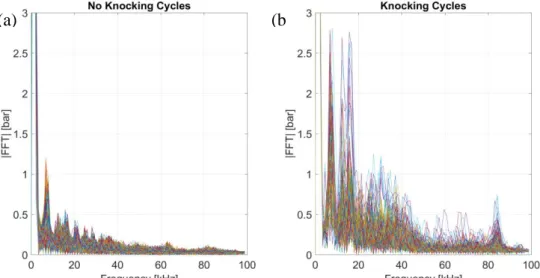
Figure 34. In-cylinder pressure frequency analysis under no knock (a) and knock condition (b), for the test run at 3000 rpm.
Figure 34 compares the expansion strokes of the engine cycles in no knocking condition (Figure 34.a) and in knocking condition (Figure 34.b), for the test that has been executed at 3000 rpm. Comparing the spectrums, it is clear that, in “normal” cycles, the high frequency has lower energy values. Furthermore, as it can be seen in Figure 34.a, an energy peak is present at the frequency corresponding
Frequency of first combustion chamber resonant mode
(a) (b
36 to the first combustion chamber natural mode. This phenomenon can be due to the high combustion velocity, which excites this resonant mode. When knock occurs, energy related to highest modes may increase up to six times compared to normal conditions, for the example showed.
Figure 35. In-cylinder pressure frequency analysis under no knock (a) and knock condition (b), for the test run at 13,000 rpm.
The same comparison that has been done in Figure 34 is reported in Figure 35 for the test run at 13,000 rpm. In this case, the energy related to the first resonant mode increases its value twice from normal combustions to knocking combustions, whereas for the highest resonant modes the energy increases much more.
By the analysis of all the tests that have been acquired, the greater energy variations between no knocking and knocking conditions are associated to the higher frequency resonant modes. Taking into consideration that in the normal use of this type of vehicles the engine runs at high speed for the majority of the time, the high-pass frequency for the filter used to calculate the reference knock index, MAPO, has been set to 10 kHz in order to give more importance to the highest frequencies.
2.3.3 Accelerometer and microphone signals analysis
Part of the combustion-related information contained in the in-cylinder pressure trace can be found in both vibration and acoustic signals. In the second step of the analysis, accelerometer and acoustic signals acquired with low-cost, automotive-type sensors have been compared with in-cylinder pressure spectrum in the frequency domain.
The following Figure 36 and Figure 37 show the comparison between vibration traces acquired during the test run at 3000 rpm (Figure 36) and 13,000 rpm (Figure 37), for the same cycles that have been shown in Figure 34 and Figure 35. As for the pressure trace, in the acceleration signal the highest frequencies contain more energy during knocking combustions than during standard operation.
(a) )
(b )
37
Figure 36. Accelerometer frequency analysis under no knock (a) and knock condition (b), for the test run at 3000 rpm.
Figure 37. Accelerometer frequency analysis under no knock (a) and knock condition (b), for the test run at 13,000 rpm.
By the analysis of Figure 37, and considering also the data shown in Figure 35, it is possible to see that a strong reduction of the amplitude of the frequencies higher than 25 kHz is present. This attenuation is due to the characteristics of the accelerometer transducer. After this analysis, it is clear that the frequency range useful for accelerometer-based knock intensity measurement is limited between 10 and 25 kHz.
The very same comparisons (Figure 38-Figure 39) and observations have been done for the acoustic signals. In this case, the bandwidth of the microphone can reach 40 kHz. The frequency range that has been chosen for the audio-based knock analysis is between 10 and 40 kHz.
(a ) (b ) (a ) (b )
38
Figure 38. Acoustic signal frequency content under no knock (a) and knock condition (b), for the test run at 3000 rpm.
Figure 39. Acoustic signal frequency content under no knock (a) and knock condition (b), for the test run at 13000 rpm.
The mathematical structure of the knocking indexes based on accelerometer and acoustic signals is shown in the following equations 2.10 and 2.11.
INT_𝐴𝑐𝑐 = 1 𝑁∑ |𝐴𝑐𝑐𝑓𝑖𝑙𝑡| → 𝑁 𝑖=1 𝑓𝑖𝑙𝑡 𝑏𝑎𝑛𝑑: 10 − 25 [𝑘𝐻𝑧] (2.10) INT_𝑆𝑜𝑢𝑛𝑑 = 1 𝑁∑ |𝑆𝑜𝑢𝑛𝑑𝑓𝑖𝑙𝑡| 𝑁 𝑖=1 → 𝑓𝑖𝑙𝑡 𝑏𝑎𝑛𝑑: 10 − 40 [𝑘𝐻𝑧] (2.11) Where N is the number of samples contained in the chosen angular observation window.
A specific, integral signal processing stage for both knocking indexes has been chosen in order to avoid incorrect knock intensity evaluation due to the noise present inside such signals. In fact, by applying a knock index structured as MAPO to a signal that can be influenced from other information, high frequency sources, can lead to an incorrect evaluation of knock intensity, since one single sample of the signal is considered. The integral structure allows to minimize the influence of the random noise inside the signal.
39
2.3.4 Filter design
In order to isolate the frequency information related to the knock phenomenon, the signals coming from the accelerometer transducer and the microphone must be filtered before calculating the knock indexes. Different types of digital filters can be applied to a signal to isolate specific characteristics. Each filter has specific characteristics in terms of ripple in the stop and pass band, and slope. Increasing the order of the polynomial that constitutes the mathematical representation of the filter allows approaching the ideal behaviour.
To select the better filter type able to ensure the highest signal to noise ratio, a performance analysis has been done comparing different filter types. The bandpass filter types that have been compared are:
• Elliptic 6° order • Butterworth 4° order • Butterworth 20° order • Chebyshev Type I, 6° order
• Ideal band pass filter (vertical response @ cutoff frequency). In Figure 40 the frequency response of the various filters is shown.
Figure 40. Frequency response of the filter tested.
Using the filters types listed previously, MAPO and both the vibration and sound knock indexes have been calculated. To assess the performance of the different filter types, the linear correlation between MAPO and the alternative knock indexes has then been calculated. Accelerometer-based knock indexes have been calculated using an observation angular window starting at Top Dead Center (TDC) and closing 70 crankshaft degrees after. For sound-based knock indexes, the observation window has been shifted forward considering the sound propagation speed by means of Equation 5,
40 while the window angular duration was maintained equal to 70 CAdeg. These window positions and durations are assumed as baseline configurations for the two types of detection systems.
By knowing the distance between the microphone and the sound source, it becomes possible to estimate the angular delay as a function of the engine speed (Equation 2.12):
s
C
rpm
dist
ay
AngularDel
6
*
(2.12) Where:dist.: distance between sound source and microphone, rpm: engine speed,
Cs: sound speed.
Figure 41. Correlation level obtain using different digital filters for accelerometer-based knock index.
Figure 42. Correlation level obtain using different digital filters for sound-based knock index.
The effort required to the ECU microcontroller to apply the Elliptic 6th order, Chebyshev 6th order
41 automotive ECUs while the Butterworth 20th order filter has been considered as an example of an
approximation of an ideal filter.
From Figure 41and Figure 42 it is possible to observe that the accelerometer-based knock index is more sensitive to the filter type. In particular, at the maximum speed the correlation level changes of about 10% if calculated by means of Chebyshev filter or by the Butterworth 4th order. Bearing in mind the ECU constraints and the filter performance, the Butterworth 4th order has been chosen to calculate the knock index based on vibration and acoustic sources.
2.3.5 Window Definition
Knock is a phenomenon that typically develops during the expansion stroke, in an angular range close to the TDC. The pressure waves, due to the extremely rapid combustion of the end gas, spread inside the cylinder while the piston moves towards Bottom Dead Center (BDC).
Figure 43. Knock cycle acquired during the test run at 3000 rpm.
As an example, in Figure 43 a knock cycle is shown. Since the knock is associated to the expansion stroke, only a portion of the in-cylinder pressure, vibration and sound signals is relevant. Using a knock index structured as a mean value, the angular observation window becomes very important. Indeed, assuming that knock waves are phased out in 70 degrees after TDC, using a knock observation window starting from TDC up to 100 degrees ATDC, the index value becomes mainly affected by the end part of the window, where the phenomenon is attenuated. For that reason, the index could become less sensitive to a small knock intensity variation. Also, in figure 43 both corresponding vibration and sound signals are shown. It can be seen how the two signals are characterized by a high frequency oscillation in the region close to TDC. The vibration signal that has been acquired from the accelerometer apparently develops high frequency variations in the same position of the pressure oscillation, but a small delay occurs due to the finite velocity of the pressure waves that spread through the engine block to the accelerometer. More evident is the delay between the knock onset of the pressure and the sound wave (sound waves spread at lower velocity in the air that in the metal of the engine block). Furthermore, the sound emissions of knock can have a greater lifetime due to refraction
42 phenomena. Considering this observation, moving the starting angle of the acoustic observation window forward may lead to a benefit in terms of higher correlation levels between pressure knock indexes and alternative ones. As a consequence, it should exist a combination of window starting angle and angular duration that maximizes the correlation levels between the indexes.
The identification of the best combination of the two parameters mentioned above is a time consuming experimental activity. Aimed at identifying how the correlation level is influenced by the observation window location and width, for all the tests that have been executed, a correlation map has been calculated off-line. Starting from in-cylinder pressure, acceleration and sound signals acquired on the chassis dynamometer, knock indexes have been calculated for different observation points. Specifically, the knock indexes have been calculated using a 4th order Butterworth digital filter. The angular window on the in-cylinder pressure for MAPO evaluation has been maintained from TDC to 70 cadeg ATDC for all the evaluations. For both acceleration and sound emissions the start angle and the duration have been varied in a wide range of values, in order to identify which combination of these two parameters may provide the highest correlation level.
(a )
(b )
43
Figure 44. Correlation level maps for accelerometer signal. (a) test run at 3000 rpm (b) 8000 rpm (c) 13000 rpm.
Figure 45. Correlation level maps for sound signal. (a) the test run at 3000 rpm (b) 8000 rpm (c) 13000 rpm.
(c ) (a ) (c ) (b )