Analysis of the variation in the
hsp70-1 and hsp90
a mRNA
expression in human myocardial
tissue that has undergone
surgical stress
Simona Storti, Simona Vittorini, Maria Rosaria Iascone, Monica Sacchelli, Alessandra Baroni,
Vincenzo Stefano Luisi, Adrian Crucean, Vittorio Vanini, Andrea Biagini, and Aldo Clerico
Clinical Physiology Institute, G. Pasquinucci Hospital, National Research Council, Massa, ItalyAbstract In the present work we reported a semiquantitative detection of messenger ribonucleic acids (mRNAs)
en-coding the human heat shock proteins Hsp70-1, the stress inducible member of the HSP70 family, and hsp90a, the inducible member of the HSP90 family. We investigated the change in the expression of these mRNAs in tissue samples taken from the right atrium of 48 pediatric patients, soon after the ischemic period during surgery to correct congenital heart diseases, in which a crystalloid cold cardioplegic solution was used. No significant variations were found for either hsp70-1 or hsp90a expressions. Moreover, we searched for an association between the hsp70-1 promoter region polymorphism and the expression of thehsp70-1 in a smaller group of these patients (n527). The
2110AA genotype was on average significantly associated with a decrease in thehsp70-1 mRNA level (P ,0.05), whereas the other genotypes2110AC or2110CC did not seem to be associated with thehsp70-1 expression level. The lack of any observed increase in the hsp70-1 expression level may be due to the high basal level of the Hsp70 protein in the tissues examined.
INTRODUCTION
In response to adverse environmental changes, cells from many organisms increase the expression of a large class of proteins known as heat shock or stress proteins (Hsps), each named according to its molecular weight (Benjamin and McMillan 1998). Numerous studies have shown that synthesis of HSPs is enhanced to protect cells against various stress conditions, such as elevated temperature, exposure to heavy metals, as well as ischemia (Knowlton et al 1991). Indeed, HSPs act in protecting nascent or denaturated proteins from aggregation, assisting their folding or refolding into the correct conformation or their degradation after an
ir-Received 17 April 2002; Revised 20 August 2002; Accepted 12 September 2002.
Correspondence to: Dr. Simona Storti, Tel: 493621; Fax: 39-0585-493601; E-mail: [email protected].
reversible damage, as well as in the translocation of damaged proteins.
The induction of hsp70 gene expression by ischemia as well as an inverse correlation between the gene expres-sion of hsp70 and the infarct size have been previously demonstrated in some animal models, as recently re-viewed (Benjamin and McMillan 1998). In a preliminary study, we investigated whether ischemic stress, induced by cardiopulmonary bypass (CPBP), can affect the ex-pression of hsp70-1 in the right atria of pediatric patients undergoing surgery for congenital heart defect (CHD) (Storti et al 2001). Our results showed no significant changes in the hsp70-1 messenger ribonucleic acid (mRNA) expression, the stress-inducible gene of the HSP70 family, in atrial tissue after aortic cross-clamping (CC).
To better clarify whether the Hsps could have a car-dioprotective role during surgical stress, we also
mea-sured the expression of hsp90a, the inducible member of the HSP90 family, together with that of hsp70-1 in human right atrium tissue samples, collected before and soon af-ter the end of the aortic CC in 48 pediatric patients who had undergone surgery for CHD. Furthermore, we searched for an eventual association between the poly-morphism of the hsp70-1 promoter region and the mRNA expression level to explain the lack of expression varia-tions in the hsp70-1 gene during cardiac surgery. For this reason, we also genotyped 27 of these patients for this polymorphism.
MATERIALS AND METHODS Patients
We examined 48 pediatric patients (ages ranging from 3 months to 15 years) undergoing elective surgical cor-rection of CHD, 25 being affected by tetralogy of Fallot (TOF), 7 by ventricular septal defect (VSD), 1 by atrial septal defect (ASD), 4 by atrioventricular canal defect (AVCD), 4 by mitralic insufficiency (MI), 1 by double outlet right ventricle (DORV), 2 by ASD 1 VSD, 3 by aortic stenosis (AoSt), and 1 by anomalous partial pul-monary venous return (APPVR). Before the surgical procedure no patient was taking drugs nor was ex-posed to maneuvers known to increase blood pressure. CPBP was established with a crystalloid cold cardio-plegic solution. During surgery, the mean CC temper-ature was 28.158C 6 4.04 (average 6 standard devia-tion). Mean CPBP time was 1206 33 minutes and mean CC time was 75 6 26 minutes. Patients were divided into 4 groups according to their clinical condition and the gravity of their disease. These groups are shown in Table 1 along with the patients’ ages, diagnoses, CPBP and CC times and temperatures, and pO2 (mmHg) at the beginning of surgery under ventilation.
Two sequential samples were taken from a myocar-dial site in the right atrium discarded during the sur-gical intervention: the first specimen (right atrium 1 [RA1]) was obtained on average 20 minutes after the sternotomy, before any surgical manipulation of the heart. The second specimen (RA2) was obtained adja-cent to the first one, outside the purse string, immedi-ately after the end of the aortic CC. The duration of anesthesia up to the time that the RA1 specimen was taken as well as the total volume of the fluids admin-istered to each patient are shown in Table 1 as a sur-rogate marker of anesthesia and intraoperative stress. The specimens were immediately frozen in liquid ni-trogen and stored at2808C until analysis.
Informed consent was obtained from parents because all children were under 18 years of age, and the study protocol was approved by the local Ethics Committee.
Semiquantitative reverse transcriptase–polymerase chain reaction
Total RNA was extracted from each specimen by the Tri-pure Isolation Reagent (Roche Molecular Biochemicals, Mannheim, Germany) in a procedure based on the guan-idinum thiocyanide method (Chomczynski and Sacchi 1987). The integrity of each RNA preparation was deter-mined by electrophoretic fractionation through an aga-rose-formaldehyde gel; 1 mg of RNA was treated with a DNase RQ1 (Promega, Madison, WI, USA) and 300 ng underwent reverse transcription by means of an oligo (dT)12–18 priming (Gibco BRL Life Technologies, MD, USA), in a mix containing also 2mL of 53 Reverse Tran-scriptase buffer (Promega), 0.5mL of deoxynucleoside tri-phosphates 1.25 mmol/L concentration of each, (Amer-sham Pharmacia Biotech, Piscataway, NJ, USA), 5 U of RNasin (Promega), and 20 U of Moloney Murine Leuke-mia Virus (M-MLV RT) (Promega) and water up to a final volume of 10 mL. Another contemporary reaction in which no RT was added (No RT) was performed. The complementary deoxyribonucleic acids (cDNA) of glyc-eraldehyde 3 phosphate dehydrogenase (GAPDH) and each hsp target were coamplified in a multiplex polymer-ase chain reaction (PCR), using 2 couples of specific prim-ers. Primer sequences are summarized in Table 2 (Tang et al 1995). The PCR solution (final volume: 25mL) con-tained: 5 mL of the first strand cDNA solution, 1 mL of 1.25 mmol/L dNTP, 2.5mL of 103 PCR buffer, 0.8 mL of 50 mmol/L magnesium chloride, 0.3mmol/L of forward and reverse GAPDH and hsp70-1 or hsp90a primers. The annealing temperature was 588C for hsp70-1 and 638C for
hsp90a and 30 cycles were done in both cases. For each
sample, and for each target gene, 2 separate PCRs were performed from the same RT. The PCR products were resolved on a 6% polyacrylamide gel (19:1 acrylamide–
N,N-methyl-bis-acrylamide) stained by silver nitrate. The
densities of the GAPDH and hsp70-1 or hsp90a bands were analyzed by the NIH Image 1.60 software (devel-oped at the US National Institute of Health and available on line at http://rsb.info.nih.gov/nih-image/). The cal-culations were made as follows: first, the ratios between the hsp70-1 or hsp90a and GAPDH band densities were calculated; second, the variation of the hsp70-1 or hsp90a expression in RA2, referred to as RA1 expression taken as baseline, was evaluated for each sample and for the 2 different PCRs; third, the average of the 2 results was calculated.
hsp70-1 Promoter polymorphism detection
DNA was extracted from myocardial tissue from 27 patients by the Tripure Isolation Reagent (Roche Molecular
Biochem-Table 1 Characterization of patients and changes in hsp70-1 and hsp 90a mRNA expression
Id Ages Sex Diagnosis
Disease severity Geno-type RA 2 hsp70-1 RA 2 hsp90a CPBP time (min) CC time (min) CC temp (8C) Anes-thesia dura-tion (h) VFI (ml) pO2 (mmHg) 1 2 3 4 5 3m 6m 3y 9y 8m F M F F M ASD1VSD ASD1VSD MI AVCD TOF II II II II IV aa cc ac 0.6 0.7 0.2 2.4 0.3 no 90 1.7 1.4 2.5 0.6 106 116 163 95 135 48 69 113 60 75 27 24 24 26 20 5.5 4.5 6.6 4.2 5.0 190 490 900 1900 260 367 206 167 251 283 6 7 8 9 10 3y 14y 2y 2y 12y M F F F M TOF MI MI TOF TOF IV II II IV III aa ab ac cc aa 1.0 0.8 0.9 0.8 0.4 1.8 1.1 1.2 0.6 1.2 195 155 105 140 130 105 90 70 70 85 23 20 24 25 13 6.0 6.0 4.0 4.8 5.5 1330 2100 300 400 1100 75 66 525 43 168 11 12 13 14 15 10m 4y 11y 1y 1y F F M M M TOF AoSt TOF TOF TOF IV II III IV IV aa cc aa aa 0.9 1.1 0.5 0.8 0.7 0.3 2.6 1.1 no 90 no 90 145 126 124 113 113 94 88 80 72 63 25 30 33 35 27 5.0 4.6 5.0 5.0 4.0 470 550 900 250 500 42 148 63 239 70 16 17 18 19 20 4m 3y 3y 7y 1y F M M F F AVCD TOF TOF TOF TOF II IV IV IV III aa cc ac ac ac 1.0 1.7 0.7 0.8 1.7 1.5 no 90 0.9 no 90 0.7 187 113 136 139 136 107 66 87 57 87 26 31 25 30 25 6.0 4.5 5.0 5.0 5.5 125 520 960 2000 880 157 71 33 130 47 21 22 23 24 25 7m 6m 6m 9m 4m F M F M TOF TOF TOF TOF VSD III III IV IV IV aa 0.4 0.7 2.3 1.0 0.8 0.9 1.6 0.7 0.9 0.3 128 120 160 130 75 71 83 95 87 55 32 31 20 28 24 4.5 4.5 5.5 5.0 4.0 510 265 315 440 280 401 62 120 149 118 26 27 28 29 30 10m 2y 8m 3y 3y M M F M M TOF TOF TOF DORV VSD III III III IV II 0.5 0.4 1.9 0.6 0.7 1.2 0.9 0.8 1.0 0.7 95 130 145 116 91 62 71 105 83 53 28 27 29 31 33 5.7 5.0 6.0 5.8 4.3 360 410 470 650 800 67 129 29 255 557 31 32 33 34 35 13y 3m 8m 7y 15y F F M M M TOF VSD1PI AVCD AoSt AoSt III II II II IV 0.6 2.6 0.8 1.4 1.3 1.0 1.1 0.9 1.0 1.0 153 126 142 57 219 42 68 84 28 132 24 28 31 30 30 6.8 5.6 5.0 3.5 7.5 1500 460 800 3000 3400 117 287 180 318 328 36 37 38 39 40 11y 2y 2y 3y 3m M M F F M TOF TOF TOF ASD VSD II III III I IV cc bc 1.3 1.6 2.6 0.8 1.2 0.76 1.1 1.0 1.5 1.2 129 124 161 46 143 69 73 87 13 105 20 20 32 31 31 5.8 5.7 5.0 3.7 6.0 1140 1220 830 350 300 76 49 48 203 215 41 42 43 44 45 3m 10m 9y 13y 7m F F M M F AVCD VSD APPVR MI TOF III II II II IV ac bc bc ac 1.1 1 1.8 0.2 0.7 0.7 0.8 1.6 1.0 0.9 123 68 94 166 169 78 35 56 97 138 26 32 32 32 22 5.5 4.2 5.0 6.6 5.5 410 220 900 700 330 99 215 672 178 120 46 47 48 8m 2y 10m M F F TOF VSD VSD III II II ac ac ac 1.3 1.1 0.7 0.9 0.8 0.7 130 68 96 68 38 56 20 27 29 5.8 4.6 6.0 250 610 220 108 185 380 3m–15y average 1.07 1.01 125 75 28.15 5.2 754 175 st dev 0.59 0.41 35 26 4.04 0.84 696 142
y5years, m5months, TOF5Tetralogy of Fallot, DORV5Double Outlet Right Ventricle, AoSt5Aortic Stenosis, APPVR5Anomalous Partial Pulmonary Return, ASD5Atrial Septal Defect, VSD5Ventricular Septal Defect, MI5Mitralic Insufficiency, AVCD5Atrioventricular Canal Defect, genotype5hsp70-1 promoter region genotype; VFI, volume of intraoperatory fluid; h, hour, RA2hsp70-15changes in mRNA hsp70-1 level, RA2 hsp90a 5changes in mRNAhsp90alevel.
icals). The genotyping protocol for the promoter region polymorphism was taken from Cascino (Cascino et al 1993, Table 2), with some modifications. Briefly, 50 ng of DNA was amplified with 10 mol/L of each specific primer in 25 mL of total reaction volume, with an annealing temperature
of 558C. Five microliters of PCR product was loaded on a 10% polyacrylamide (29% acrylamide, 1% bis-acrylamide in Tris Boric EDTA-TBE-buffer (TBE buffer) gel vertical plate 20 cm in length, run at room temperature for 22 hours, at 18 mA in TBE buffer 13, and then stained by silver nitrate.
Table 2 Primer sequences and polymerase chain reaction product size Gene Primer sequences Primer F Primer R Product size (bp) hsp90a hsp70-1 GAPDH hsp70-1 Promoter polymorphism ACAAGCACATATGGCTGGACAGCA CTAGCCTGAGGACTGGCTGCGACA GAGTCAACGGATTTGGTCGT CGCCATGGAGACCAACACCC TTCAGTTACAGCAGCACTGGTATC GTTCCCTGCTCTCTGTCGGCTCGG GGTGCCATGGAATTTGCCAT GCGGATCCGCGGTTCCCTGCTCTC 342 205 156 496 RESULTS DNase 1 treatment
DNase 1 treatment is usually done after total RNA ex-traction to assure that no genomic DNA is contaminating the RNA solution (Grillo and Margolis 1990). In the ab-sence of genomic DNA contamination, the cDNA synthe-sis reactions, performed without RT (No RT), and the sub-sequent PCR gave no products (data not shown).
Expression ofhsp70-1
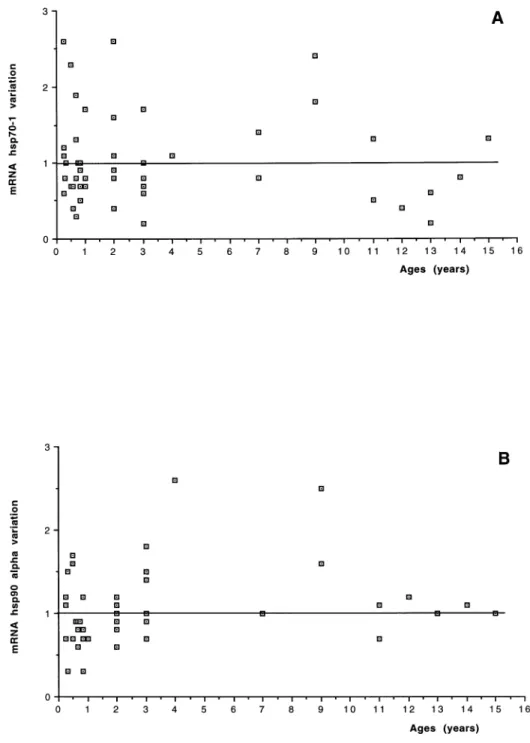
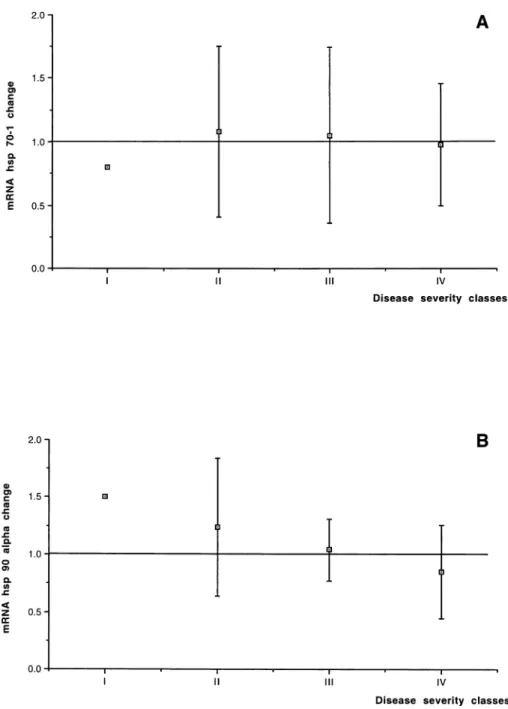
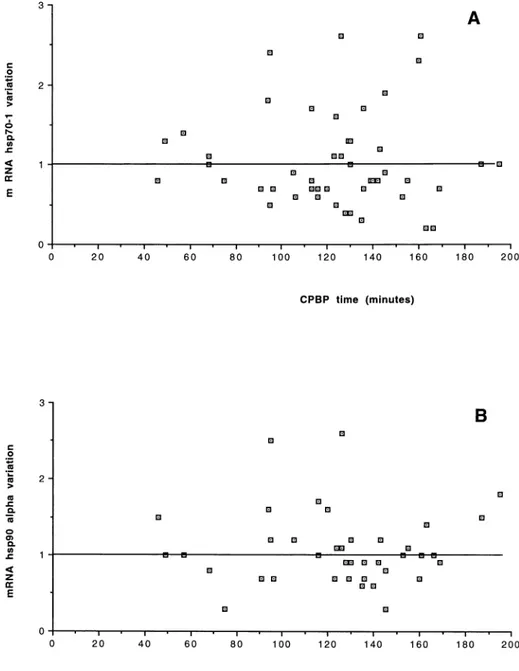
The results of hsp70-1 expression changes in the RA2 bi-opsy, compared with the mRNA expression in the RA1 biopsy considered as baseline in all 48 pediatric patients, are shown in Table 1. On average, no change in the mRNA level was found in hsp70-1 expression (1.07- 6 0.59-fold the RA1 baseline value). No relationship be-tween changes in the hsp70-1 expression and patient age distribution, disease severity classes, or CPBP duration was found (Figs 1A, 2A, and 3A). Furthermore, no sig-nificant correlation was found between the expression changes and the CPBP time (R2 5 0.001, P 5 0.8201) or CC time (R25 0.0001, P 5 0.9435) or temperature (R25 0.004, P5 0.6886).
Expression ofhsp90a
The results of the measurement of hsp90a mRNA expres-sion in the 48 patients are shown in Table 1. On average, no variation in the mRNA level was found in hsp90a ex-pression when the values obtained after the aortic CC were compared with those measured before CC (1.01-6 0.41-fold the RA1 baseline value). No relationship was found between changes in hsp90a expression and patient age distribution, disease severity classes or CPBP dura-tion (Figs 1B, 2B, and 3B). No significant correladura-tion was found between the expression changes of hsp90a mRNA and the CPBP time (R2 5 0.001, P 5 0.8680) or the CC time (R25 0.001, P 5 0.8146) or temperature (R25 0.025,
P5 0.3130).
Analysis of thehsp70-1 promoter region polymorphism
Using the primers described by Cascino (Cascino et al 1993), a single 496–base pair product was obtained. On
the polyacrylamide gel, 3 bands of different mobility were interpreted as corresponding to different alleles and were named: a (slow), b (fast), c (intermediate). Variations among the 3 alleles were restricted to 2 sites: 2110 and 1120. At 2110 the a allele differed from b and c for the presence of an adenine instead of a cytosine. At1120 the b allele differed from a and c for the presence of a cyto-sine instead of a thymine.
Twenty-seven patients were analyzed for this poly-morphism, and the results are shown in Table 1. Indi-viduals could exhibit either 1 or 2 bands; the combi-nations found were the following: ‘‘ab’’ (2110AC, 1120TC) (1/27, fab 5 0.037), ‘‘ac’’ (2110AC, 1120TT) (10/27 fac 5 0.370), ‘‘bc’’ (2110CC, 1120CT) (3/27 fbc 5 0.111), ‘‘aa’’ (2110AA, 1120TT) (8/27 faa 5 0.296), and ‘‘cc’’ (2110CC, 1120TT) (5/27 fcc 5 0.185). The ‘‘bb’’ (2110CC, 1120CC) genotype has not been en-countered, as previously reported by Cascino (Cascino et al 1993). The genotype assortment was as expected from the Hardy-Weinberg equilibrium in the 3 allelic system; the calculated frequencies of the 3 alleles being as follows: fa 5 0.500, fb5 0.074, and fc5 0.426.
Relation betweenhsp70-1 promoter genotype and hsp70-1 mRNA expression
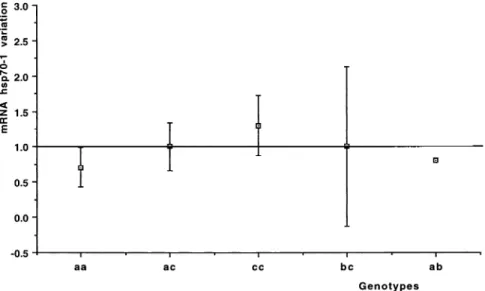
The ‘‘aa’’ genotype, found in 8 patients (3, 6, 10, 11, 14, 15, 16, 22), showed on average a significant decrease in the hsp70-1 mRNA level after the ischemic period (on av-erage 0.716 0.29, t-test P-value 5 0.025, Table 1). More-over, the only patient whose genotype was ‘‘ab’’ showed a decrease in the hsp70-1 mRNA level, whereas the other patients, characterized as ‘‘ac,’’ ‘‘bc,’’ or ‘‘cc,’’ had no sig-nificant changes of hsp70-1 mRNA expression before and after the ischemic period. Data from genotypic analysis are presented in Figure 4.
DISCUSSION
In our study we evaluated the change in hsp70-1 mRNA expression in biopsies from right atria of pediatric pa-tients undergoing surgery for CHD correction. During surgery, CPBP was established by means of a cold crys-talloid cardioplegic solution. Because of the young age of the patients, the samples collected were very small (8–20
Fig 1. Age distribution: relationship between age distribution of patients
and changes and hsp70-1 (A) or
hsp90a(B) expression.
mg). Consequently, a previously described semiquantita-tive method of quantifying mRNA expression from only 300 ng of total RNA (Storti et al 2001) was set up using the housekeeping GAPDH gene as an internal standard, on the assumption that its level would remain unchanged before and after the ischemic period. Before reverse-tran-scription, total RNA was treated with a DNase 1 and a No RT control was included (Grillo and Margolis 1990). The DNase I pretreatment is essential because hsp70-1 is an intronless gene (Wu et al 1985) and also because in genomic DNA there is a GAPDH pseudogene. Indeed, DNase I pretreatment eliminates the false positives that
can result from any preexisting DNA and could confuse the interpretation of results.
In our study, on average no variation of hsp70-1 mRNA expression was found after the ischemic period (1.07-6 0.59-fold the baseline value). However, a limitation of this study is that it has not been possible to have a truly base-line cardiac preparation with which to compare the in-traoperative surgical samples because the samples were taken from individuals who had severe cardiac disease and who often experienced varying degrees of patho-physiologic stresses before surgery. In fact, the first sam-ple represents a time point in which a patient has
under-Fig 2. Disease severity classes: re-lationship between the severity of pa-tient disease , classified from I to IV ac-cording to the minor or major gravity of the congenital heart disease, and changes inhsp70-1 (A) or hsp90a(B) expression.
gone an open sternotomy and this initial sample may re-flect a significant degree of stress already experienced by the patient. However, this protocol of study was the best we could set up because it was not possible to obtain a completely unstressed human cardiac preparation to use as baseline.
In our opinion, among the hypotheses that could ex-plain our result, 2 appear very interesting.
A first consideration may be done about the basal high level of the Hsp70 protein (Shi et al 1998) in pa-tients before cardiosurgery. In fact, it has been noted that in higher eukaryotes, the stress signal leads to the elevated expression of heat shock genes; stress induced
transcription requires activation of heat shock factors (HSFs) that bind to the heat shock promoter element. In unstressed cells, HSFs are maintained in an inert non–DNA-binding state. Upon exposure of cells to stress conditions, HSFs become activated to a DNA-binding, transcriptionally active state, which results in the preferential transcription of the heat shock genes. In stress conditions, Hsp70 stably associates with the heat shock factor 1 (HSF1), and so it functions as a re-pressor of transcriptional activity of the heat shock genes (Shi et al 1998). According to this hypothesis, a preexisting state of physiological stress, perhaps due in our patients to the congenital heart disease, can
pro-Fig 3. Cardiopulmonary bypass (CPBP) duration. Relationship between the duration of CPBP and changes and hsp70-1 (A) or hsp90a(B) expression.
voke an inhibition of the further transcription of all heat shock genes. In the present study, this hypothesis has been tested by the evaluation of the change in the expression of hsp90a, the inducible member of the HSP90 family. It has been shown, in fact, that in hsp70 overexpressing cells the transcription of the hsp90a gene was not induced after heat shock, whereas in cells uninduced for hsp70 there was a dramatic heat shock induction of the hsp90a gene transcription (Shi et al 1998). We found on average no induction of hsp90a mRNA too (1.01- 6 0.41-fold the baseline value). In conclusion, we can suggest that a negative feedback
regulation by Hsp70 acting as an expression repressor on hsp genes transcription is possible.
A second hypothesis involves the hsp70-1 promoter re-gion polymorphism. The method used for detecting the promoter polymorphism yields stereoscopic images of the DNA superhelical conformation, which can be direct-ly related to the electrophoretic behavior. In effect, the introduction of an adenine at position2110 (ie, allele a) increases the curvature of the molecule and provides an adequate explanation of the electrophoretic retardation of this allele; the modification of the DNA curvature by in-troducing a cytosine at the 1120 site (allele b) is much
Fig 4. hsp70-1 Promoter region poly-morphism. Relationship between the
mean change of mRNA hsp70-1 for
each observed genotype.
less marked. Moreover, the adenine-cytosine interchange at position2110, which gives the strongest effect on DNA curvature, is located between the first 2 of a series of 5 consecutive regulatory elements involved in the binding of HSF1 (Cascino et al 1993). It is possible that this inter-change causes a variation of hsp70-1 expression after stress stimuli, owing to the intimate connection between the local curvature of a DNA segment and its function in regulatory processes. Indeed, our data indicate that the 2110AA genotype seems to be significantly associated with an inactivation of the hsp70-1 expression, whereas the other genotypes do not seem to be associated with the hsp70-1 mRNA level. Unfortunately, we obtained the genotype data only from a minority of patients; our re-sult, although suggestive, needs to be confirmed in a larg-er population, and so furthlarg-er studies are necessary to bet-ter clarify the pathophysiological importance of this as-sociation.
In conclusion, on average, no increase in the hsp70-1 mRNA expression was found in biopsies from human right atria taken soon after the ischemic period during heart surgery in the present study. It is possible that the lack of any observed increase in hsp70-1 expression may be due to the high basal level of Hsp70 protein because hsp90 failed to induce in the same tissue. Fur-thermore, our data revealed an association between the
hsp70-1 promoter polymorphism and the expression of
the hsp70-1: in fact, the2110AA genotype seems to be
significantly associated with an inactivation of the hsp transcription.
REFERENCES
Benjamin IJ, McMillan DR. 1998. Stress (heat shock) proteins: mo-lecular chaperones in cardiovascular biology and disease. Circ
Res 83: 117–132.
Cascino I, Sorrentino R, Tosi R. 1993. Strong genetic association be-tween HLA-DR3 and a polymorphic variation in the regulatory region of the HSP70-1 gene. Immunogenetics 37: 177–182. Chomczynski P, Sacchi N. 1987. Single-step method of RNA isolation
by acid guanidinum thiocyanite-phenolchloroform extraction.
Anal Biochem 162: 156–159.
Grillo M, Margolis FL. 1990. Use of reverse trancriptase polymerase chain reaction to monitor expression of intronless genes.
Bio-techniques 262: 266–268.
Knowlton AA, Brecher P, Apstein CS. 1991. Rapid expression of heat shock protein in the rabbit after brief cardiac ischemia. J Clin
Invest 87: 139–147.
Shi Y, Mosser DD, Morimoto RI. 1998. Molecular chaperones as HSF1-specific transcriptional repressors. Genes Dev 12: 654–666. Storti S, Vittorini S, Luisi VS, Sacchelli M, Collavoli A, Vanini V, Biagini A, Clerico A. 2001. No variation in Hsp70 mRNA level during cardiac surgery in pediatric patients evaluated by semi-quantitative RT-PCR. Clin Chem Lab Med 39: 1240–1243. Tang PZ, Gannon MJ, Andrew A, Miller D. 1995. Evidence for
oes-trogenic regulation of heat shock protein expression in human endometrium and steroid-responsive cell lines. Eur J Endocrinol 133: 598–605.
Wu B, Hunt C, Morimoto R. 1985. Structure and expression of the human gene encoding major heat shock protein HSP70. Mol Cell