XXIX Congresso UIT sulla Trasmissione del Calore Torino, 20-22 Giugno 2011
INTRODUCTION
Thermal comfort and air quality are key issues to guarantee a pleasant staying inside buildings. People spend most of their time inside buildings and for this reason it is of high importance to guarantee a safety and pleasant indoor environment. Great attention was paid in the research to the interaction between Indoor Environmental Quality (IEQ) and productivity of the occupants in offices [1], [2], [3], [4] [5], [6]. Fewer works were devoted to the study of the learning environment while more recently a higher sensitivity to the lower level education environment (schools) was demonstrated by the scientific community [7], [8], [9], [10], [11], [12], [13], [14], with particular focus on the CO2 concentration as source of discomfort and decay of attention of the students and as a tracer for the ventilation rate evaluation. Also the environment devoted to higher level education like University classrooms deserves higher attention considering the impact of thermal stress and air quality on the students learning capacity. Quite recently some works appeared in the literature about field works conducted in Italy [15], [16] and abroad [17], [18] on the thermal comfort and air quality inside university classrooms evidencing the importance of combining experimental measurements (objective approach) with the use of questionnaires (subjective approach) to better understand the real environmental perception of the students in the classrooms. The same authors also introduced in their studies the concept of adaptation, recently taken in higher consideration by the scientific community.
In the view of a more extensive field activity with the objective of evaluating the comfort conditions in the University classrooms and of measuring the students grade of attention and learning ability, a preliminary experimental survey was conducted in a classroom of the Engineering Faculty of the University of Rome Tor Vergata where the
objective approach, the subjective approach and the De Dear and Brager adaptive approach [19] to the thermal comfort and air quality issues were applied.
EXPERIMENTAL Site and Instrumentation
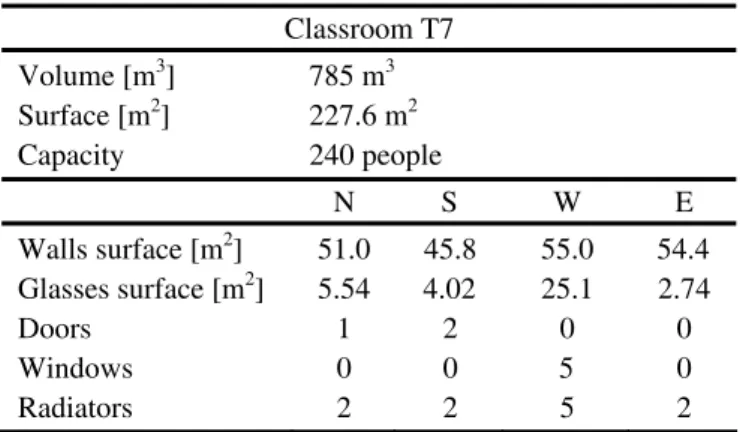
The experimental work was carried out in the period November – December 2010 in a classroom of the Engineering Faculty of the University of Rome Tor Vergata, named T7. An accurate survey of the class was conducted to characterize the site. Table 1 resumes the principal characteristics of the environment.
Table 1. T7 Classroom characteristics. Classroom T7 Volume [m3] 785 m3 Surface [m2] 227.6 m2 Capacity 240 people N S W E Walls surface [m2] 51.0 45.8 55.0 54.4 Glasses surface [m2] 5.54 4.02 25.1 2.74 Doors 1 2 0 0 Windows 0 0 5 0 Radiators 2 2 5 2
The heating system consists of 11 radiators positioned on the perimeter walls, only half of which were active during the campaign.
No mechanical ventilation was available for the classroom and it was also noted that most of the windows could not be opened. Doors and windows were left closed during the test.
THERMAL COMFORT AND AIR QUALITY IN A UNIVERSITY CLASSROOM
Cristina Cornaro*,°, Davide Musella*,°, Giulia Collorafi* *Department of Enterprise Engineering
°Centre for Hybrid and Organic Solar Energy (CHOSE) University of Rome “Tor Vergata”
Via del Politecnico, 1 – 00133 Rome, ITALY [email protected]
ABSTRACT
The environmental conditions inside buildings can influence the productivity of the occupants. In the case of classrooms the environment can influence the students learning capacity. Evidence continues to mount demonstrating that Indoor Environmental Quality (IEQ) directly impacts student health, comfort and ability to perform. In a view of a more extensive project to correlate learning ability with thermal stresses and/or Indoor Air Quality, a monitoring campaign was performed in a typical class of the Engineering Faculty of the University of Rome Tor Vergata with the objective of investigating the air quality and thermo-hygrometric conditions inside the class. The campaign was carried out during the cold season (November – December 2010). Three days were chosen for the campaign and for each day, the environmental conditions were monitored during a lecture performed in the morning and one given in the early afternoon to consider different periods of the day and different attendance of the class. The thermal comfort conditions were evaluated using objective, subjective (questionnaire) and adaptive approaches. The air quality inside the class was monitored through the CO2 concentration measurements that
were correlated with the students judgements about the air quality perceived through the PPD – CO2 concentration correlation
The instrumentation used for the survey consisted in a BABUC M data acquisition system with sensors to measure the microclimatic parameters and the CO2 concentration. Measurement survey
Measurement methodology for the thermo-hygrometric parameters was based on the indications of the UNI EN ISO 7730 [20] and UNI EN ISO 7726 [21]. A preliminary analysis was performed to check for the spatial uniformity of the microclimatic variables. Figure 1 shows a plan of the classroom with the indication of the points in which the measurements were made.
Figure 1. Plan of the classroom and measurement points. The test was carried out during the lecture hours with the students in the class, locating the sensors at about 1.1 m height. For each position a ten minutes data acquisition was performed; in this period temperature and relative humidity were collected at a time rate of 40 s and air velocity at 8 s time rate. The positions were chosen to verify possible thermal loads induced by windows and doors and to verify the contribution of the students.
A general spatial uniformity was observed allowing to chose each of the point tested for the measurement survey. Point n. 2 was chosen because more representative of the effective conditions sensed by the students. The sensors were positioned at least at 1 m distance from the students to avoid direct interaction with the instrumentation.
The measurement campaign was carried out for three days (23rd and 30th of November and 14th of December 2010) registering the indoor microclimatic conditions and the CO2 concentration (as indicator of air quality) during two different lectures, one given in the morning (11:30 – 13:00), named FTA, and one in the early afternoon (14:00 – 15:30), named SdC.
Table 2. Weather data for the days of test. WS [m/s] Text [°C] RH [%] 23-Nov 2.15 13.34 67.80 30-Nov 2.67 12.42 90.24 FTA 14-Dec 3.27 6.92 31.86 23-Nov 1.21 14.36 55.35 30-Nov 0.38 11.06 95.84 SdC 14-Dec 2.79 8.14 23.29
Climatic data for the site during the test period were obtained by the solar-weather station of the Environmental Applied Physics laboratories located in the nearby Departments building. Table 2 resumes the climatic data averaged over the lectures period, for the days of test.
Generally the outside temperature was higher during SdC, in the early afternoon than during FTA apart from the 30th of November where heavy rain occurred during SdC (confirmed by the 96% of relative humidity registered in the afternoon). The two days of November can be considered mild while the 14th of December a substantial lower temperature was measured with a very low relative humidity, indicating a cold clear and dry day. In Table 3 the indoor microclimatic parameters and the CO2 concentration averaged for the FTA lecture and the SdC lecture are shown. Considering the prescription given by the EN 15251 [22] norm which states the CO2 concentration limit for a class C environment to 1200 ppm, it can be observed how the scarce ventilation was responsible for the high average CO2 concentrations especially during the SdC lecture which presented higher occupancy level for all the days tested.
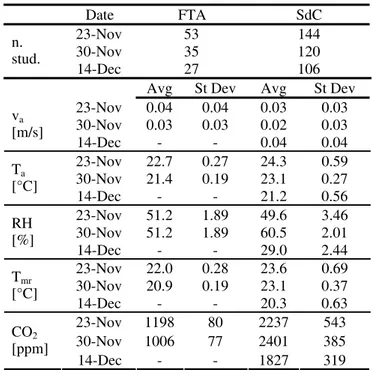
Table 3. Synthesis of the measured data during the survey.
Date FTA SdC 23-Nov 53 144 30-Nov 35 120 n. stud. 14-Dec 27 106
Avg St Dev Avg St Dev 23-Nov 0.04 0.04 0.03 0.03 30-Nov 0.03 0.03 0.02 0.03 va [m/s] 14-Dec - - 0.04 0.04 23-Nov 22.7 0.27 24.3 0.59 30-Nov 21.4 0.19 23.1 0.27 Ta [°C] 14-Dec - - 21.2 0.56 23-Nov 51.2 1.89 49.6 3.46 30-Nov 51.2 1.89 60.5 2.01 RH [%] 14-Dec - - 29.0 2.44 23-Nov 22.0 0.28 23.6 0.69 30-Nov 20.9 0.19 23.1 0.37 Tmr [°C] 14-Dec - - 20.3 0.63 23-Nov 1198 80 2237 543 30-Nov 1006 77 2401 385 CO2 [ppm] 14-Dec - - 1827 319 The 14th of December a fault in the acquisition system did not allowed to register the data for FTA. The relative humidity of the 30th of November for the same lecture was not registered so that the value measured on the 23rd was used considering a low variation of the parameter and its low influence on the comfort conditions. The high standard deviations calculated for the CO2 concentration, especially during SdC are due to the high concentration gradients experienced during the lectures.
Questionnaire survey
Information about the subjective sensation of the occupants with respect to the thermal environment and to the air quality were gathered through the distribution of a questionnaire elaborated following the indications of the UNI EN ISO 10551 [23]. A copy of the questionnaire is shown in the Appendix.
The form was divided in three parts; each of them requested the following data:
- demographic information;
- questions about the thermo-hygrometric environment and on the air quality;
- information about the students clothing to calculate the clothing resistance for the PMV and PPD evaluation.
A total number of 485 questionnaires were distributed during the campaign. The distribution was made after 30 minutes from the beginning of the lecture.
RESULTS
Objective approach
The measured environmental parameters were used to calculate the PMV and PPD as prescribed by the UNI EN ISO 7730. The metabolic activity was fixed at 1.2 met and the clo values were determined averaging the information obtained by the questionnaires for each of the test conditions. Table 4 resumes the results obtained. It can be noted that the PMV for the FTA lecture is behind the ±0.5 recommended range [20] and the PPD is lower than 10% indicating very good thermal comfort conditions. Also the SdC lecture shows good comfort conditions apart from the 23rd of November that exhibits a PMV value of 0.69, slightly higher than the values prescribed by the norm and a PPD of 14.8%. The 14th of December, owing to the above mentioned system fault, the PMV was not calculated for FTA.
Table 4. Results of the measurement campaign. A metabolic rate of 1.2 met was considered for the calculation.
23 Nov 30 Nov 14 Dec
PMV 0.38 - 0.31 - PPD [%] 8 7.1 - FTA Icl [Clo] 1.1 0.8 - PMV 0.69 0.25 - 0.3 PPD [%] 14.8 6.5 7.1 SdC Icl [Clo] 1.1 0.9 0.95 Subjective approach
The questionnaires distributed were analyzed focusing the attention on the Mean Vote (MV) considering the gender difference. Figure 2, as an example, shows the histograms of the normalized frequency of votes occurrence for FTA and SdC for the 23rd of November and the 14th of December, respectively. It has to be pointed out that the attendance of FTA was in general lower than SdC and for this reason the results showed can be considered more statistically representative for SdC than for FTA.
From the analysis of the collected data it is possible to draw the following conclusions:
- it is confirmed that females feel colder than males; - in the 14th of December the students felt colder than
the other days (MV= - 0.85 for FTA and MV= - 0.2 for SdC);
- the 23rd and 30th of November represent better comfort conditions for FTA and SdC, (MV = 0.075 and MV = 0.09, respectively).
The first assumption was proved dividing the sample only by gender and evaluating the most frequent vote expressed by males and females.
FTA ‐ 23 Nov 0 0.2 0.4 0.6 0.8 1 ‐3 ‐2 ‐1 0 +1 +2 +3 Mean Vote fn Males Females (a) SdC ‐ 14 Dec 0 0.2 0.4 0.6 0.8 1 ‐3 ‐2 ‐1 0 +1 +2 +3 Mean Vote fn Males Females (b) Figure 2. Hystograms of the normalized occurrence of mean
votes for FTA (a) and SdC (b).
It came out that the 46% of males expressed a vote for thermal neutrality and 24% for MV = +1 while females neutrality was voted by 38.5% of the sample and MV = -1 by the 38.5%. Moreover, the most desired thermal sensation for females was “feel warmer” with 58% of the sample while for males the 54% of the sample desired “no change” of the thermal environment.
A synthetic representation of the answers to the other questions is shown in figure 3 through a radar graph where for FTA (fig. 3a) and SdC (fig. 3b) the results obtained for the three days are showed. The desired thermal sensation (warmer), the thermal acceptability (positive) the MV (vote = 0), the satisfaction for the environment (positive), the judgement for the air quality (positive) and the judgement of the importance of the air quality for the students activity (positive) are listed on the radar graph as normalized frequencies.
In general the students appear less satisfied about the environment during the SdC lecture than during FTA especially for what concerns the air quality. This is essentially due to the higher class occupancy and the scarce ventilation for SdC also confirmed by the high CO2 concentration levels. For SdC the 14th of December is characterized by a high request of warmer environment essentially due to the lower outside ambient temperature together with the lower attendance for that day with consequent lower thermal load induced by the occupancy with respect to the other days. Lower occupancy was also responsible for a better air quality.
FTA 0% 25% 50% 75% 100% Thermal acceptability Environmental satisfaction Air quality Influence of air quality (a lot) MV (vote= 0) Desired sensation (warmer) 23 Nov 30 Nov 14 Dec (a) SdC 0% 25% 50% 75% 100% Thermal acceptability Environmental satisfaction Air quality Influence of air quality (a lot) MV (vote= 0) Desired sensation (warmer) 23 Nov 30 Nov 14 Dec (b) Figure 3. Synthetic representation of the questionnaires
results: (a) FTA, (b) SdC.
It is also important to note that the majority of the sample considers the indoor environmental quality as a key issue for their academic performance.
Adaptive approach
Most recently the concept of adaptation has been introduced in the thermo-hygrometric comfort evaluation [20]. For this study the De Dear and Brager model [19] was used for the Percentage of Dissatisfied (PD) calculation with the objective to compare the results with the other approaches. The following empirical equation allows to calculate the operative comfort temperature as a function of the outdoor temperature:
8 . 17 31 . 0 ⋅ + = ext co T T (1)
If the difference between the calculated value and the experimental value is less than 2.5 °C the PD is considered lower than 10%. For all the cases tested the PD resulted lower than 10%.
Comparison between the different approaches
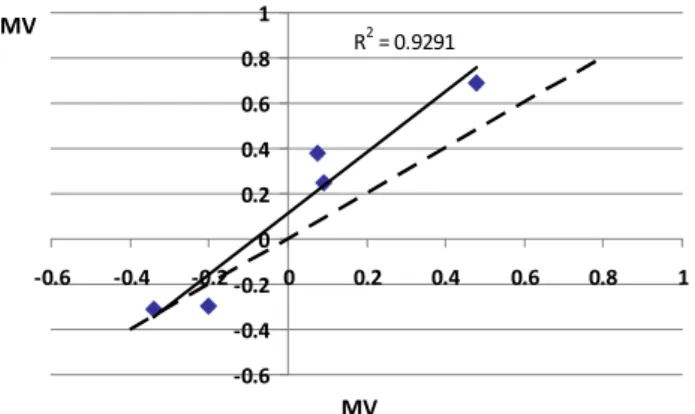
The results obtained for the various approaches were compared. In particular in figure 4 the correlation between PMV and MV is shown. From the graph in which also the bisector (PMV = MV) is traced, it can be concluded that the subjective judgement (MV) is slightly shifted towards the
“feel colder” sensation. However, more data should be collected to confirm this finding.
R2 = 0.9291 ‐0.6 ‐0.4 ‐0.2 0 0.2 0.4 0.6 0.8 1 ‐0.6 ‐0.4 ‐0.2 0 0.2 0.4 0.6 0.8 1 MV PMV
Figure 4. Correlation between PMV and MV.
In table 5 the PPD and PD values for objective, subjective and adaptive approach are listed. While the PPD prescribed by UNI EN ISO 7730 and the one obtained from the adaptive model fully fulfil the thermal comfort condition as prescribed by the norm, the subjective PD values, appear definitely higher than PPD. This result indicates that the subjective judgement on the thermal acceptance (PD) is influenced not only by the thermal environment but also by other factors. Poor air quality could be considered as such factor.
Table 5. Comparison of the grade of dissatisfaction evaluated with the three approaches.
Objective Subjective Adaptive PPD [%] PD [%] PD [%] 23 Nov 8 25.75 < 10% 30 Nov 7.1 37.85 < 10% FTA 14 Dec - 50.9 - 23 Nov 14.8 37.9 < 10% 30 Nov 6.5 33.5 < 10% SdC 14 Dec 7.1 46.3 < 10% Discussion
Air quality was evaluated through the measured CO2 concentration used as indicator for the global Indoor Air Quality. The PPD related to the air quality perception was calculated using the following equation [24]:
) 15 . 15 ( 0.25 2 395 − − ⋅ = e CO PD (2)
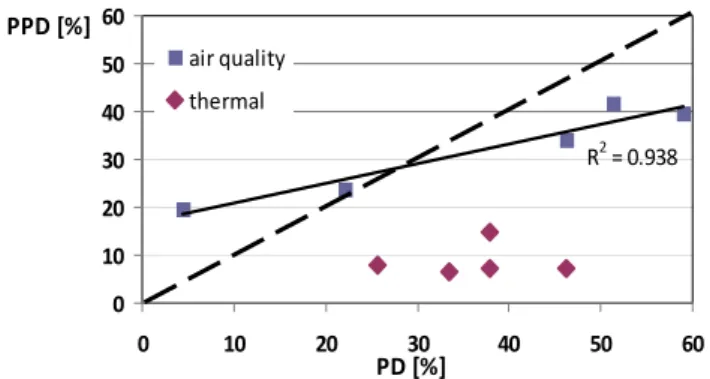
where the term CO2 represents the gas concentration in ppm. The results obtained were compared with the Percentage of Dissatisfied (PD) evaluated by the questionnaires considering the question about the air quality acceptability. Figure 5 shows the correlation between PPD and PD for thermal and air quality sensation, the dotted line represents the graph bisector. It can be noted the poor correlation for the thermal sensation with respect to the objective thermal PPD evaluation, while for the air quality a linear correlation can be recognized.
Figure 5. Correlation between PPD and PD for the air quality and thermal sensation.
However, this result indicates that the occupants can recognize the discomfort caused by poor air quality, while they seem to relate their thermal dissatisfaction to some other effect (most probably to poor air quality). The correlation showed in figure 6 between PD for air quality and PD for thermal environment, even if not strong, could in part confirm this assumption.
Figure 6. Correlation between PD for air quality and PD for thermal environment.
From the presented results it is possible to draw the following conclusions:
- There is a good correlation between the objective results and the subjective judgement of the thermal quality of the classroom;
- The sample found a certain difficulty to give a right judgement on thermal satisfaction because even if the MV is low the PD is very high;
- The sample is able to express a judgement on the air quality considering the correlation between PPD calculated with the CO2 concentration and the subjective PD for air quality;
- It appears that the judgement on thermal environment is influenced by the indoor air quality.
CONCLUSIONS
A survey on the Indoor Environmental Quality was carried out in a classroom of the University of Rome Tor Vergata using different approaches. Objective measurements and subjective judgement of the occupants on the environment were correlated to verify congruity of the results. A substantial agreement between the Predicted Mean Vote evaluated using the ISO 7730 indications and the Mean Vote expressed by the occupants was found. The correlation shows
a slight shift toward colder vote given by the occupants. Comfort conditions were found in almost all cases studied. However thermal satisfaction was poor for most of the students interviewed. Air quality was evaluated through CO2 concentration measurements and subjective judgement. Poor ventilation of the class and high occupancy is responsible for high values of CO2 concentration during SdC lecture and a high grade of dissatisfaction was expressed by the occupants for all cases tested.
It is suggested that the high thermal discomfort could be related to the high dissatisfaction expressed for the air quality. This finding confirms the importance of considering the synergic effect of various external stimuli on the global comfort.
ACKNOWLEDGMENTS
The authors wish to thank the students involved in the survey. A particular thank also to prof. Micheletti for offering his lectures for the measurement survey and the questionnaires distribution.
NOMENCLATURE
Symbol Quantity SI Unit
WS Wind speed m/s
Text Outdoor air temperature °C
RH Relative humidity %
va Air velocity m/s
Ta Indoor ambient temperature °C Tmr Mean radiant temperature °C
CO2 CO2 concentration ppm
Tco Operative comfort temperature °C REFERENCES
[1] P. Wargocki, D. P Wyon and P. Ole Fanger, Productivity is affected by the air quality in offices,
Proceedings of Healthy Buildings, Vol. 1, pp. 635-640,
2000.
[2] D. Clements-Croome and L. Baizhan, Productivity and indoor environment, Proceedings of Healthy Buildings Vol 1, pp. 629-634, 2000.
[3] W.J. Fisk, Review of health and productivity gains from better IEQ, Proceedings of Healthy Buildings Vol. 4, pp. 23-33, 2000.
[4] L. Lan, Z. Lian , L. Pan, Q. Ye, Neurobehavioral approach for evaluation of office workers’ productivity: the effects of room temperature, Building and
Environment, 44, pp. 1578–1588, 2009.
[5] L. Lan, Z. Lian Use of neurobehavioral tests to evaluate the effects of indoor environment quality on productivity, Building and Environment, 44, pp. 2208– 2217, 2009.
[6] M. Humphreys, J. Fergus Nicol Self-assessed productivity and the office environment: monthly surveys in five European countries, ASHRAE
Transactions, 113, (1), pp. 606-616, 2007.
[7] M. Santamouris, A. Synnefa, M. Asssimakopoulos, I. Livada, K. Pavlou, M. Papaglastra, N. Gaitani, D. Kolokotsa, V. Assimakopoulos, Experimental investigation of the air flow and indoor carbon dioxide concentration in classrooms with intermittent natural R2 = 0.394 0 10 20 30 40 50 60 70 0 10 20 30 40 50 60 70 PDthermal [%] PDCO2 [%] R2 = 0.938 0 10 20 30 40 50 60 0 10 20 30 40 50 60 PD [%] PPD [%] air quality thermal
ventilation, Energy and Buildings, 40, pp. 1833–1843, 2008.
[8] M. Griffiths, M. Eftekhari, Control of CO2 in a naturally ventilated classroom, Energy and Buildings, 40, pp. 556–560, 2008.
[9] M. Kolokotroni, Y.T. Ge, Katsoulas D, Monitoring and modelling indoor air quality and ventilation in classrooms within a purpose- designed naturally ventilated school, Indoor Built Environment, 11, pp. 316–326, 2002.
[10] S. C. Lee and M. Chang, Indoor Air Quality Investigations at Five Classrooms, Indoor Air 9, pp. 134–138, 1999.
[11] K.H. Bartlett, Mark Martinez, Joel Bert, Modeling of occupant-generated CO2 dynamics in naturally ventilated classrooms, Journal of Occupational and
Environmental Hygiene 1, pp. 139–148, 2004.
[12] Coley, Bersteiner, Carbon Dioxide Levels and Ventilation Rates in Schools, International Journal of
Ventilation 1, 1, pp. 45–52, 2002.
[13] P.A. Scheff, V.K. Paulius, S.W. Huang, L.M. Conroy, Indoor air quality in a middle school. Part I: Use of CO2 as a tracer for effective ventilation, Applied
Occupational and Environmental Hygiene 15, 11, pp.
824–834, 2000.
[14] E.Z. Conceicao, M.M.J.R. Lucio, Air quality inside a school building: air exchange monitoring, evolution of carbon dioxide and assessment of ventilation strategies,
International Journal of Ventilation 5, 2, pp. 259–270,
2005.
[15] C. Buratti, P. Ricciardi, Adaptive analysis of thermal comfort in university classrooms: Correlation between experimental data and mathematical models, Building
and Environment 44, pp. 674-687, 2009.
[16] S. P. Corgnati, R. Ansaldi, M. Filippi, Thermal comfort in Italian classrooms under free running conditions
during mid seasons: Assessment through objective and subjective approaches, Building and Environment 44, pp. 785-795, 2009.
[17] R. L. Hwang, T. P. Lin, N. J. Kuo, Field experiments on thermal comfort in campus classrooms Taiwan, Energy
and Building 38, pp. 53-62, 2006.
[18] R. Yao, J. Liu, B. Li, Occupant’s adaptive responses and perception of thermal environment in naturally conditioned university classrooms, Applied Energy 87, pp. 1015-1022, 2010.
[19] De Dear RJ, Brager GS, Developing an adaptive model of thermal comfort and preference, ASHRAE
Transaction; 104(1A), pp. 145-167, 1998
[20] UNI EN ISO 7730. Ergonomics of the thermal environment – analytical determination and interpretation of thermal comfort using calculation of the PMV and PPD indices and local thermal comfort criteria; 2006.
[21] ISO 7726, Ergonomics of the thermal environment – instruments for measuring physical; 1998.
[22] UNI EN 15251, Indoor environmental input parameters for design and assessment of buildings addressing indoor air quality, thermal environment, lighting and acoustics, 2008.
[23] UNI EN ISO 10551, ergonomics of the thermal environment – Assessment of the influence of the thermal environment using subjective judgement scales, 2002.
[24] EEC, 1992, Guidelines for Ventilation Requirements in
Buildings, European Concerted Action: Indoor Air
Quality and its impact on man (COST Project 613), Report n. 11, Commission of the European Communities, Luxembourg.
APPENDIX Questionnaire