2020-11-25T12:30:44Z
Acceptance in OA@INAF
The accretion environment of supergiant fast X-ray transients probed with
XMM-Newton
Title
Bozzo, E.; Bernardini, F.; Ferrigno, C.; Falanga, M.; ROMANO, Patrizia; et al.
Authors
10.1051/0004-6361/201730398
DOI
http://hdl.handle.net/20.500.12386/28542
Handle
ASTRONOMY & ASTROPHYSICS
Journal
608
DOI:10.1051/0004-6361/201730398 c ESO 2017
Astronomy
&
Astrophysics
The accretion environment of supergiant fast X-ray transients
probed with XMM-Newton
E. Bozzo
1, F. Bernardini
2, C. Ferrigno
1, M. Falanga
3, P. Romano
4, and L. Oskinova
5, 61 Department of Astronomy, University of Geneva, Chemin d’Ecogia 16, 1290 Versoix, Switzerland e-mail: [email protected]
2 New York University Abu Dhabi, PO Box 129188 Abu Dhabi, UAE
3 International Space Science Institute (ISSI) Hallerstrasse 6, 3012 Bern, Switzerland 4 INAF–Osservatorio Astronomico di Brera, via Emilio Bianchi 46, 23807 Merate (LC), Italy
5 Institut für Physik und Astronomie, Universität Potsdam, Karl-Liebknecht-Strasse 24/25, 14476 Potsdam, Germany 6 Kazan Federal University, Kremlevskaya Str., 18, 420008 Kazan, Russia
Received 5 January 2017/ Accepted 31 August 2017
ABSTRACT
Context.Supergiant fast X-ray (SFXT) transients are a peculiar class of supergiant X-ray binaries characterized by a remarkable variability in the X-ray domain, widely ascribed to accretion from a clumpy stellar wind.
Aims. In this paper we performed a systematic and homogeneous analysis of the sufficiently bright X-ray flares observed with
XMM-Newtonfrom the supergiant fast X-ray transients to probe spectral variations on timescales as short as a few hundred sec-onds. Our ultimate goal is to investigate whether SFXT flares and outbursts are triggered by the presence of clumps, and to reveal whether strongly or mildly dense clumps are required.
Methods. For all sources, we employ a technique developed by our group already exploited in a number of our previous papers, making use of an adaptive rebinned hardness ratio to optimally select the time intervals for the spectral extraction. A total of twelve observations performed in the direction of five SFXTs are reported, providing the largest sample of events available so far.
Results.Using the original results reported here and those obtained with our technique from the analysis of two previously published XMM-Newtonobservations of IGR J17544-2619 and IGR J18410-0535, we show that both strongly and mildly dense clumps can trigger these events. In the former case, the local absorption column density may increase by a factor of 3, while in the latter case, the increase is only a factor of ∼2–3 (or lower). An increase in the absorption column density is generally recorded during the rise of the flares/outbursts, while a drop follows when the source achieves peak flux. In a few cases, a re-increase of the absorption column density after the flare is also detected, and we discovered one absorption event related to the passage of an unaccreted clump in front of the compact object. Overall, there seems to be no obvious correlation between the dynamic ranges in the X-ray fluxes and absorption column densities in supergiant fast X-ray transients, with an indication that lower densities are recorded at the highest fluxes.
Conclusions.The spectral variations measured in all sources are in agreement with the idea that the flares/outbursts are triggered by the presence of dense structures in the wind interacting with the X-rays from the compact object (leading to photoionization). The lack of correlation between the dynamic ranges in the X-ray fluxes and absorption column densities can be explained by the presence of accretion inhibition mechanism(s). Based on the knowledge acquired so far on the SFXTs, we propose a classification of the flares/outbursts from these sources in order to drive future observational investigations. We suggest that the difference between the classes of flares/outbursts is related to the fact that the mechanism(s) inhibiting accretion can be overcome more easily in some sources compared to others. We also investigate the possibility that different stellar wind structures, other than clumps, could provide the means to temporarily overcome the inhibition of accretion in supergiant fast X-ray transients.
Key words. X-rays: individuals: IGRJ18450-0435 – X-rays: individuals: IGRJ17544-2619 – X-rays: binaries – X-rays: individuals: SAXJ1818.6-1703 – X-rays: individuals: IGRJ17354-3255 – X-rays: individuals: IGRJ16328-4726
1. Introduction
Supergiant fast X-ray transients (SFXTs) are a subclass of the classical supergiant high mass X-ray binaries (SgXBs) hosting a neutron star (NS) accreting from the wind of an O-B super-giant companion (see, e.g., Martínez-Núñez et al. 2017, for a recent review). At odds with classical systems, the SFXTs are known to be largely subluminous (a factor of&10–100) and to display a much more prominent variability in X-rays. In particu-lar, SFXTs spend most of their lifetimes in low quiescent states (with X-ray luminosities as low as 1032 erg s−1) and undergo
sporadic outbursts of a few hours each reaching luminosities of LX ' 1036–1038 erg s−1. Flares with intermediate luminosities
between quiescence and outburst (LX ' 1034–1035 erg s−1) are
often observed and last a few thousands seconds at most (see, e.g., Romano et al. 2014). The largest dynamic range in lumi-nosity recorded so far is that of the SFXT prototype IGR J17544-2619, reaching a factor of ∼106(Romano et al. 2015). For
com-parison, the classical SgXBs display a typical dynamic range of .100 (Walter et al. 2015).
It was originally proposed that largely eccentric orbits and extremely clumpy winds could explain the SFXT phenomenol-ogy (in ’t Zand 2005; Negueruela 2010;Walter & Zurita Heras 2007). In a wide elongated orbit, the NS remains quiescent for a significant fraction of time, and the accretion of clumps en-dowed with an overdensity of a factor of&1000 compared to the surrounding wind could give rise to the brightest SFXT
outbursts (especially when the NS approaches the compan-ion). The problem with this interpretation is that a number of SFXTs were discovered to have short orbital periods (3– 5 days), and studies of isolated supergiant winds showed that clumps are typically only a factor of '10 overdense com-pared to a smooth wind (see, e.g., Lutovinov et al. 2013; Bozzo et al. 2015; Martínez-Núñez et al. 2017, and references therein). Bozzo et al.(2008b) andGrebenev & Sunyaev(2007) proposed that the inhibition of accretion caused by the neu-tron star rotating magnetosphere could combine with the pres-ence of moderately dense clumps to boost the X-ray variabil-ity of the SFXTs compared to classical systems. An alternative way to inhibit accretion and widen the dynamic range of the SFXTs involve the combined presence of a long-lasting “sub-sonic settling accretion regime” and a significantly magnetized supergiant wind (Shakura et al. 2012,2014).
Although the theoretical interpretation of the SFXT behav-ior is still matter of debate, convincing evidence has been re-ported in the literature of the presence of massive structures in the stellar winds around the NSs in these systems. Observation-ally, the role of these structures is twofold. A sufficiently large and dense structure simply passing in front of the NS (with-out being accreted) causes source dimming or even obscuration. Its presence can be revealed by the signature of the photoelec-tric absorption, even when there is no significant increase in the source X-ray emission. Structures that instead are intercepted by the NS lead to a temporarily higher mass accretion rate, giving rise to X-ray flares or outbursts characterized by an enhanced local absorption that is proportional to the lateral size of the ac-creted structure (see, e.g., the discussion in Bozzo et al. 2013). Events of source dimming have been reported in several obser-vations of SFXTs and tentatively associated with clumps pass-ing in front of the compact object (see, e.g.,Rampy et al. 2009; Drave et al. 2013). X-ray flares and outbursts in SFXTs have also been associated with accretion of clumps in several pub-lications, but finding direct proof of the existence of these struc-tures through X-ray observations has proved challenging. The reason is that SFXT flares and outbursts occur at unpredictable times. Their detailed spectroscopic analysis requires monitoring with a large effective area instrument able to give access to in-tegrations as short as the local dynamical timescales (hundreds of seconds) with the necessary signal-to-noise ratio (S/N) and energy resolution.
So far, the most convincing evidence for the “ingestion” of a massive clump by a NS hosted in a SFXT was reported byBozzo et al.(2011) using an XMM-Newton observation that luckily caught IGR J18410-0535 undergoing a bright X-ray flare. On that occasion, a a factor of ∼10 increase in the ab-sorption column density in the direction of the source preceding the flare revealed that a massive and dense structure was rapidly approaching the NS, giving first rise to a large increase in flux (a factor of ∼1000) before obscuring the compact object and fi-nally moving away from the observer’s line of sight.Bozzo et al. (2016a) also fortuitously caught with XMM-Newton an episode of strongly enhanced X-ray activity from the SFXT IGR J17544-2619 that reached the typical luminosity of an X-ray outburst, but displayed only a marginal increase in the local absorption column density (a factor of.2). Relibly estimating the physical properties of the clumps from these observations have proved complicated, due to our poor knowledge of the spin period and magnetic field of the NS in the SFXTs. This prevents us from correctly quantifying the effect of the mechanisms inhibiting ac-cretion and contributing to producing the total variation of the
X-ray luminosity (see also the detailed discussion inBozzo et al. 2011).
In this paper, we analyze all publicly available XMM-Newton observations of confirmed SFXTs in which sufficiently bright X-ray flares/outbursts are detected to perform a detailed spec-tral analysis. We take advantage of the large collecting area of the EPIC cameras on board XMM-Newton (Jansen et al. 2001; Strüder et al. 2001; Turner et al. 2001) to investigate spectral variations during flares that can be associated with the presence of structures in the wind of the supergiant companion. An adap-tively rebinned hardness-ratio resolved spectral analysis is ho-mogeneously carried out for a total of 12 observations performed in the direction of 5 out of the ∼10 known SFXTs (IGR J18450-0435, IGR J17544-2619, SAX J1818.6-1703, IGR J17354-3255, and IGR J16328-4726). Our dataset includes data that were pub-lished previously but not investigated for rapid spectral varia-tions and also five unpublished observavaria-tions. The unique capa-bility of XMM-Newton for these studies is to provide a su ffi-ciently large effective area in the soft X-ray domain (0.5–12 keV) to perform spectroscopic investigations down to timescales as short as a few hundred seconds, thus allowing us to resolve changes in the photoelectric absorption in the direction of the source during the rise and decays of the flares (and in the quies-cent periods between them). Based on our experience, we con-sider flares to be sufficiently bright when the source count-rate achieves at least 2–3 cts s−1in the EPIC cameras1.
Our final goal is to test whether all observed flares/outbursts are characterized by a spectral variability that can be associated with the presence of a massive clump around the compact object and whether less massive structures are also able to trigger these phenomena. We summarize in Sect.2 the data analysis proce-dure and describe in the associated subsections the results ob-tained for each source and each observation. An overview of the results is provided in Sect.3. The corresponding discussion is presented in Sect.4, together with our conclusions.
2. XMM-Newton data reduction and analysis
For all sources considered in this paper, we produced calibrated event lists by using the Science Analysis System (SAS) v.15.0. The EPIC-pn, EPIC-MOS, and RGS event files were generated with standard analysis performed with the
epproc
,emproc
, andrgsproc
tasks. The EPIC-pn and EPIC-MOS data were fil-tered in the 0.5–12 keV and 0.5–10 keV energy range, respec-tively. Extraction regions for the light curves and spectra of all sources and background were selected by following recommen-dations in the latest SAS analysis threads2. The difference in ex-traction areas between source and background was accounted for by using the SASbackscale
task for the spectra andlccorrr
for the light curves. The EPIC spectra were rebinned before fit-ting in order to have 15–25 counts per bin (depending on the available statistics) and, at the same time, to prevent oversam-pling of the energy resolution by more than a factor of three. The RGS spectra were also rebinned accordingly, whenever re-quired. The timing analysis of all EPIC data was performed on barycenter-corrected event lists (we used the SAS barycen tool). Details of specific issues regarding the observations of the dif-ferent sources are provided in the dedicated following sections.1 The only exception in this paper is observation 0679810401, where we were able to show a modest (but still significant) variation in the absorption column density during a faint X-ray flare from IGR J17544-2619.
2 http://xmm.esac.esa.int/sas/current/documentation/
Throughout this paper, uncertainties are given at 90% confidence level, unless otherwise stated.
For all sources, we searched for rapid spectral changes in their X-ray emission by performing a hardness ratio (HR) re-solved spectral analysis. The HR is computed in all cases from the adaptively rebinned energy-resolved light curves and calcu-lated as the ratio of the source count-rate in the soft to hard en-ergy bands vs. time. The adaptive rebinning and the choice of the soft and hard energy bands are performed differently for each source, depending on the data statistics and the averaged spectral properties. The HR-resolved spectral analysis we employ in this paper is better suited to revealing rapid spectral variations dur-ing the flares/outbursts of the SFXTs than the more standard in-tensity or time-resolved spectral analyses carried out previously for 7 (out of 12) X-ray observations included in our study. The HR-resolved spectral analysis probes directly when a source is undergoing a significant spectral variation, without the need to assume a priori that such changes can occur either during peri-ods of lower/higher X-ray activity or in specific time intervals. This technique was already exploited in two of our previous pub-lications and allowed us to prove that the bright flare observed by XMM-Newtonfrom the SFXT IGR J18410-0535 was most likely related to the ingestion of a massive clump by the NS hosted in this system (Bozzo et al. 2011), while the outburst caught from the SFXT prototype IGR J17544-2619 was shown to re-quire the simultaneous interplay of additional mechanisms to give rise to the measured dynamic range in the X-ray luminosity (Bozzo et al. 2016a). The conclusion in the case of IGR J17544-2619 was mainly derived from the fact that no particularly large increase in the accretion column density was recorded during this event, although it achieved an X-ray luminosity a factor of &10 higher than that of the X-ray flare caught from IGR J18410-0535 which displayed evidence of an increase in the local NHof
a factor of ∼10 preceding the X-ray flare. We note that for all sources analyzed in this paper the estimated distance is of ∼2– 4 kpc (Martínez-Núñez et al. 2017, and references therein), and thus all episodes of enhanced X-ray emission reported in the next sections are compatible with being flares as the peak luminosity is in all cases.1036erg s−1.
The soft X-ray spectra of almost all sources considered here are well described by using an absorbed power-law model, as is commonly the case for SFXTs and other HMXBs. The cutoff of the power law at high energies is usually measurable only when a broadband spectrum extending up to &20–30 keV is avail-able (see, e.g.,Walter et al. 2015, and references therein). The 1–10 keV X-ray flux was measured by using the
pegpow
model inxspec
in order to have values not dependent on the largely variable absorption column densities and the uncertainties that arise when the spectra are de-absorbed after the fit inxspec
.Supergiant fast X-ray transients are characterized (on average) by a relatively high absorption column density ( 1022 cm−2), well in excess of the galactic extinction in the source direction. However, the generally low statistics of the data at energies below 2–3 keV do not allow us to unambiguously separate the contribution of the Galactic absorption and the ad-ditional absorption local to the source. The former contribution can be roughly estimated by using an online tool3 based on the results published byDickey & Lockman(1990) or by more re-cent works that also consider the contribution of molecular hy-drogen (Dame et al. 2001). The density of absorbing material lo-cated close to the source, which is generally largely in excess
3 http://heasarc.gsfc.nasa.gov/cgi-bin/Tools/w3nh/
w3nh.pl?
of the expected Galactic value, can be obtained by measuring an excess with respect to the expected Galactic value using a simple
phabs
spectral component inxspec
. This is a common practice in the case of HMXBs for which high statistics X-ray observations with grating spectrometers are not available (see, e.g., Grinberg et al. 2015). In a few observations used in this work, slightly more complex spectral models were also consid-ered, including a partial covering absorber (pcfabs
inxspec
). This model is also widely used to describe the soft X-ray emis-sion of HMXBs, and it is usually ascribed to localized absorbers that partially intercept the radiation from the NS (see, e.g., Tomsick et al. 2009, and references therein). The X-ray emission that escapes this extra absorption is only affected by the Galac-tic column density. The fits to the spectra of a few sources also required the addition of a thin Gaussian line with a centroid en-ergy compatible with that expected from neutral iron at 6.4 keV. Similar lines in HMXBs are known to occur and are due to the fluorescence of the X-ray photons released by the NS onto the surrounding stellar wind material (see, e.g.,Torrejón et al. 2010; Giménez-García et al. 2016). We refer the reader to the follow-ing subsections dedicated to each source for further details.The log of all XMM-Newton observations used in this paper is given in Table 1. For completeness, we also add in Table2 the XMM-Newton observations that we published previously for which an adaptively rebinned HR-resolved spectral analysis of the SFXT flares/outbursts was already carried out. These obser-vations are used in Sect.4to provide a more exhaustive discus-sion and concludiscus-sions of all results.
2.1. IGR J18450-0435
2.1.1. Observation 0306170401
This observation was first analyzed by Zurita Heras & Walter (2009). It was not affected by high flaring background inter-val and thus the entire exposure time can be retained for the scientific analysis. By using the
epatplot
tool, we found that the source X-ray emission was moderately affected by pileup at count-rates&7 cts s−1on both the EPIC-pn and the MOS cam-eras. We verified that using an annular extraction region with a inner radius of 100 px for the EPIC-pn and 150 px for the MOS could remove the effect of pileup. Figure1 (top) shows the source energy-resolved light curves, together with the corre-sponding HR. This is also shown in the same figure as a function of the total source intensity (hardness intensity diagram, HID). No apparent correlation emerges between the source count-rate and the HR, but some specific intervals of count-rates are vis-ible where the variations of the HR are more pronounced. We extracted the pileup corrected EPIC spectra and also made use of the RGS1 and RGS2 average spectra summed with the SAS toolrgscombine
to improve the S/N.In order to carry out a comparison with previously reported results, we also extracted the spectrum from the IBIS/ISGRI in-strument on board INTEGRAL during the seven pointings con-sidered byZurita Heras & Walter(2009, see their Table 2). The IBIS/ISGRI data were analyzed by using standard procedures and the version 10.2 of the OSA software distributed by the ISDC (Courvoisier et al. 2003).
In Fig. 2 we show the averaged EPIC-pn and MOS spec-tra summed together by following the SAS online threads4 in order to achieve the highest possible S/N. This spectrum was
4 http://xmm.esac.esa.int/sas/current/documentation/
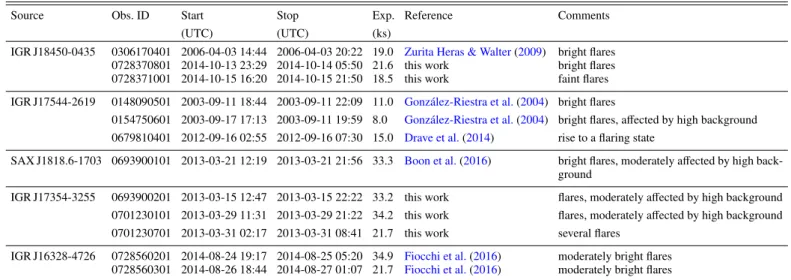
Table 1. Log of all XMM-Newton observations considered in this paper for the different SFXT sources.
Source Obs. ID Start Stop Exp. Reference Comments
(UTC) (UTC) (ks)
IGR J18450-0435 0306170401 2006-04-03 14:44 2006-04-03 20:22 19.0 Zurita Heras & Walter(2009) bright flares 0728370801 2014-10-13 23:29 2014-10-14 05:50 21.6 this work bright flares 0728371001 2014-10-15 16:20 2014-10-15 21:50 18.5 this work faint flares IGR J17544-2619 0148090501 2003-09-11 18:44 2003-09-11 22:09 11.0 González-Riestra et al.(2004) bright flares
0154750601 2003-09-17 17:13 2003-09-11 19:59 8.0 González-Riestra et al.(2004) bright flares, affected by high background 0679810401 2012-09-16 02:55 2012-09-16 07:30 15.0 Drave et al.(2014) rise to a flaring state
SAX J1818.6-1703 0693900101 2013-03-21 12:19 2013-03-21 21:56 33.3 Boon et al.(2016) bright flares, moderately affected by high back-ground
IGR J17354-3255 0693900201 2013-03-15 12:47 2013-03-15 22:22 33.2 this work flares, moderately affected by high background 0701230101 2013-03-29 11:31 2013-03-29 21:22 34.2 this work flares, moderately affected by high background 0701230701 2013-03-31 02:17 2013-03-31 08:41 21.7 this work several flares
IGR J16328-4726 0728560201 2014-08-24 19:17 2014-08-25 05:20 34.9 Fiocchi et al.(2016) moderately bright flares 0728560301 2014-08-26 18:44 2014-08-27 01:07 21.7 Fiocchi et al.(2016) moderately bright flares
Notes. We provide the relevant reference for the observations already published by other authors (without performing an adaptively rebinned HR-resolved spectral analysis) and marked with “this work” data that are publicly available but were not published yet. In the column “Comments” we indicated if the source was showing bright or moderately bright flares, providing also some information about the level of background in the most critical cases.
Table 2. Log of all XMM-Newton observations of flaring/outbursting SFXTs published previously and for which an adaptively rebinned HR-resolved spectral analysis was already carried out.
Source Obs. ID Start Stop Exp. Reference Comments
(UTC) (UTC) (ks)
IGR J17544-2619 0744600101 2015-03-20 05:00 2015-03-21 20:17 140.0 Bozzo et al.(2016a) outburst IGR J18410-0535 0604820301 2010-03-15 13:09 2010-03-16 02:13 45.7 Bozzo et al.(2011) bright flare
grouped in order to have at least 150 photons per energy bin. We verified a posteriori that results obtained from the fit to this spectrum were compatible with those obtained by using only the EPIC-pn spectrum. A fit to the summed EPIC spectrum was carried out simultaneously with the RGS and the IBIS/ISGRI spectra, first by using the same spectral model considered by Zurita Heras & Walter (2009). This model comprises an emis-sion from optically thin plasma at the lower energies (
mekal
inxspec
), a cutoff power law to fit the data above ∼4 keV, and an edge at ∼7.9 keV. We added to this model a Gaussian line at ∼6.4 keV, which had previously gone unnoticed, and the inter-calibration constants for IBIS/ISGRI and the RGS with respect to the summed EPIC cameras. These constants also account for the source variability as the IBIS/ISGRI and XMM-Newton data are not strictly simultaneous. This model gave a reasonable de-scription of the data and parameter values in agreement with those previously reported byZurita Heras & Walter(2009). We found that a simpler model comprising a partial covering ab-sorber, a cutoff power law, and an iron line could describe the data equally well (χ2red/d.o.f. = 1.14/325). We measured in this case NlosH = (1.8±0.1) × 10
22cm−2, N
H= (5.5+1.2−1.0) × 1022cm−2,
f = 5.6 ± 0.4, Γ = 1.3 ± 0.1, Ecut31.7+16.9−9.2 keV, EFe =
6.42 ± 0.02 keV, EQWFe = 0.05+0.02−0.01, CRGS = 1.1 ± 0.1, and
CIBIS/ISGRI = 4.8 ± 1.0. Here NHlos is the Galactic column
den-sity, NHthe column density of the partial covering absorber, f
the covering fraction, Ecutthe cutoff energy of the cutoff
power-law component, Γ the corresponding photon index, EFe is the
centroid energy of the iron line, and EQWFe is its equivalent
width. We fixed the normalization constant of the combined
EPIC cameras spectrum to unity and indicated with CRGS and
CIBIS/ISGRI the values of the normalization constants obtained
for the RGS and the IBIS/ISGRI spectrum, respectively. The effective exposure time of the spectrum was of 38.2 ks for the EPIC, 12.0 ks for the RGS, and 17.6 ks for IBIS/ISGRI. The averaged flux is 4.3 × 10⁻¹¹ erg cm−2s−1 (1–10 keV). We note that the value of Nlos
H in the partial covering model is compatible
with the expected Galactic value in the direction of the source (Dickey & Lockman 1990).
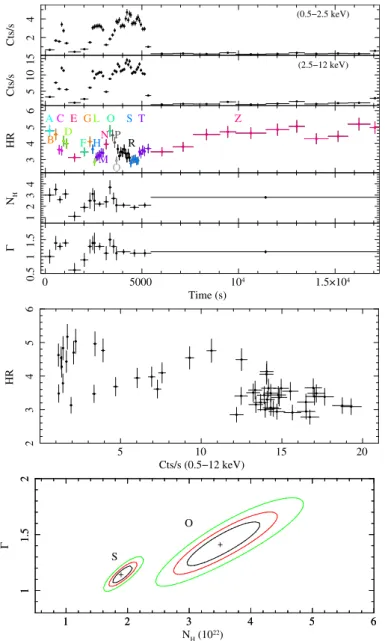
To investigate possible spectral changes during the XMM-Newtonobservation, we extracted different pn and EPIC-MOS spectra of the source by choosing the time intervals cor-responding to the most noticeable variations of the HR. The different spectral intervals are labeled with letters A−Z and are color-coded in Fig. 1 (top). Spectra A−T were character-ized by relatively low statistics and could be well fit by us-ing a simple absorbed power-law model. Spectrum Z was ex-tracted by using a significantly longer exposure time and could be fit only by using a partial covering cutoff power-law model. We fixed the cutoff energy at 31.7 keV (based on the INTE-GRAL results) and measured NHlos = (2.4 ± 0.2) × 1022 cm−2, NH= (9.5 ± 2.2) × 1022cm−2, f = 0.57 ± 0.05, Γ = 1.4 ± 0.1,
and an average flux of 1.4 × 10⁻¹¹erg cm2s−1. For each selected
time interval (A to Z), the EPIC-pn and EPIC-MOS spectra were fit simultaneously and the estimated values of the absorption col-umn density, power-law photon index, and flux are summarized in TableA.1. Some results are also plotted in Fig.1(top). These fits revealed only a moderate change of the absorption column density (a factor of ∼2) and power-law photon index despite the remarkable variation in the X-ray flux (a factor of&10).
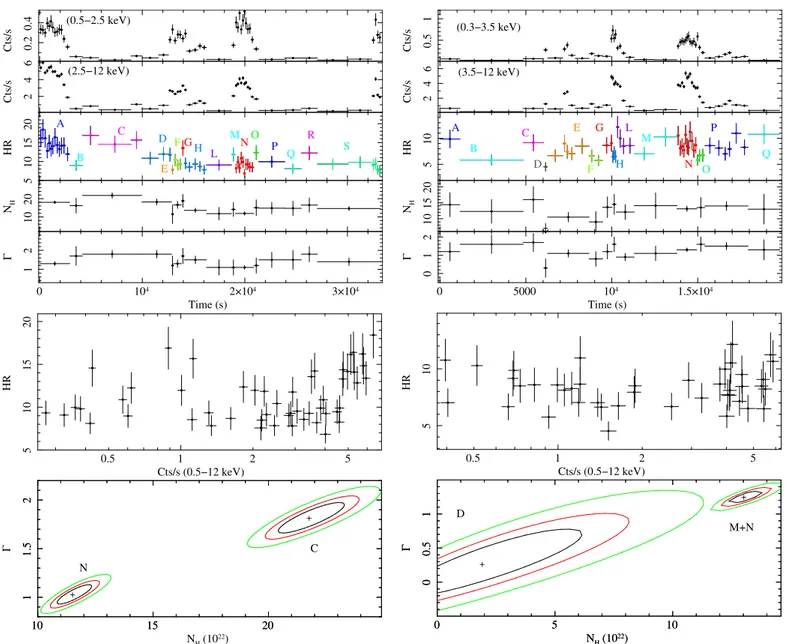
2 4 Cts/s (0.5−2.5 keV) 5 10 15 Cts/s (2.5−12 keV) 345 6 HR AC E GL O S T Z B D F H M N P Q R 123 4 NH 0 5000 104 1.5×10⁴ 0. 5 1 1.5 Γ Time (s) 5 10 15 20 2345 6 HR Cts/s (0.5−12 keV) 1 2 3 4 5 6 1 1. 5 2 + S O 1 2 3 4 5 6 1 1. 5 2 Γ NH (1022) +
Fig. 1.Results obtained from observation 0306170401 of IGR
J18450-0435. Top: EPIC-pn light curve of the source in two energy bands and the corresponding HR (an adaptive rebinning was used to achieve a min-imum S /N > 15 in each soft time bin). The letters in the middle panel indicate the different HR resolved spectra listed in TableA.1. The last two panels show the results obtained from the spectral fits to the HR-resolved spectral analysis (the measured absorption column density in units of 1022cm−2and the photon indexΓ). Middle: hardness intensity diagram (HID). Bottom: contour plot showing the ranges spanned by the power-law photon index and the absorption column density mea-sured from the most relevant time intervals for the spectral variations marked in the second plot from the top (in this case the intervals “O” and “S”).
2.1.2. Observation 0728370801
This observation was not affected by flaring background inter-vals and thus the full exposure time could be retained for the scientific analysis. The pn was operated in small window mode, while the two MOS were set in large window mode. As this ob-servation has not yet been reported elsewhere, we show the full-band EPIC-pn light curve in Fig.3, together with the energy-resolved light curves, the HR, and the HID.
0.01 0.1 1 normalized counts s −1 keV −1 ISGRI EPIC RGS −2 0 2 χ 0 0 1 0 1 1 −2 0 2 χ Energy (keV)
Fig. 2. Broadband X-ray spectrum of IGR J18450-0435 obtained by
summing the data from the three XMM-Newton EPIC cameras in ob-servation 0306170401, combining the data from the two RGSs in the same observation, and using the INTEGRAL data described in the text. The best fit is obtained with a partial covering model comprising a cutoff power law and an iron line. The middle panel shows the residuals from this fit. The bottom panel shows the residuals obtained by fitting the spectrum with the model proposed byZurita Heras & Walter(2009).
The source displayed two separated periods of flaring activ-ity. During the first, a bright episode was accompanied by lower intensity peaks, and lasted roughly 5 ks in total. The second flare appeared isolated and lasted less than 1 ks. We extracted first the average source spectra for all EPIC cameras using the en-tire exposure time available. We verified with the
epaplot
tool that the pn was not affected by pileup and thus we used the flux measured by this instrument to correct the pileup on the two MOS. Due to the high extinction measured in the direction of the source (see below), the reduction of the two RGSs data did not result in usable scientific products. The average spectrum of the source cannot be satisfactorily fit by using a single power-law model (χ2red= 1.39/318). As in observation 0306170401 (see Sect.2.1.1), we improved the results by using a model compris-ing a cutoff power law (the cutoff energy was fixed to 31.7 keV) and a partial absorber (pcfabs
inxspec
). Using the same nota-tions as in Sect.2.1.1, we measured NlosH = (2.7+1.0−1.3) × 10
22cm−2,
NH = (6.6+1.2−0.8) × 10
22 cm−2, f = 0.83+0.09
−0.13, Γ = 1.1 ± 0.1,
F = 1.1 × 10⁻¹¹erg cm−2s−1, CMOS1 = 1.12 ± 0.04, CMOS2=
1.05 ± 0.03, and χ2
red/d.o.f. = 1.11/316.
Following the HR variations, we also extracted the eight dif-ferent spectra indicated in Fig.3(second plot from the top). The HID does not show any significant correlation, but similarly to the case of observation 0306170401, it is possible to identify intervals of count-rates corresponding to higher/lower HR val-ues than average. Due to the lower statistics, all the HR-resolved spectra could be well fit by using a simple absorbed power-law model and we present all the results in TableA.1. Some of the results are also plotted in Fig.3(second plot from the top). The largest variation in the column density is found between spec-tra C and G, which correspond to the rise to the first large flare and the time interval before the second. The contour plots in Fig.3(bottom) shows that the variation is highly significant and cannot be associated with the degeneracy between the spectral slope and the absorption column density.
0 5000 104 1.5×10⁴ 2×10⁴ 0 10 20 Cts/s (0.5−12 keV) Time (s) 0123 4 Cts/s (0.5−3 keV) 0 10 20 Cts/s (3−12 keV) 46 8 HR A B C D E F G H 46 8 NH 0 5000 104 1.5×10⁴ 2×10⁴ 0. 5 1 1. 5 2 Γ Time (s) 0 1 1 46 8 10 HR Cts/s (0.5−12 keV) 4 6 8 10 0. 8 1 1. 2 1.4 Γ NH (1022) + + G C
Fig. 3. Same as Fig. 1, but for IGR J18450-0435
observa-tion 0728370801. As this observaobserva-tion was not reported previously in the literature, the source EPIC-pn light curve in the full energy range (0.5–12 keV) is also shown on the top plot (time bin 100 s). An adap-tive rebinning achieving S /N > 10 in each soft time bin was used to compute the HR and HID.
2.1.3. Observation 0728371001
In this observation the same instrument setup as in 0728370801 was used, and the presence of solar flares led to a reduced e ffec-tive exposure time of 8.5 ks for the EPIC-pn and 6.9 ks for the two MOS. The observation has not yet been reported elsewhere, and thus we show the EPIC-pn light curve in the full available
0 5000 104 0. 5 1 Cts/s (0.5−12 keV) Time (s) 0. 1 0. 2 0. 3 0.4 Cts/s (0.3−3 keV) 0. 5 1 Cts/s (3−12 keV) 0 2000 4000 6000 8000 104 2 4 6 8 HR Time (s) 0.1 0.2 0.5 1 24 6 8 HR Cts/s (0.5−12 keV)
Fig. 4.Same as Fig.3, but for the case of IGR J18450-0435 observa-tion 0728371001. An adaptive rebinning achieving S /N > 3 in each soft time bin was used to compute the HR and HID (the first ∼1.5 ks of observation visible in the top light curve were excluded for the compu-tation of the HR due to the low S/N and the fragmencompu-tation related to the filtering of the high background time intervals).
energy band in Fig. 4, together with the energy-resolved light curves and the corresponding HR/HID.
The source displayed low level X-ray flaring activity, but no significant HR variation could be seen (see Fig. 4). This is also confirmed by the HID in which all points are consis-tent with each other (within the uncertainties). Consequently, we report for completeness on the average X-ray spectrum extracted from the three EPIC cameras, but we did not perform any HR-resolved spectral analysis. The best fit to the average spectra was achieved by using a simple absorbed power-law model. We mea-sured an absorption column density of (3.9 ± 0.6) × 1022 cm−2
and a power-law photon index of 1.4 ± 0.2. The normalization constant of the MOS1 (MOS2) with respect to the pn was of 1.1 ± 0.1 (0.96 ± 0.09). The average 1–10 keV X-ray flux mea-sured from the spectral fit is 2.5 × 10⁻¹² erg cm−2s−1(not cor-rected for absorption).
0. 5 1 1. 5 2 (0.5−3 keV) 1 2 Cts/s (3−12 keV) 1234 5 Cts/s A B C DE F G 2 4 NH 0 2000 4000 6000 8000 12 3 Γ Time (s) 1 1 . 0 0.2 0.5 2 5 12 3 HR Cts/s (0.5−12 keV) 2 3 4 1 1. 5 2 2. 5 3 Γ NH (1022) + C G 2 3 4 1 1. 5 2 2. 5 3 Γ NH (1022) +
Fig. 5.Same as Fig.1, but for the case of IGR J17544-2619 observa-tion 0148090501. An adaptive rebinning achieving S /N > 10 in each soft time bin was used to compute the HR and HID. The most relevant time intervals for the spectral variations are in this case “C” and “G”.
2.2. IGR J17544-2619
2.2.1. Observation 0148090501
This observation was originally reported by González-Riestra et al. (2004), who retained for the scientific analysis the entire exposure time available. During our re-analysis of the data, we found that about ∼40% of the total exposure time was signifi-cantly affected by a heavily flaring background and thus, based on the presently available suggestions in the XMM-Newton data analysis threads, we discarded the corresponding time intervals for further analysis. One structured flare was recorded from the source during a time interval where the background was low and stable. The energy-resolved light curves of IGR J17544-2619 are shown in Fig.5, together with the corresponding HR and HID.
Due to the relatively low S/N below 3 keV, no RGS spectra could be extracted from this observation. The summed EPIC-pn, MOS1, and MOS2 average spectra could be well fit (χ2
red =
1.0/150) by using a simple absorbed power-law model. We mea-sured NH = (2.9 ± 0.2) × 1022 cm−2andΓ = 1.95 ± 0.11. The
0. 5 1 1. 5 2 Cts/s (0.5−3 keV) 12 3 Cts/s (3−12 keV) 12 3 HR AB C D Bkg 2 4 NH 0 2000 4000 6000 12 3 Γ Time (s)
Fig. 6.Same as Fig.1, but for the case of IGR J17544-2619 observa-tion 0154750601. An adaptive rebinning achieving S /N > 11 in each soft time bin was used to compute the HR before filtering the light curves for the high flaring background. Only the time intervals marked with a red solid line in the fourth panel from the top could be used for the spectral analysis, due to the high flaring background that affected the rest of the observation.
absorbed 1–10 keV flux is 5.5 × 10⁻¹² erg cm−2 s−1 (effective
exposure time 6.6 ks).
To investigate the source spectral variability during the flare, we extracted six spectra corresponding to the HR changes in Fig. 5. They could all be well fit with a simple absorbed power-law model and we present the results in TableA.2. The largest change in the source spectral parameters was observed between the rise to the flare (interval C) and the post flare spec-trum (interval G). The latter has a similar HR to the pre-flare in-terval A, but also a higher statistics. This result is also confirmed by the HID, which shows that the highest HR is not achieved at the highest intensity. The contour plots of the spectra C and G suggested that the power-law photon index was harder during the rise to the flare, accompanied by a likely increase in the absorp-tion column density. We note that the flux of the source before the flare was a factor of ∼5 lower than that achieved at the end of the flare. The relatively poor statistics of the A spectrum do not allow for a more refined assessment of possible spectral changes before and after the flare.
2.2.2. Observation 0154750601
The EPIC-pn and the MOS1 were operated in timing mode, while the MOS2 was in full frame. The total exposure available was ∼8 ks for the two MOS cameras and 2.5 ks for the EPIC-pn (the EPIC-EPIC-pn started observing the target about 5.5 ks after the two MOS cameras).González-Riestra et al.(2004) were the fist to report on these data and retained for the scientific anal-ysis the entire exposure time available. During our re-analanal-ysis of the data, we found that the observation was heavily affected by the flaring background. The background filtering technique suggested in the currently available XMM-Newton data analysis threads would result in a nearly complete rejection of all data, although the source displayed relatively bright flares during this observation. As the flaring background in the EPIC cameras is due to solar protons arriving onto the X-ray detectors with hardly predicable spectral properties, it is not possible to correct the
distortion in energy of the source spectra extracted during the af-fected time intervals5. The only data that can be safely used for
the scientific analysis are thus those collected during the time intervals marked with a red solid line in Fig.6(bottom panel). We carried out the spectral analysis only during these time inter-vals. Due to the fragmented exposure, we did not compute the HID for this observation. The average MOS1 and MOS2 spectra (effective exposure time 1.8 ks) fit simultaneously with an ab-sorbed power-law model provided the most accurate description of the source average X-ray emission. We measured NH= (2.2 ±
0.2) × 1022cm−2andΓ = 1.7 ± 0.1 (χ2
red/d.o.f. = 1.25/138). The
absorbed 1–10 keV flux is 2.4 × 10⁻¹¹erg cm−2s−1. The fit to the
average EPIC-pn spectrum (exposure time 1.2 ks) gave a consis-tent absorption column density (NH= (2.6 ± 0.4) × 1022cm−2)
and a slightly steeper power-law photon index ofΓ = 2.1 ± 0.2 (χ2red/d.o.f. = 1.28/64). This is in agreement with the lower HR visible in Fig. 6 toward the end of the observation (where the EPIC-pn data are available).
We then extracted four source spectra during the usable time intervals following the HR variations, as shown in Fig. 6 (the pn data were only available during the time interval D). We present the results of the fits to the spectra A−D in Table A.2 (some are also plotted in Fig.6). No significant variations of the spectral parameters could be revealed due to the large associated uncertainties.
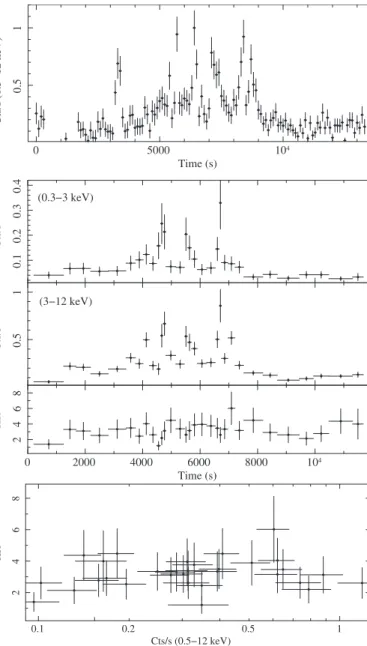
2.2.3. Observation 0679810401
The two MOS were operated in full frame, while the EPIC-pn was set in small window mode. No flaring background intervals were recorded. These data were first presented by Drave et al. (2014). The energy-resolved EPIC-pn light curves of the source are shown in Fig. 7, together with the corresponding HR and HID. The source displayed only a marginal flaring activity to-ward the end of the observation. We combined the three EPIC spectra and found that the average spectrum of the source could not be well described by a single absorbed power-law model (χ2red = 1.47/111). We adopted a partial covering model for the spectral fit and we measured NHlos = (1.3 ± 0.2) × 1022 cm−2, NH = (3.41.0−0.8) × 1022 cm−2, f = 0.73 ± 0.08, and Γ =
2.3 ± 0.2. The average (absorbed) 1–10 keV X-ray flux is 2.1 × 10⁻¹²erg cm−2s−1.
We extracted five spectra following the HR variations in Fig.7and give the results of the fits to these spectra in TableA.2. The relevant contour plots obtained from the spectral fits are shown in Fig. 7 (bottom). We found an indication of a slight increase in the absorption column density and hardening of the power law during the rise to the faint flare (spectra B and D). This is also confirmed by the HID (Fig. 7, middle) which shows that the source emission becomes harder at count-rates &0.5 cts s−1.
2.3. SAX J1818.6-1703
2.3.1. Observation 0693900101
This is the only available observation where the source was pointed and detected by XMM-Newton (see also Bozzo et al. 2008a, 2012). A first analysis of these data was reported by Boon et al. (2016). During our re-analysis of the data, we no-ticed that the observation was affected by a high background
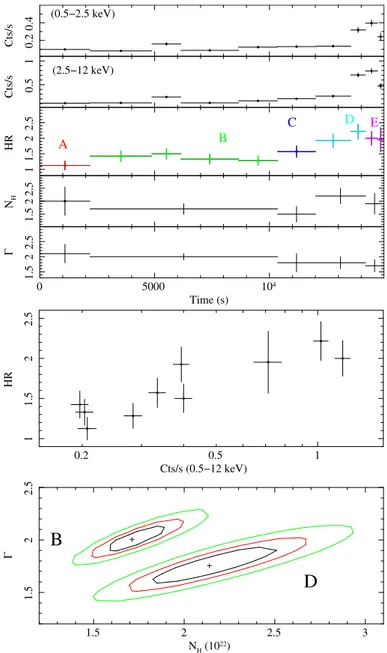
5 http://xmm.esac.esa.int/external/xmm_user_support/ documentation/uhb/epicextbkgd.html 0. 2 0.4 Cts/s (0.5−2.5 keV) 0. 5 1 Cts/s (2.5−12 keV) 1 1. 5 2 2.5 HR A B C D E 1. 5 2 2.5 NH 0 5000 104 1. 5 2 2.5 Γ Time (s) 1 5 . 0 2 . 0 1 1. 5 2 2.5 HR Cts/s (0.5−12 keV) 1.5 2 2.5 3 1. 5 2 2.5 Γ NH (1022) + +
B
D
Fig. 7.Same as Fig.1, but for the case of IGR J17544-2619 observa-tion 0679810401. An adaptive rebinning achieving S /N > 11 in each soft time bin was used to compute the HR and HID.
during the last 8.3 ks, and thus we discarded these data for the spectral analysis. The EPIC-pn was operated in small window, while the two MOS were operated in full frame. Given the rel-atively high count-rate of the source after the initial ∼15 ks, the MOS suffered significant pileup, and thus we discarded these data (the quality of the pn data was high enough to carry out all necessary investigations). The average EPIC-pn spectrum (e ffec-tive exposure time 15.6 ks) could be fit with a simple absorbed power-law model. We measured NH= (27.0 ± 1.1) × 1022cm−2,
Γ = 0.48 ± 0.06, and a flux of 3.5 × 10⁻¹¹ erg cm−2s−1 in the
1–10 keV energy range. As the source is heavily absorbed, we did not attempt an extraction of the RGS data.
We extracted the adaptively rebinned EPIC-pn light curves of SAX J1818.6-1703 and computed the source HR/HID shown in Fig.8. We extracted a number of HR resolved spectra follow-ing the HR variations. Simultaneous MOS1 and MOS2 spectra were only extracted for the time intervals A, B, C, and D to avoid pileup issues. We fit all EPIC spectra with an absorbed power-law model, which provided a good description of the data in all
0. 5 1 Cts/s (0.5−4.5 keV) 0 5 10 Cts/s (4.5−12 keV) 5 10 15 HR A B C D F G E 20 30 40 NH 0 5000 104 1.5×10⁴ 2×10⁴ 012 3 Γ Time (s) 1 10 0.5 2 5 5 10 HR Cts/s (0.5−12 keV) 15 20 25 30 35 40 0 2 + 15 20 25 30 35 40 0 2 + 15 20 25 30 35 40 0 2 + Γ NH (1022) + D A G F
Fig. 8.Same as Fig.1, but for the case of SAX J1818.6-1703 observa-tion 0693900101. An adaptive rebinning achieving S /N > 12 in each soft time bin was used to compute the HR and HID.
cases. The results are summarized in TableA.3and partly plot-ted in Fig.8. We recorded a progressive hardening of the X-ray emission during the rise to the flare (time intervals A, B, C, D, and E) and a significant decrease in the absorption column den-sity at the peak of the event (time interval F). The data also show some evidence of a re-increase of the NHfollowing the peak of
the flare. Remarkable changes were also observed in the power-law spectral index, as suggested by the HID (where the source emission becomes harder at higher count-rates). In order to fur-ther confirm these findings, we also show in Fig.8the relevant contour plots of the fit parameters derived from the analysis of the HR-resolved spectra.
2.4. IGR J17354-3255
2.4.1. Observation 0693900201
During this observation, not yet reported in other works, the EPIC-pn was operated in small window mode, but unfortunately it was pointed to a different nearby source and thus the collected
data are not usable. The two MOS cameras were instead oper-ated in full frame and thus included IGR J17354-3255 in their field of view. In the following, we only report on the MOS data analysis and we merge in all cases the MOS1 and MOS2 spectra by using the SAS tool
epicspeccombine
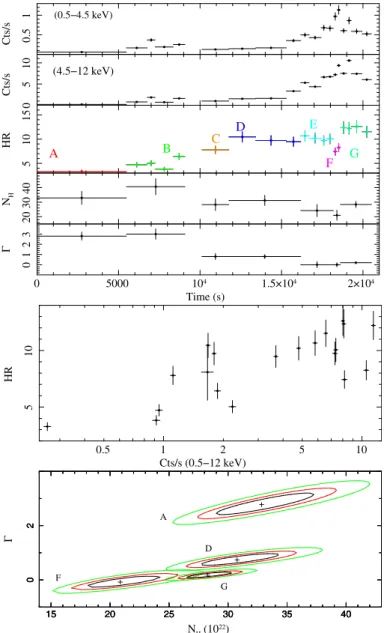
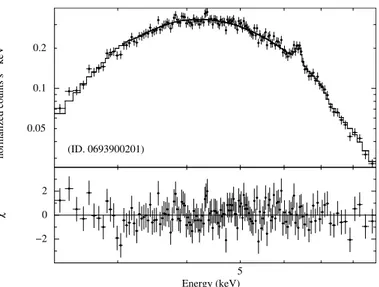
to improve the statis-tics. The observation was affected by a moderately high back-ground for the first ∼3 ks and by very high backback-ground during the last ∼6 ks. We retained the first 3 ks of the observation as bright flares from the source were also detected, and discarded the last part of the observation for the scientific analysis. The av-erage spectrum of the source is shown in Fig.10as an example (which looks similar to the spectra extracted from the following two observations 0701230101 and 0701230701). An acceptable fit to this spectrum (χ2red/d.o.f. = 0.87/146) could be obtained by
using an absorbed power law and a neutral iron emission line. We measured NH= (10.2 ± 0.2) × 1022 cm−2,Γ = 1.34 ± 0.04,
EFe = 6.36 ± 0.02 keV, EQWFe = 0.06 keV, and a flux of
3.2 × 10⁻¹¹ erg cm−2 s−1 in the 1–10 keV energy range (e
ffec-tive exposure time 27.6 ks).
The energy-resolved light curves of the source are shown in Fig.9, together with the corresponding HR and HID. To investi-gate the variability suggested by the changes in the HR across the observation we extracted the HR-resolved spectra A−E indicated in the same figure. All spectra could be well fit with an absorbed power law and we present all results in TableA.4. Some of the results obtained from the HR-resolved spectral analysis are also shown in Fig. 9, together with the contour plots of the rele-vant spectral parameters determined from the fits. The most no-ticeable changes in the source spectral parameters are recorded during the lower X-ray intensity period (interval C) separating the flares at the beginning and at the end of the observation. This is also clearly visible from the HID, which shows that the high-est HR values are achieved at the count-rate specifically recorded toward the middle of the low X-ray intensity period.
2.4.2. Observation 0701230101
During this observation, not yet reported in other literature works, the three EPIC cameras were operated in large win-dow mode and several time intervals affected by a high back-ground were recorded. The merged EPIC-pn and MOS spectrum extracted by using all available exposure time (17.1 ks) could be well fit (χ2red/d.o.f. = 1.11/667) with an absorbed power-law model, plus a neutral iron emission line. We measured NH =
(7.4 ± 0.2) × 1022cm−2,Γ = 1.40 ± 0.04, EFe= 6.43 ± 0.02 keV,
EQWFe= 0.04 keV, and a flux of 1.1 × 10⁻¹¹erg cm−2s−1in the
1–10 keV energy range.
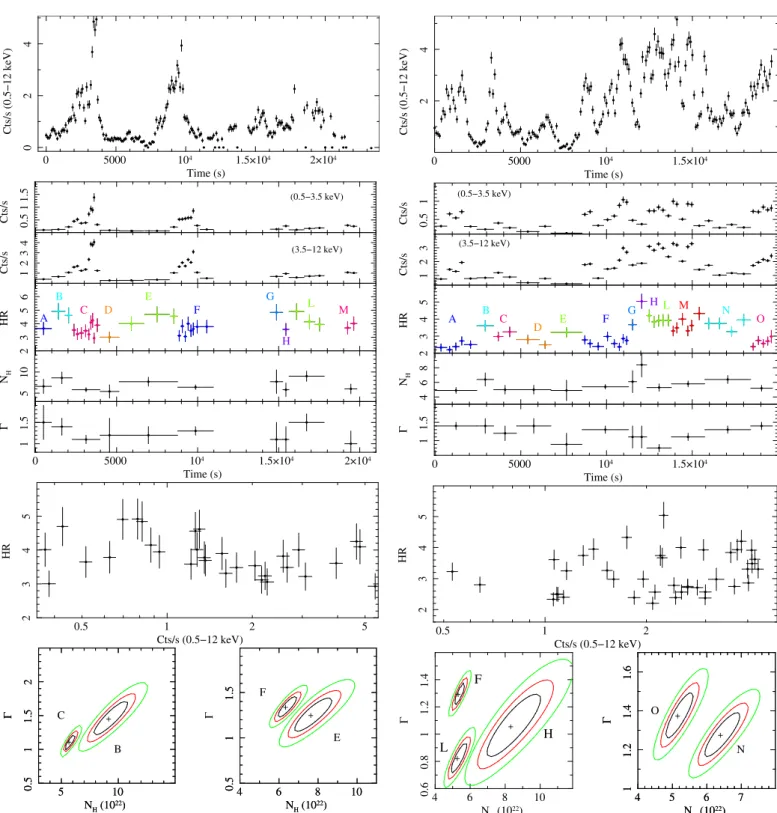
After having excluded the affected time intervals, we ob-tained the energy-resolved light curves displayed in Fig.11, to-gether with the corresponding HR and HID. A number of moder-ately bright flares were recorded from the source. We extracted the source A−M spectra during the HR variations as indicated in Fig.11and fit them with an absorbed power-law model. The results are summarized in TableA.4and some are also plotted in Fig.11. We recorded a significant increase in the absorption column density preceding the two flares (time intervals B and E) and a drop close to their peaks (time intervals C and F).
2.4.3. Observation 0701230701
During this observation, not reported yet in other works, the EPIC cameras were operated in large window mode and no high background time intervals were recorded. We could thus
0 5000 104 1.5×10⁴ 2×10⁴ 2.5×10⁴ 0. 5 1 1. 5 2 Cts/s (0.5−10 keV) Time (s) 0. 5 1 Cts/s (0.5−3.5 keV) 1 2 Cts/s (3.5−12 keV) 5 10 15 HR A B C E D 10 15 20 NH 0 5000 104 1.5×10⁴ 2×10⁴ 2.5×10⁴ 1 1.5 Γ Time (s) 1 2 5 . 0 5 10 15 HR Cts/s (0.5−12 keV) 10 15 20 25 0. 5 1 1.5 Γ NH (1022) + A 10 15 20 25 0. 5 1 1.5 Γ NH (1022) + B 10 15 20 25 0. 5 1 1.5 Γ NH (1022) + C 10 15 20 25 0. 5 1 1.5 Γ NH (1022) + D 10 15 20 25 0. 5 1 1.5 Γ NH (1022) + E
Fig. 9.Same as Fig.3, but for the case of IGR J17354-3255 observa-tion 0693900201. An adaptive rebinning achieving S /N > 7 in each soft time bin was used to compute the HR and HID.
retain the entire exposure time available for the scientific anal-ysis. The average spectrum obtained by merging all EPIC cameras (effective exposure time 19.1 ks) could be well fit (χ2red/d.o.f. = 1.11/667) with an absorbed power-law model plus an iron emission line. We measured in this case NH = (6.0 ±
0.1) × 1022 cm−2, Γ = 1.28 ± 0.03, E
Fe = 6.41 ± 0.02 keV,
EQWFe= 0.04 keV, and a flux of 1.0 × 10⁻¹¹erg cm−2s−1in the
1–10 keV energy range.
The source displayed a remarkable variability, with moder-ately bright flares and short intervals of fainter X-ray emission.
0.1 0.05 0.2 normalized counts s −1 keV −1 (ID. 0693900201) 5 −2 0 2 χ Energy (keV)
Fig. 10. Merged MOS spectra of IGR J17354-3255 in
observa-tion 0693900201. The best fit is obtained with an absorbed power law plus a neutral iron emission line (see text for details). The residuals from the fit are shown in the bottom panel.
The energy-resolved light curves of the source are shown in Fig.12, together with the corresponding HR and HID. At odds with the case of observation 0693900201, the most prominent HR variations were recorded during the flares. The HID shows that there is not a clear trend of the HR as a function of the X-ray intensity, but rather that the HR varies sporadically during some specific rise/decay phases of the flares. The results of the HR-resolved spectral analysis are presented in TableA.4and Fig.12. We recorded significant increases in the absorption column den-sity slightly before the rises of the different flares (time intervals H and N), accompanied by moderate power-law slope variations and NH drops at the peak of those events (time intervals F, L,
and O).
2.5. IGR J16328-4732
2.5.1. Observation 0679810201
These data were first analyzed by Fiocchi et al. (2016), who found that no particularly high-flaring background time inter-val affected the data, and thus the entire exposure time could be used for the scientific analysis. The source displayed several relatively bright flares, achieving up to ∼6 cts s−1in the EPIC-pn (0.5–12 keV). We verified that no pileup was present in the data. The EPIC-pn energy-resolved light curves of the source are shown in Fig.13, together with the corresponding HR and HID. A total of 16 EPIC spectra were extracted following the HR vari-ations shown in the figure (the MOS1 and MOS2 spectra were corrected for pileup whenever required). The pn, MOS1, and MOS2 spectra were fit together with a simple absorbed power-law model. All results are summarized in TableA.5and some are also plotted in Fig.13. The largest spectral variations, especially in terms of absorption column densities, are recorded between the time interval C preceding the rise to the second flare and E or N (corresponding to the peaks of the two flares). The time interval L is also characterized by a relatively low absorption and corresponds to the separation between the second and the third flare. We note that the count-rate corresponding to these specific intervals are those for which the HID also shows a large increase/decrease in the HR (see Fig.13).
0 5000 104 1.5×10⁴ 2×10⁴ 02 4 Cts/s (0.5−12 keV) Time (s) 0. 5 1 1.5 Cts/s (0.5−3.5 keV) 123 4 Cts/s (3.5−12 keV) 2345 6 HR A C E F H B D G L M 5 10 NH 0 5000 104 1.5×10⁴ 2×10⁴ 1 1.5 Γ Time (s) 1 2 5 5 . 0 234 5 HR Cts/s (0.5−12 keV) 5 10 0. 5 1 1. 5 2 Γ NH (1022) + B C 5 10 0. 5 1 1. 5 2 Γ NH (1022) + 4 6 8 10 0. 5 1 1.5 NH (1022) + E F 4 6 8 10 0. 5 1 1.5 Γ NH (1022) +
Fig. 11.Same as Fig.3, but for the case of IGR J17354-3255 observa-tion 0701230101. An adaptive rebinning achieving S /N > 10 in each soft time bin was used to compute the HR and HID.
2.5.2. Observation 0679810301
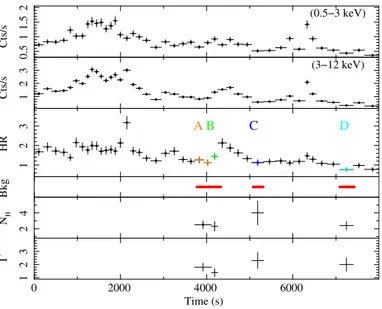
The analysis of these data was first discussed byFiocchi et al. (2016). We report the source EPIC-pn energy-resolved light curves in Fig.14, together with the corresponding HR and HID. The time intervals indicated in this figure (top) were used to extract the HR-resolved spectra for the EPIC-pn, MOS1, and MOS2 cameras. All these spectra could be well fit with a sim-ple absorbed power-law model and we summarize all the re-sults in Table A.5 (some results are also plotted in Fig. 14). Although the overall flaring behavior seems remarkably similar
0 5000 104 1.5×10⁴ 2 4 Cts/s (0.5−12 keV) Time (s) 0. 5 1 Cts/s (0.5−3.5 keV) 12 3 Cts/s (3.5−12 keV) 234 5 HR A C E F H B D G L M N O 46 8 NH 0 5000 104 1.5×10⁴ 1 1.5 Γ Time (s) 1 0.5 2 234 5 HR Cts/s (0.5−12 keV) 4 6 8 10 0. 6 0. 8 1 1. 2 1.4 Γ NH (1022) + + + L F H 4 5 6 7 1 1. 2 1. 4 1.6 Γ NH (1022) + N O 4 5 6 7 1 1. 2 1. 4 1.6 Γ NH (1022) +
Fig. 12.Same as Fig.3, but for the case of IGR J17354-3255 observa-tion 0701230701. An adaptive rebinning achieving S /N > 12 in each soft time bin was used to compute the HR and HID.
to that discussed for observation 0679810201, in the present case we measured more pronounced variations of the spectral slope (ranging from 0.3 to 1.7). The contour plots obtained from the different intervals show that in most cases there is a large de-generacy betweenΓ and NH, and isolating significant changes in
the absorption column density proved to be more difficult (this is also confirmed by the relatively flat HID). The largest variation of the NHwas recorded between the intervals M/N and D, but we
were forced to merge together the data of the M and N intervals in order to improve the S/N and obtain the results shown at the
0. 2 0.4 Cts/s (0.5−2.5 keV) 24 6 Cts/s (2.5−12 keV) 5 10 15 20 HR A B C D E FGH L M NO P Q R S 10 20 NH 0 104 2×10⁴ 3×10⁴ 1 2 Γ Time (s) 1 2 5 5 . 0 5 10 15 20 HR Cts/s (0.5−12 keV) 10 15 20 1 1. 5 2 + C 10 15 20 1 1. 5 2 Γ NH (1022) + N
Fig. 13.Same as Fig.1, but for the case of IGR J16328-4732 observa-tion 0679810201. An adaptive rebinning achieving S /N > 7 in each soft time bin was used to compute the HR and HID.
bottom of Fig.14. The time interval D is particularly interesting because the corresponding spectra were characterized by a re-markably low absorption for which we could only set an upper limit of <7 × 1022cm−2(at a 90% confidence level).
3. Overview of the results
In this section, we summarize the most relevant findings for each of the five sources. The interpretation of these results is discussed in Sect.4.
– IGR J18450-0435: the source displayed relatively bright flares in all three of the observations we reported on. The most prominent flares were recorded during observa-tion 0306170401, being characterized by a flux increase of &10 with respect to the following quiescent period (the time interval Z). Despite this variability, we only measured a mod-est increase in the absorption column density (a factor of ∼2) between the flares and quiescence. We found evidence
0. 5 1 Cts/s (0.3−3.5 keV) 24 6 Cts/s (3.5−12 keV) 5 10 HR Q P N L E A B C D F G H M O 10 15 20 NH 0 5000 104 1.5×10⁴ 01 2 Γ Time (s) 1 2 5 5 . 0 5 10 HR Cts/s (0.5−12 keV) 0 5 10 0 0. 5 1 Γ NH (1022) + D M+N 0 5 10 0 0. 5 1 Γ NH (1022) +
Fig. 14.Same as Fig.1, but for the case of IGR J16328-4732 observa-tion 0679810301. An adaptive rebinning achieving S /N > 6 in each soft time bin was used to compute the HR and HID.
of an increase in the absorption during the rise to the main flares (time intervals A, B, G, and O) and of a drop in the absorption column density every time the source approached the peak of a flare (the most significant being during the in-terval S). The quiescent time inin-terval Z is more difficult to characterize, but the fit with the partial covering model re-vealed a moderate but significant increase of the partial ab-sorber column density compared to the average spectrum. A similar behavior was found during observation 0728370801. In this case, the increase in the absorption column density be-fore the flare was recorded during the time interval C, while a (moderate) decrease was revealed from the fits to the inter-vals D and G. We found some evidence for a re-increase in the absorption column density during the decay of the flares, i.e., between spectra C and D in observation 0306170401 and between spectra G (D) and H (F) in observation 0728370801. – IGR J17544-2619: the source showed moderately bright flares during observation 0148090501, achieving an overall dynamic range of&10 in the X-ray flux. The HR increases
during the rise to the flare (time interval B) and drops close to the peak of the event (time interval E). We found some evidence of an increase in NH during the rise (time
inter-val C), but it seems that it is the combined effect of the vari-ation in NHandΓ that drives the changes in most of the
an-alyzed intervals. While we cannot firmly assess which spec-tral parameters are changing during observation 0154750601 due to the contamination from the flaring background, some other interesting HR variations were recorded during obser-vation 0679810401. We measured an increase in the absorp-tion column density and hardening of the power law during the time intervals B and D that precede the peak of a faint flare of the source. Unfortunately, the observation ends be-fore any data can be collected on the post-flare emission to verify a possible re-enhancement of the absorption column density with the decay of the X-ray flux.
– SAX J1818.6-1703: a progressive hardening has been mea-sured in the only available observation during the rise to the peak of a relatively bright flare (time intervals A, B, C, D, and E). This is mostly due to the change in the power-law slope, with only a minor change in the absorption column density. However, we measured a sharp drop in the absorp-tion column density slightly before the peak of the flare (time interval F). We also reported marginal evidence for a re-enhancement of the local absorption following the peak of the flare (time interval G).
– IGR J17354-3255: during observation 0693900201, the source displayed little (if any) spectral variability during the rise and drop from the two brightest X-ray flares, but showed a prominent HR increase between them that corresponds to a factor of&3 enhancement in the local absorption col-umn density. In the other two observations, the source dis-plays an increase in the absorption column density preceding the source X-ray flares (time intervals B and E in observa-tion 0701230101, and H and N in observaobserva-tion 0701230701) and a decrease in the absorption column density during the brightest phases of the different flares (time intervals C and F in observation 0701230101, and F, L, and O in observa-tion 0701230701).
– IGR J16328-4732: observation 0679810201 shows that there seems to be little spectral variability during the decay from the first flare (time intervals A and B), while a significant increase in the local absorption column density precedes the second X-ray flare (time interval C). A drop in the absorption column density is recorded during the peaks of the flares, as shown by the results of the fits to the spectra in the time inter-vals E and N. We also measured significant variations of the power-law slope, which generally becomes softer during the time intervals corresponding to relatively low flux states (B, C, D, and R). During observation 0679810301, the variations in the power-law slope were more pronounced and this made it difficult to measure the changes in the absorption column density. In particular, we could not find a clear indication of an increase in NHbefore the rise to more prominent flares
and a decrease during the brightest phases of these events (as we measured in observation 0679810201). Quite peculiar are the cases of the time intervals C, H, and O, where a rela-tively high absorption column density is measured, although the corresponding value of the HR is low due to a significant steeping of the power-law slope. An interesting case is also that of the time interval D, which is characterized by the low-est absorption column density measured during observation and which is associated with the peak of a relatively faint X-ray flare.
4. Discussion
The goal of the present study is to use XMM-Newton data to ver-ify whether X-ray flares from the SFXTs can all be associated with the presence of intervening dense clumps from the super-giant star winds. Accurate measurements of the absorption col-umn densities during the flares are mandatory to achieve this goal. For the analysis of all data, we adopted a technique that we verified in previous publications as a particularly powerful probe of the accretion physics in wind-fed X-ray binaries. In particu-lar, we adaptively rebin the energy resolved light curves of all sources and use the correspondingly derived HR to drive the se-lection of the different time intervals for the spectral extraction.
The analysis of the flares reported in Sect. 2 and the cor-responding results summarized in Sect.3 show that, generally, an increase in the local absorption column density is recorded during the rise of these events; a drop follows when the source reaches the peak flux. In some cases a re-increase in the absorp-tion column density after the flare is also detected. This phe-nomenology was already pointed out during our previous analy-sis of the bright flare from IGR J18410-0535 (Bozzo et al. 2011) and the outburst from IGR J17544-2619 (Bozzo et al. 2016a). Similar variations in the absorption column density are expected if the flares/outbursts are triggered by the presence of stellar wind clumps approaching the compact object. The drop in NH
close to the peak of the X-ray activity can most likely be ascribed to the photoionization of the clump medium. A re-increase in e NH is expected after the flare, due to the recombination that
is allowed by the decreasing X-ray flux. We also reported a new detection of an enhanced absorption event not connected with an X-ray flare during observation 0693900201 of the SFXT IGR J17354-3255. Few other similar cases were reported in the literature and associated with the passage of a clump along the observer line of sight to the source without being accreted. This is expected due to the double role of the clumps mentioned in Sect.1.
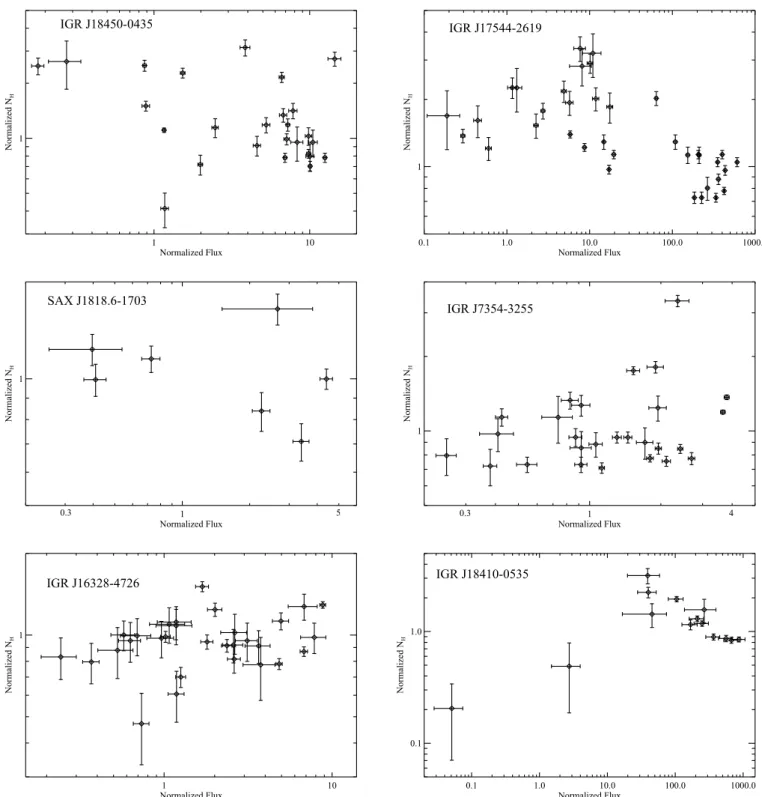
In order to carry out a statistically meaningful analysis of the results given in TablesA.1–A.5, we also built for each source the distributions of the NHas a function of the flux in Fig.15. We
plot for each observational time interval the measured absorp-tion column density and flux normalized to the weighted aver-age values (computed each time by excluding the reference time interval). We included the data from the previously published outburst of IGR J17544-2619 and the flare from IGR J18410-0535, as for these observations we had also exploited the HR-resolved spectral analysis technique. We used the time interval selection presented in Fig. 6 ofBozzo et al.(2016a) and Fig. 7 ofBozzo et al.(2011) and re-fit the corresponding spectra with the
phabs*pegpow
model in order to have consistent measure-ments of the spectral parameters and fluxes for the entire data-set. Using a normalized NHallows us to carry out an easiercom-parison between the results obtained for the different sources and draw some preliminarily conclusion for the SFXT as a class.
Two main results emerge from Fig.15. The first result is that there is no significant correlation between the dynamic range in the X-ray flux and the dynamic range in the absorption col-umn density achieved by any of the sources. This means, for example, that sources achieving a broader dynamic range in the X-ray flux do not necessarily display the largest swings in ab-sorption column density. The widest dynamic range in NHwas
measured during the bright flare from IGR J18410-0535 (a factor of ∼15), which was also characterized by a dynamic range in the X-ray flux of a factor of ∼2000. In the case of IGR J17544-2619, which underwent several bright flares and one outburst with a
1 10 Normalized Flux 1 Normalized N H IGR J18450-0435 0.1 1.0 10.0 100.0 1000.0 Normalized Flux 1 Normalized N H IGR J17544-2619 1 Normalized Flux 1 Normalized N H SAX J1818.6-1703 0.3 5 1 Normalized Flux 1 Normalized N H IGR J7354-3255 0.3 4 1 10 Normalized Flux 1 Normalized N H IGR J16328-4726 0.1 1.0 10.0 100.0 1000.0 Normalized Flux 0.1 1.0 Normalized N H IGR J18410-0535
Fig. 15.Distributions of the normalized absorption column density as a function of the normalized flux (1–10 keV) measured from the
HR-resolved spectral analysis for the five sources in Sect.2(see text for further details). The previously published XMM-Newton data on the outburst of IGR J17544-2619 (Bozzo et al. 2016b) and the bright flare from IGR J18410-0535 (Bozzo et al. 2011) are also included. All uncertainties are at 1σ confidence level.
total dynamic range in the X-ray flux of ∼3.5 × 10³, the total
dy-namic range in the NHwas limited to a factor of ∼5. A similar
factor is measured in the case of IGR J18450-0435, which did not undergo an outburst but displayed several relatively bright flares (the total dynamic range in the X-ray flux was of.100). More limited dynamic ranges in the absorption column density (.3) have been recorded in the cases of IGR J16328-4726 and IGR J7354-3255, even though these sources displayed a flux dy-namic range similar to IGR J18450-0435 (the only exception is
the case of IGR J7354-3255 if the highest recorded NH
corre-sponding to the passage of a clump in front of the X-ray source is taken into account). This is in agreement with the general idea that clumps cannot be the only ingredient to explain the SFXT extreme X-ray variability. If this were the case, the dynamic range in the X-ray flux should be directly proportional to the den-sity contrast of the clump compared to the intra-clump medium and thus to the observed dynamic range of the absorption col-umn density. Instead, we measure similar NHswings in different
Table 3. Weighted mean of the normalized absorption column density as a function of a chosen flux interval in the two SFXTs IGR J17544-2619 and IGR J18410-0535.
Normalized flux range Normalized NH(uncertainty)
IGR J17544-2619 0.1–1.0 1.35 (0.08) 1.0–20.0 1.25 (0.02) 20.0–1000.0 0.90 (0.01) IGR J18410-0535 0.01–10.0 0.25 (0.12) 10.0–100.0 2.00 (0.09) 100.0–1000.0 0.95 (0.02)
Notes. All uncertainties are given at 1σ confidence level.
sources for X-ray dynamic ranges that differ by a factor of '100. The presence of mechanisms inhibiting the accretion of the stel-lar wind material in SFXTs can explain this discrepancy as they can boost the variability of these sources by switching between periods of quiescence and enhanced accretion (and vice versa) even when only moderate variations of the density of the stel-lar wind material take place in the surroundings of the compact object. This complication and the lack of a proper knowledge of the NS spin period and magnetic field intensity in the SFXTs prevent us fro efficiently using the measurements of the column density variations in the these sources to estimate the physical properties of the stellar clumps (see Sect.1).
The second result that emerges from Fig.15 is an indica-tion that for the SFXT sources the absorpindica-tion column densities measured at the highest fluxes are lower than those measured during the low and intermediate fluxes. Among all the sources in the present sample, IGR J17544-2619 and IGR J18410-0535 provide the clearest evidence for such phenomenon. This is not surprising because these are also the only two sources that have been observed by XMM-Newton in a sufficiently wide range of X-ray flux to draw a more corroborated conclusion. To quan-tify this conclusion to the best of our current possibilities, we calculated the weighted mean and the standard deviation of the normalized NHin different normalized flux intervals for the two
sources. The results are provided in Table3. We note that for the SFXT sources a lower absorption column density at the high-est fluxes compared to lower flux states is expected according to previous discussions in this section, as the largest increase in the absorption column density is measured during the rise of the flares/outbursts and a drop should occur above the threshold at which the clump material is significantly photoionized. Fu-ture XMM-Newton observations of the confirmed SFXTs during quiescence, flares, and outbursts will permit us to improve this analysis and carry out more quantitative statistical investigations of the entire class of sources.
4.1. Classification of SFXT flares and outbursts
Our poor understanding of the mechanisms inhibiting accretion in the SFXTs does not allow us to directly infer the properties of the stellar wind clumps; however, we can propose a pre-liminary classification of the enhanced accretion episodes from these sources to link the observations with the accretion physics and make prediction which could drive future investigations.
Based on our current theoretical understanding of the SFXT accretion physics and the evidence collected so far from the X-ray observations, we propose the following four categories of flares/outbursts:
A: flares (LX ' 1034–1035 erg s−1) that are generated by the
impact of moderately dense structures. These dense struc-tures are not able to fully overcome all the mechanisms inhibiting accretion, and thus accretion is only partly restored during the flare6. As these structures are not extremely
mas-sive/dense, the increase in the local absorption can be limited (∆NH . 2–3) or even hidden within the uncertainty of the
NHin the direction of the source. If flares in category A are
observed from a source, it cannot be excluded that brighter flares in the following category B can also occur, and out-bursts in the categories C and D below as well.
B: flares (LX ' 1034–1035 erg s−1) that are generated by the
impact of sufficiently dense structures producing measurable increases in the local absorption (∆NH 3). If such flares
are found in a system, it is expected that the mechanisms inhibiting accretion are more difficult to overcome as mas-sive structures are needed to produce even moderately faint flares. Therefore, these sources should not show outbursts associated with modest or no increases in the absorption col-umn density (category C below). It is still possible that flares belonging to category A might occur at lower luminosities. C: outbursts (LX ' 1036–1038 erg s−1) that are generated by
the impact of moderately massive structures. The limited in-crease in the absorption during these events (∆NH. 2–3)
in-dicates that the inhibiting mechanisms are particularly easy to overcome. We should thus expect frequent outbursts from these systems and also fainter flares which do not display at all the signature of a measurable increased X-ray extinction (as the partial inhibition of accretion is overcome even more easily; category A). Flares belonging to category B should not be expected from these systems.
D: outbursts (LX ' 1036–1038 erg s−1) that are generated by
the impact of sufficiently dense structures to produce large increases in the absorption (∆NH 3). If the onset of an
outburst requires the presence of these structures, these sys-tems should show less frequent outbursts and a larger number of fainter flares (as for them it is, on average, more difficult to completely overcome the inhibition mechanisms). Flares from categories A and B can be expected; those in category B achieve higher luminosities.
In the XMM-Newton data available so far, we have found episodes in three of the above categories (A, B, and C), but out-bursts giving rise to very large variations in the accretion col-umn density ( 3, case D) have not yet been observed (the only outburst observed by XMM-Newton is the one from IGR J17544-2619 and it is of type C). We can also use, however, all previ-ously published results in the literature to perform a preliminary test of the proposed classification and of the applicability to dif-ferent sources.
In the case of the SFXT prototype IGR J17544-2619, large increases in the absorption column density were not de-tected during the many outbursts observed with Swift/XRT (Romano et al. 2008a,2011a,2014), XMM-Newton (Bozzo et al. 2016a), and Suzaku (Rampy et al. 2009), or during the fainter flares analyzed here. The spectral variability seems more re-lated to changes in the power-law photon index and so to the
6 It is generally believed that the inhibition of accretion is only com-pletely removed during the outbursts (see Sect.1).