UNIVERSITÀ DEGLI STUDI DI MACERATA
DIPARTIMENTO ECONOMIA E DIRITTOCORSO DI DOTTORATO DI RICERCA IN ECONOMICS AND MANAGEMENT - SOCIAL SCIENCES CURRICULUM MODELLI QUANTITATIVI PER LA POLITICA ECONOMICA CICLO XXIX
TOWARD A NEW SUSTAINABLE DEVELOPMENT FOR CHINA:
AN ENVIRONMENTAL MULTISECTORAL MODEL USING A
SOCIAL ACCOUNTING MATRIX
RELATORI DOTTORANDA Chiar.mi Prof. Claudio Socci, Francesca Spigarelli Dott: Barbara Menatta COORDINATORE Chiar.mo Prof. Maurizio Ciaschini ANNO 2017
3
Contents
INTRODUCTION………..7
FIRST SECTION: 1. GREEN GROWTH AND SUSTAINABLE DEVELOPMENT FOR CHINA: THE NEW CHALLENGES………..….12 1.1 China: the new approaches to sustainable development………12 1.2 The Chinese natural resources context and issues……….16 1.2.1 Natural resources………...17 1.2.2 Forests………...17 1.2.3 Land and degradation………18 1.3 Environmental issues and management……….20 1.3.1 Air pollution………..22 1.3.2 Water pollution……….27 1.3.3 Solid Waste and pollution……….29 1.3.4 Climate Change……….30 1.4 Environmental protection-oriented policies and programs: an overview………..31 1.4.1 The New Environmental Law………...36 1.4.2 Public Utilities Reform………37 1.4.3 Integrated reform plan for the promotion of the green projects………..38 1.4.4 National method of issuing of the Green Bonds………..39 1.5 China's energy transition: pathways for low carbon development………41 SECOND SECTION 2. INTRODUCTION TO MULTISECTORIAL ANALYSIS: THE CONSTRUCTION OF SOCIAL ACCOUNTING MATRIX FOR CHINA FOR THE YEAR 2011………45
2.1 From Input-Output table to Social Accounting Matrix………...45 2.2 The Social Accounting Matrix………..………..48 2.3 Environmental Accounting Extensions Framework………54 2.4 Why SAM?...57 2.5 Assessment of China’s economic data and literature review………..58 2.6 Construction of Social Accounting Matrix for China for the year 2011….………61
4 2.6.1 Input-Output Table………...68 2.6.2 Block of value added………72 2.6.3 Block of institutional sectors………75 2.6.4 Block of Capital Accounts………...77 2.6.5 Block of the rest of the world………...78 2.7 Balancing procedure………...78 2.8 Conclusions part I………80 3. EXTENDED MULTISECTORAL MODEL FOR ENVIRONMENTAL CHINESE ISSUES………82 3.1 The impact of income on environmental issues………..82 3.2 Principles of Multisectoral analysis: Miyazawa’s model………85 3.3 SAM base model……….88 3.4 The extended multisectorial model……….92 3.5 Multiplier analysis………...99 3.6 Modelling of CO2 Emissions……….101 3.7 Recent China’s policies and plans on Energy and CO2 emissions………...106 3.8 Policy evaluation with traditional multiplier approach………108 3.9 Conclusions second section………...115 THIRD SECTION 4. CHEMICAL SECTOR AND NEW SUSTAINABLE OPPORTUNITIES: ICA GROUP GREEN STRATEGY IN CHINA………...118
4.1 Introduction………...118 4.2 Empirical research: methodology………..120 4.3 Ica Group: the company’s history, strategy and international expansion………..122 4.4 Why China is strategic for ICA: chemical sector and “green” opportunities…....127 4.5 The roles of cultural distance and organizational differences: Ica’s strategy……132 4.6 A strategic alliance for the Chinese market………...135 4.7 The difficulties that Ica group was facing in China………..140 4.8 Conclusions third section………..141 REFERENCES………...………..143 APPENDIX………...152
5
List of Figures
Figure 1. Land Characteristic……….…19 Figure 2. CO2 Emissions from fuel combustion -IEA (Mt of CO2) ……….……….…24 Figure 3. Sulfure Dioxide Emissions (SO2) by Region……….26 Figure 4. Nitrogen Oxides Emissions by Region (2015)…...26 Figure 5. Chinese rivers by pollution level. % of evaluated length with worse than Grade V water……….…….27 Figure 6. Economic circular flow……….………...51 Figure 7. Synthetic scheme of SAM……….……….53 Figure 8: National Accounting Matrix and Environmental Account……….57 Figure 9. A scheme of China SAM for the year 2011……….………...68 Figure 10. Aggregates from China SAM for the year 2011……….……….69 Figure 11. Income Approach Components of Gross Regional Product (2011) ………….…72 Figure 12. Components of value added for industry………. ……….…...…73 Figure 13. Primary distribution of income for institutional sectors.……….76 Figure 14. Composition of final consumption and gross savings for institutional sector….78 Figure 15. Environmental Kuznets curve………..…….85 Figure 16. Representation of extended output circular flow……….……….…...95 Figure 17. Income circular flow used into the multisectoral model………97 Figure 18. Intensity coefficient of use of CO2 from industrial sector in 2011………….…105 Figure 19. Share pollution determined by final demand……….…….105 Figure 20. Reduction of China carbon intensity from 2005 levels……….…….108 Figure 21. CO2 kt emission changes of the traditional policies for Electricity, Gas and Water Supply……….….112 Figure 22. Level of output changes of the traditional policies for Electricity, Gas and Water Supply…….……….112Figure 23. CO2 kt emission changes of the traditional policies for Health and Social Work………114
Figure 24. Level of output changes of the traditional policies for Health and Social Work………114
6
Figure 26. Levels of total output changes determined by the effect of combined
policies………115 Figure 27. ICA GROUP Turnover in EUR 1998-2013………124 Figure 28. R&D Expenditure on GDP Italy and OECD……….…….124 Figure 29. % of overseas turnover ICA GROUP……….……….126 Figure 30. Countries (in blue) where ICA Group sell……….………….127 Figure 31. Chinese Inward and outward foreign direct investment flows………. ….129 Figure 32. Chinese leadership in manufacturing……….….130 Figure 33. Foreign direct investment: CHINA Inward and outward flows, annual 1982-2014 (milions of USD)………...…….131 Figure 34. Hofstede’s cultural dimension – comparison……….………135 Figure 35. ICA structure in China Source: ICA Group sources……….….137 Figure 36. Representation ICA CHINA’s market penetration strategy………..139 Figure 37. ICA sales forecasts China Source: ICA Group data base…..………140
List of Tables
Table 1. CO2 emissions from fuel combustion by sector in 2014……….……23 Table 2. Main Data sources for China’s SAM construction……….64 Table 3. Industry classification (comparison)………...73 Table 4. Endogenous and exogenous accounts in a SAM……….89 Table 5. Top Ten Sectors for CO2 emissions………...……105 Table 6. Main aggregate results through the Leontief Multiplier (milions of YUAN)...113 Table 7. Process of case study research………1227
Introduction
In most known definition, given by Brundtland report, sustainable development means integrating the economic, social and environmental objectives of society, in order to maximize human well-being in the present without compromising the ability of future generations to meet their needs (UN, 1987). This requires seeking mutually supportive approaches whenever possible, and making trade-offs where necessary. Sustainable development is not an activity that has to be left to the long term; rather, it constitutes a set of short, medium and long term actions, activities and practices that aim to deal with immediate concerns while at the same time address long-term issues. Achieving sustainable development requires far reaching policy and institutional reforms and the involvement of all sectors at all levels. In recent years, sustainable development has been representing an important economic policy objective for World Countries as a consequence of the strong awareness for climate changes and the ensuing environmental damage. Environmental policies generally consist on a set of measures oriented to improve efficiency on energy consumption and reduce inefficient behaviours. The use of such instruments, aimed to reduce the amount of emissions and promote environmental conservation according to international agreements, in some cases is still discouraged by politicians and governments which interpret this measures as burdens to economies.
After years of difficult dialogue and strong debate with the Western Countries on issues
related to environmental protection and reduction of CO2 emissions, the environmental
emergency has officially entered in the China’s Government agenda. This is certainly a major step towards the achievement of a unique action against the climate change concern, however, the environmental issue in China must be faced and debated like a “cultural revolution” that engages all the actors of the economic system from production activities to Institutional Sectors. The incredible economic growth of China, over the past three decades, is mainly attributed to its impressive industrial growth. However, industrial based economic growth may inevitably lead to environmental degradation. China is rated as one of the largest
contributors of carbondioxide (CO2) (IEA, 2008).
The “Green growth” for China have to pass through promoting economic growth while reducing pollution and greenhouse gas emissions (GHG), minimizing waste and inefficient use of natural resources, and maintaining biodiversity. An important objective for the
8
Government is to transform the Chinese economy from a current economic structure based on high levels of energy consumption at high levels of environmental impact and low efficiency, to a more sustainable growth model. At least at the national level, the Chinese
government has declared its intention to fight climate change. In line with the 13th five-year
plan, the central Government implemented a series of measures on energy efficiency, energy saving and renewable energies and was able to reduce energy intensity of its economy by 20% in the past five year.The country also is the world's biggest producer of renewable energies, but despite these successes and still moderate per capita emissions, China's total energy consumption and emissions continue to rise rapidly (World Resource Institute, 2016) As outlined in the Eleventh Five-Year Plan (2006–2010) and reiterated in the Twelfth Five-Year Plan (2011–2015), Chinese leaders are challenged by the simultaneous needs to ‘build a resource efficient and environmentally-friendly society’ and to ensure that growth is more equitable, both of which are integral to “building a harmonious society” (NDRC, 2011). In line with these, the Thirtheen Five-Year Plan (2016-2021) contains many proposed programs bear directly or indirectly on poverty reduction, environmental stewardship or both. They include rural land reform, cleaner industrial development, promotion of new energy vehicles, protection of forests, efficient water management, and an improved social insurance system aimed at lifting people out of poverty. Although the Chinese political goal of building a socialist harmonious society is not new, this still has not been achieved. Therefore, how can China rebalancing its economy to better address the related challenges of eradicating poverty, reducing inequality and protecting the environment?
Considering the following research question, the aim of this work is to study the impact of environmental policy for the reduction of CO2 emission taking in account the chinese distributional income analyses. In order to following the purpose of the research, one has to develop an appropriate methodological instrument. The framework chosen in order to follow this research’s objective is the Social Accounting Matrix (SAM). SAM is widely used for the analysis of income distribution in a socio-economic system. It is related to the National Accounts, but typically incorporates whatever degree of detail is required for special interests. The principal goal in constructing a SAM is to integrate elements of the income distribution into a single coherent accounting framework.
For these reasons, a big effort has been made for building a Chinese Social Accounting Matrix (SAM) for 2011, that offers an analysis leading to a better understanding of the way the various agents in the real chinese economy interact.
9
Subsequently, the SAM for China has been integrated with environmental accounts for CO2
emissions, with the purpose to include the link from the economy to the environment, exploring the relationship between production activities, pollution and income distribution. The analysis applied will be an extended income–output loop (derived from a SAM), that can be quantitatively tested by sending a shock on a given macro variable and observing the effects on another macro variable within the loop. From the SAM approach a model of circular income flow which is more articulated than the usual one emerges: each macroeconomic flow variable, conveniently disaggregated, generates a second flow variable through the use of a structural matrix and progressively so on until the loop is closed. Final demand determines total output and value added by industry; the latter generates domestic income by factors which compose disposable income by institutional sector; this gives rise to the final demand closing the loop. Consequently, there will be an identification of the traditional multipliers and the related impact components of a multisectoral model based on SAM integrated with the environmental accounting.
Following the objectives of 13th Five Year Plan, the International Agreement of climate
action and in accordance with the principles of sustainable development, the interventions designed by policy makers are required to aim at restructuring the final demand’s
composition so that it achieves a reduction of the CO2 emissions. The implementation of such policies highlights a set of problems of the macro variable choice that makes up the control policy’s final demand components, disposable income or other, of the determination of its amount, structure and balance (Ciaschini and all, 2011). For these reasons, in this work, it has been important to assess a new structure for the final demand which would be able to achieve a composite task: the economic sustainability and the environmental improvement. This work consists of three parts: the first part (that is located in chapter one) where the research topic is outlined, related to the sustainable development of China, develops the analysis of the macroeconomic environmental framework of the country. In relation to this, in the second part (composed of chapters two and three), the functional tools for research’s objective will be delineated. Finally, in chapter four, a paper developed within the Eureka project as integration of the work will be presented. In particular, the first chapter introduce the new approaches to sustainable development in China. In accordance with the last International Climate agreement, it will discuss the China’s policies strategies on order to reach a sustainable development considering the economic, social and environmental dimensions. After a brief introduction of the new China’s
10
Government policies for sustainable development, in the first section it will be presented an analysis the most important problem in term of environmental issues and and the main measures taken by the Government in the last years.
The second chapter starts with an historical overview of the lines of research that contributed to lay the ground of modern multisectoral analysis, from the first estimates of national income
in the seventeenth century to the most recent contributions to the SAM approach. It will
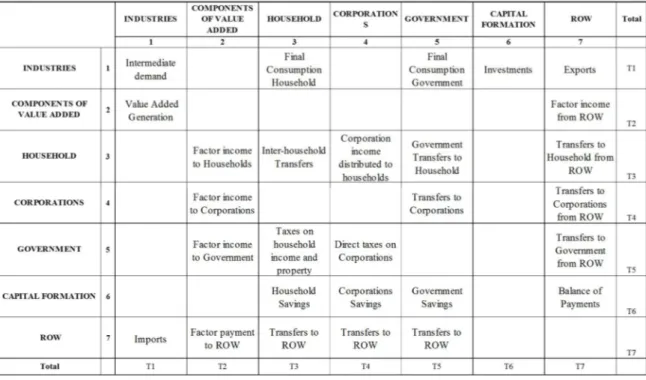
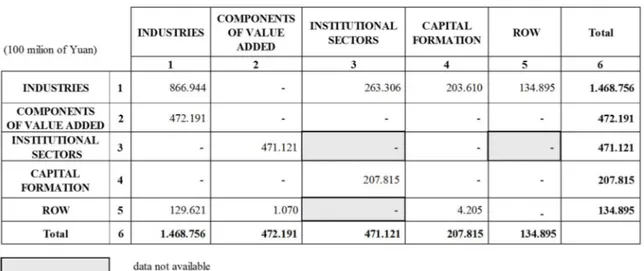
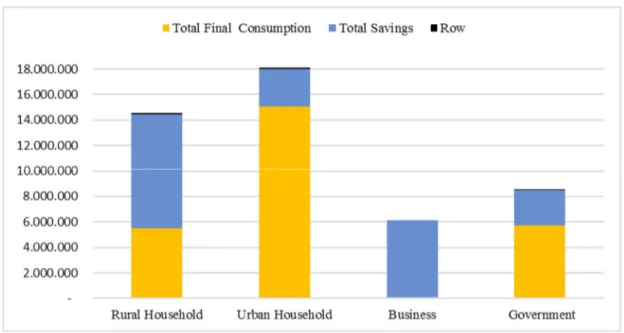
outline the accounting scheme of SAM and some environmental accounting extensions. The second section describes the SAMs for China for the year 2011. This is an original contribution and it has been built by the author to serve as database for the model presented in Chapter 3. In particular, it will be outlined the key reasons that led to choose this framework, the main steps of construction and the crucial role of Chinese data-sources, in terms of availability and consistency. In fact, SAM was constructed using data from various sources including input-output table, national accounts, government budgets, balance of payments, labor employment and wage statistics and household expenditure surveys. This SAM is a detailed representation of China’s economy in 2011; it covers thirtyfive industries, three types of primary factors and four institutional sector (of which two representative households, rural and urban groups), and four capital accounts (detailed by institutional sectors). The structural characteristics of China’s economy well presented in this SAM would be helpful to better understand the economic linkages.
The third chapter presents the extended multisectoral models based to the SAM and the
modelling for CO2 emissions. In particular, it has been focused on the studydies that have
analized the relationship between income distribution and environmental problems. The proposed multisectoral model is an extension of the Miyazawa approach (Miyazawa, 1970) through the integration of secondary income distribution (Pyatt, 2001). Considering the theoretical background mentioned in the previous section, a multisectoral model for China was constructed with the purpose of analysing certain policy measures and their impact on
the environmental dimension of sustainable development.Sudsequently, it will be showed
the mathematical formalization of the extended multisectoral model, from which it will get the final inverse matrix. This resulting inverse matrix will be used to identify which composition of the final demand (policy control variable) is consistent with the complex
target of reducing the CO2 emissions together with a positive variation of the aggregate total
11
Lastly, in chapter four a contribution will be presented which was developed during the three years in the context of the Eureka project, in collaboration with ICA Group company. In particular, the internationalization process in China for a family owned enterprise will be
analyzed, producing green products in a traditional polluting sector (coatings).The prospect
of analysis will be to outline how a focused strategy towards sustainable development in China today represents a fertile ground for the achievement of competitive advantages.
12
Chapter 1
GREEN GROW AND SUSTAINABLE DEVELOPMENT FOR
CHINA: THE NEW CHALLENGES
China’s double-digit economic growth rate of the past three decades has brought with it economic, social and environmental problems. In addition, to fostering a profound restructuring of the Chinese economy, these problems are at the core of the country’s shift in domestic action against climate change. Arguably, they have also motivated, at least in part, China’s uptake of a prominent role in international climate negotiations. This chapter will discuss the China’s policies strategies on order to reach a sustainable development considering the economic, social and environmental dimensions. After a brief introduction of the new China’s Government policies for sustainable development, in the first section it will be present an analysis the most important problem in term of environmental issues and and the main measures taken by the Government in the last years. In second section, it will present a focus on the evironmental programmes for promote the environmental sustainability and the strategy to reduce the carbon dependence.
1.1 China: the new approaches to sustainable development
China’s environmentally sustainable development challenge is arguably the most complex and difficult that any country has ever tried to confront. Over the past 30 years, since the modern period of economic reform began, the two most defining features of the development agenda have been persistent, rapid, and relentless economic growth accompanied by equally significant, even radical, economic and social changes. Nowadays, China is facing a profound transition, which is transforming it into an advanced economy, based on consumptions, services and innovation. The transformation path is crucial and it’s no more possible to postpone, for reviving Chinese industrial structure, which cannot longer be based on low labor costs and State intervention. We therefore find ourselves in a phase called by the Chinese authorities themselves "New Normal" (Yao, 2014). The new course of the Chinese economy is due to the recognition that a double figures growth model that has characterized China since the 80s is no longer possible. When Chinese Government now sets its economic growth target, this is no longer an aspirational bottom line, it is the
13
ceiling. While a 8 percent GDP growth target was overshot consistently during the past, a 7.5 percent, perhaps 7 percent, should be seen as the higher end of an expected range going forward (The Oxford Institute for Energy Studies, 2015). The “amounts” and “quantities” have to be substituted by the “quality”. For these reasons the New Normal is characterized by (Bin and Zhenyu, 2014): • the reduced GDP growth rate: the objective of Thirteenth five-year plan is to keep an average growth rate of 6.5% until 2020; • Quality Growth: a more sustainable growth and based on the most technologically advanced products; • Less public investment: investments made by public, as a result of the economic crisis in 2008-2009, have generated a crisis overcapacity and fed the debt; • Less exports: the decline in external demand and its volatility are forcing China to find sources more solid for the consumer demand; • More domestic consumption: the development of domestic consumption will replace the decline in foreign demand; • More services: China is expanding the share of services, which is representing, today, the main growth driver. Another key aspect regards the demographic growth and the challenges that the country will face in the future. According to data published by the National Chinese statistics February, 2016, the total population reached just over 1.373 million at the end of 2015, an increase of about 6 million over the previous year (+ 0.41%) (NBS, 2016). Although China's population remains the largest in the world, China has to cope with a rapidly aging process, due to an improvement of people's living style, the availability of better health services, and level (artificially) low fertility.
Taking in account what mentioned above, by 2030, China will account for over a fourth of the world's elderly population. Population aging is significantly affecting on the entire system, with negative socio-economic implications and many tensions. The pension social system is under pressure from the beginning of the 2009, with some difficulties in meeting the citizens’ demands.
China, after the decision of the State Council, has accelerated the development of strategic emerging sectors of industries. In particular, in 2010, it was taken the decision to assist priority industrial sectors with a big level of knowledge, the so-called "Seven pillar industries". These are: energy savings; environmental protection; new generation information
14
technology; biotechnology; advanced machinery; alternative energy; environmentally friendly vehicles (Fondazione Italia-Cina, 2016). Considering this, for policy makers in China, the development of a green economy and technology presents opportunities and challenges not only for the central government, but also for provincial and city governments. The rationales behind the transition to a green economy are driven by environmental, economic, and social considerations. Rapid economic development, urbanization and industrialization has left the country with a heavy environmental toll, which includes deteriorated air quality due to coal burning and other industrial pollutions, surging greenhouse gas emissions from fossil fuel consumptions, degrading water quality and resources, worsening rural environments and land-based ecosystems. The concentration of both air and water pollutants are among the highest in the world, causing damage to human health and lost agricultural productivity. The Chinese government has increasingly recognized the transition towards a green economy as a long-term strategy, to boost its economic growth along a sustainable path and protect its environment from further deterioration (Pan et all, 2011). This industrial and energy transition is evidenced by China’s adoption of energy and economic policies in recent years. As the largest developing country in the world, China has always placed development as the first priority.
A first draft of a National Sustainable Development strategy was included in the China’s Agenda 21, completed in 1993, not long after United Nations Conference on the Environment and Development held in Rio de Janeiro (UNCED,1993). China’s Agenda 21 contained development strategies and policies, divided in four main sections:
Overall strategies for sustainable development; Aspects of the sustainable development society; Sustainable development of the economy; Protection of resources and the environment.
The 11th Five-Year Plan (2006-2010) specifically addressed energy efficiency and
infrastructure improvements as key goals, while the 12th Five-Year Plan (2011-2015)
addressed environmentally sustainable economic growth as an important aspect of
development (Zhou, 2013). The 13th Five-Year Plan (2016-2020) was reviewed and approved
by the Fourth Session of the 12th National People’s Congress in March 2016, defining the development concept featuring innovative, coordinated, green, open, and shared development.
15
In the coming years, China will pursue innovative development and improve the quality and efficiency. The green development will be pursued by promoting a green and low-carbon development model and lifestyle, protecting the ecological system. Great efforts are needed to deepen opening-up, thus realizing win-win cooperation. Shared development will be facilitated to improve people’s wellbeing (NATIONAL PEOPLE CONGRESS OF CHINA, 2016).
In September 2015, Xi Jinping, President of China, attended the United Nations Sustainable Development Summit and joined other leaders in endorsing the 2030 Agenda for Sustainable Development, providing guidance to national development of member states and international development cooperation in the next 15 years. (The World Bank 2013) China suggested that nine strategical areas should be prioritized in the implementation of the 2030 Agenda. These areas are (UN, 2015): 1. Eradicating poverty and hunger through targeted measures to alleviate and eliminate poverty and enhancing agricultural production capacities and food security; 2. Implementing innovation-driven development strategies and generating momentum for sustainable, healthy and stable economic growth; 3. Advancing industrialization to inject impetus to coordinated development between urban and rural areas and among the three dimensions of sustainable development; 4. Improving social security and social services to ensure equal access to basic public services; 5. Safeguarding equity and social justice to improve people’s well-being and promoting all-around human development; 6. Protecting the environment and building protective barriers for eco-security;
7. Addressing climate change actively and integrating climate change response into national development strategies;
8. Promoting efficient utilization of resources and sustainable energy;
9. Improving national governance and ensuring economic and social development in line with the rule of law;
The exhaustion of China’s old economic model based on investment and manufacturing has had, at least, one positive outcome: a ‘new normal’ development pathway that is less energy and emissions intensive. Although much remains to be done by China (and others) to set the world on a climate-bearable path, China’s efforts are significant and its ratification of the Paris Agreement ahead of the G-20 (as explained in following 1.5 section)
16
1.2 The Chinese natural resources context and issues
China’s economy has grown rapidly since the country entered the reform path in 1978 and, particularly, since the industrial expansion started in the mid-1980s. Over the last decade, a huge economic progress has been made, whereas various issues have been emerged. Two of the biggest issues among the other are the limited strategic resources and the environmental degradation.
The resources demand has been exponentially mounting, which has caused various environmental problems. China will experience further stresses on the resource availability and environmental sustainability unless a “sustainable” development mode is achieved. In the recent decades, China is experiencing a rapid economic growth, industrialization and urbanization. Since 1978, China has witnessed an average annual economic growth rate of 9.7% (OEDC Economic Survey, 2015). Large progresses have been made in political, cultural and social reforms and remarkable achievements in its modernization. Meanwhile, rapid economic growth and social transformation have caused some challenges, for example, low efficient utilization of energy and resources, air pollution, water scarcity and pollution, severe ecological degradation, climate changes, as well as social fairness and rural development. There is little doubt that China is committed to sustain economic growth. However, in the past decades, the rapid economic growth has been criticized as unsustainable as it does not fully take into account the social and environmental costs. In fact, it is well known that the rapid economic progress of the last thirty years has been combined with the deterioration of the environmental situation in China. This impact is already evident. According to the World Bank, China has 16 of the world's 20 most polluted cities, with four of the worst in the main coal producing province of Shanxi (The World Bank, 2007). In 2005, only 31% of Chinese cities met national air quality standards and more than 75% of water in rivers in China's urban
areas cannot be used for drinking or fishing (Economy, 2007). The growing resources
demand has been mounting, which has caused various environmental issues.
The conflicts between environment and development are becoming ever more prominent. Relative shortage of resources, a fragile ecological environment and insufficient environmental capacity are critical problems hindering the future development.
Considerable environmental effects have occurred owing to the major efforts on the issues of conservation and clean-up in recent years. The Chinese government attaches great
17
importance to environmental protection, which is believed to have a direct impact on the overall situation of the modernization and long-term sustainable development. Due to these efforts, although the amount of resource consumption and pollutants is increasing greatly, the trend toward aggravated environmental pollution and ecological destruction is gradually slowing down. However, the overall environmental improvements need more comprehensive and effective measures, such as public awareness, information transparency, enforcement of environmental laws, capacity building of civil institution and the balance between economic development and environmental protection.
1.2.1 Natural resources
Being a vast country, China first of all has rich land resources.National land resources havethree main characteristics: variety in type cultivated land, forests, grasslands, deserts, and wetlands); (ii) a predominance of mountains and plateaus over flatlands and basins; and unbalanced distribution, with farmland mainly concentrated in the east, grasslands largely in the west and north, and forests mostly in the far northeast and southwest.
The country's farmland covers 122,400 sq. km, about 10% of its total land area, and is distributed mainly in plain areas in northeast China, north China, the middle and lower reaches of the Yangtze, the Sichuan Basin and the Pearl River Delta. Agriculture is highly developed in these areas, which are major producers of wheat, corn, rice and cash crops. The country has 67,500 sq. km of fresh water lakes, production bases for fish, shrimps and other aquatic products. The hydropower resource ranks first worldwide. It is one of the countries in the world having the most species of wild animals, and has almost all kinds of vegetation found in the Northern Hemisphere. The mineral resources are relatively abundant, with a great variety of minerals. Even so, the key challenge is the limited resources per capita compared with the World average, which probably is a stumbling block for the future development.
1.2.2 Forests
According to the findings of the 8th National Investigation on Forest Resources, the total forest area of the country was 208 milions of hectares, up by 12.23 milions of hectares, forest coverage at 21.63%. The findings of the investigation show that China’s forest resources have entered a stage at which its quantity and quality increased steadily. The most forested
18
area in the PRC is in the southern region, which accounts for 34% of the total, followed by the southwest and northeast regions, each of which has around 24% of the total. The north and northwest regions each have less than 10% of the total forested area.
China increased its tree cover by 49 million hectares (121 million acres) over 20 years, from 1990 to 2010. Reforesting 50 to 100 million hectares over just 15 years is a serious undertaking that will require enhanced efforts at rural outreach. Additionally, to deliver sustainable results, it’s important that China focuses on well planned reforestation efforts that improve rural livelihoods and ecosystem services, rather than on plantations and monocultures. The total biomass of forests in the country was 17.002 bn. tons, and total carbon reserve reached 8.427 billion tons. There was 580.709 bn. m3 for annual water conservation, 8.191 billion t for annual soil fixation, 430 million tons for annual conservation of nutrients, 38 million tons for annual adsorption of pollutants and 5.845 billion tons for annual dust retention.
In 2014, the authority launched special campaign to crack down on illegal encroachment of woodland, and initiated large-scale and national crackdown campaign of “2014 Net of Heaven Action” and “2014 Sharp Sword Action”. The state council issued suggestions on strengthening the prevention and Control of Biological Hazards, which was effectively implemented by relevant departments and the ability of monitoring and early warning,
quarantine, prevention and relief of disasters was significantly improved (Ministry of
Environmental protection, The People Republic of China, 2014).
1.2.3 Land and degradation
With a total land area of around 9.6 million square kilometers, China is the largest country in Asia and the third largest in the world, next to Russia and Canada. Even so, the arable land amounted to 0.27 hectares per capita in 2005, less than 40% of the world per capita average, one-eighth the U.S. level, and one-half the Indian level. China is facing the challenge of increasing food production while dealing with the problems of desertification, conservation of ecological systems and reforestation.
19
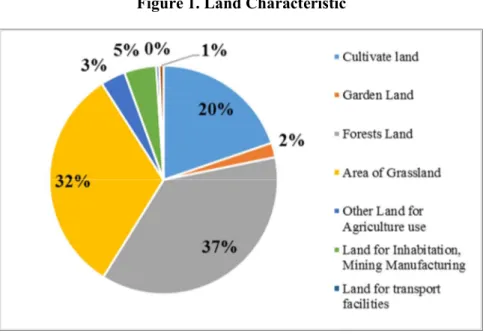
Figure 1. Land Characteristic
Source: National Bureau of Statistics of China 2015 http://www.stats.gov.cn/tjsj/ndsj/2015/indexeh.htm
Soil erosion affects 19% of China’s land area, one of the highest figures for any country. Erosion is especially devastating on the Loess Plateau on the middle stretch of the Yellow River, which is about 70% eroded, and increasingly on the Yangtze River, whose sediment discharge from erosion exceeds the combined discharges of the Nile and Amazon, the world’s two longest rivers. By filling up rivers (as well as reservoirs and lakes), sediment has shortened China’s navigable river channels by 56% between 1949 and 1990, and has restricted the size of ships that can use them.(Liu, Diamond, 2015).
According to the results of the land-use change survey in 2005, in comparison with 2004, the cultivated land declined by 0.30%, the garden land rose 2.31%, the forestland increased 0.30%, the pastureland dropped by 0.21%, the land for residential and industrial/mining sites went up 1.11%, the land for transport and communications grew up of 3.37% and the land for water conservancy facilities went up of 0.26%. Eight million hectares of farmland were lost over the past decade, and the area of cultivated land fell from around 130 million hectares in 1996 to 122 million hectares in 2005. One-fifth of its cropland has lost since 1949 (Day, 2005).
The MWR estimates that, in 2009, a total of 1.073 billion tons of soil was lost across the country due to water-related soil erosion. Although it is a widespread phenomenon across the country, 85.6% of total soil loss due to water erosion occurs in the Yangtze and Yellow river
20
watersheds, where the soil losses in 2009 were estimated to be 782 million tons and 137 million tons, respectively.
Several major factors contribute to the land loss. Half of the loss is due to the constructions growth. With accelerated industrialization and urbanization, China’s arable land has continued the drop down trend. Furthermore, the central government has promoted a program of restoration of degraded or fragile ecosystems, lower-quality arable lands having been appropriated for forest or grassland replanting efforts. This has been the dominant driver of arable land loss in recent years, accounting for 84.5%, 88.2%, 91.6%, and 87.3% of the annual net losses of the past four years, respectively. Rapidly degrading land quality is exacerbating the arable land availability. About 12.3 million hectares, representing more than 10% of China’s total arable land, is contaminated by polluted water, excessive fertilizer, heavy metals and solid wastes.
According to SEPA, every year about 12 million tons of crops are contaminated by heavy metal residues, causing direct economic losses for more than 20 billion RMB (US $2.5 billion). The extent of arable land also decreased - between 1957 and 1990 by an area equal to all the cropland in France, Germany, Denmark and the Netherlands combined. And, most important, arable land pollution is posing a severe threat for the food production (Huang and Rozelle, 1995).
1.3 Environmental issues and management
For the Chinese government, the problem of environmental pollution is one of the priorities in the twelfth five-year plan, in fact, in 2013, investments were made to 951.64 billion of RMB.
In China, pollution is the basic problem among all other environmental problems such as desertification, deforestation, declining water resources, acid rain, soil erosion, air and water pollution, and biodiversity loss and more. It comes directly from domestic sewage, chemical fertilizers and pesticides, motorized boat and cars oil, human and animal wastes, industrial smokes, domestic heaters and industrial batteries. In general, the pollutants are broadly divided into seven types, including contaminated water, polluted air, solid waste, radioactive substances, noise, soil pollution and others (Zhou, 2013). The pollution of air, water and soil, combined with drought and desertification, threaten the welfare of the people influencing the agricultural and industrial production.
21 Pollution problems have become a key factor probably affecting the national security and social stability. It’s well known that many problems that have ever haunted the developed countries during industrialization have occurred in China in the last decades. Nowadays, the main environmental issues, are (MINISTRY OF ENVIROMENTAL PROTECTION, THE PEOPLE’S REPUBLIC OF CHINA, 2014): water pollution in several major rivers is serious, as well as the air quality and noise pollution, which have caused a high incidence of diseases; the carbon monoxide emissions are mounting rapidly, due to the abuse of fossil fuels, like coal, oil; both domestic and hazardous solid wastes are a new concern, directly connected to the economic development and the growth of the urban agglomerated1. soil erosion, desertification and deforestation are strongly affecting the territory. China’s overall environmental pollution is serious and mounting, which has caused negative impacts on both economic growth and public health. A recent study by Greenpeace (Greenpeace, 2014), found widespread and dangerous levels of heavy-metal contamination of rice grown near mines and factories. A Chinese government report regarding the pollution of China’s soil was recently released as a result of public pressure, having previously been classified as a state secret. It says that a fifth of China’s agricultural land is polluted. Regarding on this, during the last two winters, China is over once again in the spotlight for the air pollution level achieved in the country, particularly in the city of Beijing and Hebei area, with information considerably higher than the alarm threshold. For this, in the city of Beijing have been promoted plans for the reduction of industrial activity and the use of by government officials’ cars, as well as measures to ensure the safety of children and the elderly population, limiting exposure to external environment. As previously noted, the 12th Chinese FYP (Five-Year Plan) was the first in which the green development theme was introduced. New priorities have been included, making it completely different comparing to previous ones. Main objectives are a more quality development and a controlled growth, that has to be focused on internal consumptions. Sustainability is the key cross concept, on environmental, social, economical and political points of view. A point was made of the need to “construct a resource-conserving and environmentally friendly society”. The plan explicitly said that, faced with ever-stronger environmental and resource
22
constraints, China must increase its sense of urgency and establish concepts of green and low-carbon development. With a focus on energy-saving and emission-reduction, it must introduce incentives and disincentives to help promote resource conservation and green production and consumption. In particular, the plan is designed to rein in economic growth to some degree, make further efforts to restructure the economy, and pay prominent attention to the issues of the environment and climate change. Some of the key macroeconomic objectives that will directly impinge on the environmental agenda include (NDRC, 2011): GDP growth: An average of 7% per annum; Increased service sector growth: Value-added of service sector to increase to 47% of GDP, a 4% increase over 2010; Urbanization: Urbanization rate to reach 51.5% by 2015, an increase of 4%.170 The main objectives with direct environmental consequence include:171 Decrease SO2 and chemical oxygen demand COD by 8% by 2015;172 Commence regulating emissions of two new key pollutants (nitrogen oxide [NOx] in air and ammonia nitrogen [NH3–N] in water) and reduce emissions by 10% by 2015; Decrease energy intensity of the overall economy by 16% by 2015;
Increase non-fossil energy as a proportion of primary energy (currently 8.9%) to 11.4%;
Decrease water intensity of the overall economy by 30%; and • Increase forest coverage to 21.7% and forest stock by 600 million cubic meter (Mm3 ).
Refering to this, the following sections aims to give a brief overview of the main environmental challenges in China and initiatives of the Government aimed to the resolution of environmental issues.
1.3.1 Air pollution
2China’s air pollution is regarded as one of the worst in the world, even if the overall air
quality has been improving in the recent years. High levels of air pollution are an urgent
social and public health challenge in China. Around 1 million premature deaths today can be 2 Air pollution is an atmospheric phenomenon, mostly observed as haze, which occurs when the concentration of smoke, dust, sulfur compounds, nitrogen oxides and carbon dioxide reaches a level that is harmful to human health or the environment. (Liang, 2010) China uses an Air Quality Index (AQI) to measure air quality, and any reading above 100 is considered pollution.
23
attributed to outdoor pollution and household air pollution accounts for a further 1.2 million premature deaths. Average life expectancy in China is reduced by almost 25 months because
of poor air quality3. As a consequence of air pollution, China’s population suffers from a high
incidence of respiratory diseases (lung cancers, pulmonary heart diseases, bronchitis). A United Nations report of 2015 said that 23,000 respiratory deaths, 13,000 fatal heart disease cases and 15 million cases of bronchitis in China were to be attributed to air pollution that year (UNDP, 2015).
In China, CO2 emission increases via consumption growth have outweighed emission
reduction from energy efficiency improvements since the 1980s. Increases in emissions were mainly driven by large capital investments and increased household expenditure until the early 2000s (Lin and Polenske, 1995; Peters et al., 2007, Zhang et al., 2009, Weber et al., 2008 and Guan et al., 2009) find that exports had become a main cause of the sharp rise in emissions between 2002 and 2005 and were responsible for over half of the increment in emission. Recently, Minx et al. 2011, have found that energy efficiency improvements have largely offset the effect of increased consumption between 2002 and 2007.
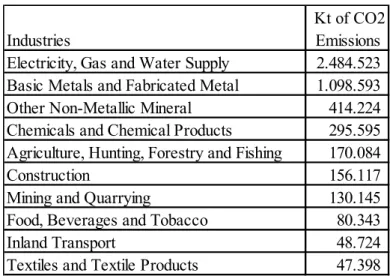
Table 1. CO2 emissions from fuel combustion by sector in 2014 Source: IEA Statistics,2015
By treating capital investments as an input to production, Minx et al. found that changes in the production structure emerged as a third major emission driver between 2002 and 2007. Structural change has mainly been the result of capital investment, which is responsible for over 60% of the emission growth between 2005 and 2007 (Zhang, 2014). China’s air quality has deteriorated rapidly since 2012 as evidenced by the surging number of haze days. There were 35.9 haze days on average in China during 2013, the highest level since 1961. In 2013, among 74 monitored cities, the number of days with very unhealthy or hazardous air quality totaled 677, making 2013 the worst year for air pollution in the past 50
3 China Medical Association
2
Country Total CO2 emissions
from fuel combustion
Electricity and heat production Other energy industry own us e Manuf. industries and construction Transport Other sectors Pe ople 's Re p. of China 9 087,0 4 384,0 364,2 2 882,0 781,4 675,4 Hong Kong, China 47,9 31,7 - 8,0 6,6 1,6 Total China 9 134,9 4 415,7 364,2 2 890,0 787,9 677,0
24
years. In 2014, out of 161 monitored cities, only 16 reached the national standards of urban air quality, with a pass rate of 10% (4% in 2013).
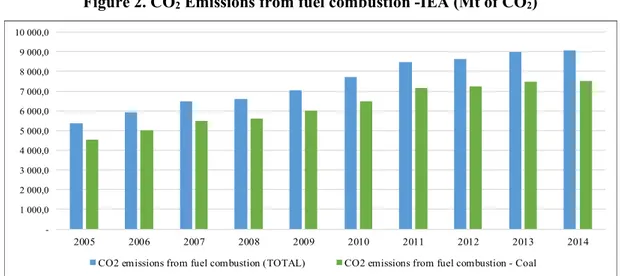
In the figure 3, there are showed two trend of last ten years of CO2 Emissions from fuel
combustion (both total and the detail from coal)
Figure 2. CO2 Emissions from fuel combustion -IEA (Mt of CO2)
Source: IEA CO2, Emissions from fuel combustion OECD/IEA, Paris 2016
http://www.iea.org/statistic China’s energy-related CO2 emissions are estimated to have increased by about 150% since 2000 –from around 3300 MtCO2 in 2000 to 8500 MtCO2 in 2013/14 from around 15% of the global total in 2000 to over 25% now (Enerdata, 2015). According to the International Energy Agency, in 2015 the China's greenhouse gas emissions reduced by 1.5%, the largest decrease in volume in comparison to that of other countries, due especially the decrease in coal as an energy source. However, a newly released (April 2015) study of air pollution sources in nine major cities showed the major sources of pollution are motor vehicles, industrial production, coal, and dust, accounting for 85%-90% of particulate matter (PM) found in the air. (Greenpeace, 2015). Motor vehicles represent the primary source of pollution in Beijing, Hangzhou, Guangzhou, and Shenzhen, while in Shijiazhuang and Nanjing it is coal, and in Tianjin, Shanghai and Ningbo the primary sources are dust, motor vehicles, and industrial production. China’s investment-driven, energy- and resources-heavy growth model means the biggest pollution sources are electricity generation and the production of industrial materials (cement, steel, chemicals, metals and other resources). Power generation, building materials (mainly cement) and steel production are the top three emitters of several key pollutants, including - 1 000,0 2 000,0 3 000,0 4 000,0 5 000,0 6 000,0 7 000,0 8 000,0 9 000,0 10 000,0 2005 2006 2007 2008 2009 2010 2011 2012 2013 2014 CO2 emissions from fuel combustion (TOTAL) CO2 emissions from fuel combustion - Coal
25
sulfur dioxide (SO2) as well as nitric oxide and nitrogen dioxide (NOx), and dust. (Smil, 1996).
The most pressing performance is a drastic increase of industrial-based SO2 emission and
soot a direct consequence of air pollution from SO2 and NOx is the occurence of acid rains,
which remain very serious events in China. Over a half of the sulfur dioxide emissions comes from electric utilities (The World Bank, 2007). Figure 3 and figure 4 shows the anlysis by Chinese regions of these main pollutant emissions in waste gas for 2015 (NBS,2016). The response of the Chinese government to the air pollution issue, has been intense and broad in scope. Alongside anticipated structural changes in the economy that lead China towards a less energy-intensive model for growth, the implementation of existing and planned air quality and energy policies in the new policies scenario leads to a significant reduction in
emissions over the period to 2040: SO2 emissions fall by almost 30% and NOX and PM2.5
by around 40%. For SO2 and PM 2.5, emissions reductions in the industry and transformation sector alone are almost as large as the total amount emitted by the entire energy sector of the United States today. Efforts to combat air pollution are complemented by policies to reduce fossil fuel use in the energy sector, supporting China’s ongoing transition towards a less energy-intensive model for economic growth. At COP21, the Chinese government pledged to increase low-carbon fuel use to 20% of the overall energy mix by 2030 (from around 10% today) and to reduce carbon intensity by 60-65% in 2030, relative to 2005. Finally, following the publication in May 2014 of the new emission standards for boilers coal, is the controls, both intensified industries within residential, doing growing demand for more efficient technologies.
The chances of achieving (or even over-achieving) these targets appear strong: for example, China is investing more in renewable energies than any other country in the world and has adopted stringent energy efficiency standards, in particular in the industry and transport sectors. According to preliminary data, coal use fell in 2015, so did energy-related carbon dioxide (CO2) emissions, despite Chinese economy is continuing its expansion.
26 Fig ure -3 Su lf u re Diox ide ( SO 2 ) Em is sions d y Regi o n (2015 ) Figure 4 - N itr o gen Ox ide s (NO X ) Em is sions by R eg ion ( 2 015 )
27
1.3.2 Water pollution
Water has gradually been one of the crucial natural resources to achieve sustainable development in the most populous country. With the rapid development of China’s economy, water shortage has become a key factor limit in sustainable development of China’s economy at present, but large amount of water has been polluted in China, so water pollution cannot be ignored. According to datat provided by the Ministry of Water Resources, water pollution is very serius in China, and the proportion of water superior to Level III increase from 80% in the 1980 to present (Lu, 2014).
Water samples are classified into one of six water quality grades depending on the concentration of the worst individual pollutant in the sample. The water quality grades defined in the Environmental Water Quality Standard GB3838-2002 are:
• Grade I: water suitable as a drinking water source (i.e., without treatment) and for national level nature reserves;
• Grade II: water suitable for use as a Class A water source for centralized drinking water supply, sanctuaries for rare species of fish, and spawning grounds for fish and crustaceans;
• Grade III: water suitable for use as a Class B water source for centralized drinking water supply, sanctuaries for common species of fish, and for swimming;
• Grade IV: water suitable for use as a general industrial water supply and for recreational use involving no direct human contact with the water; • Grade V—water only suitable for agricultural water supply and general landscaping use; and • Grade V: water unsuitable for any use.
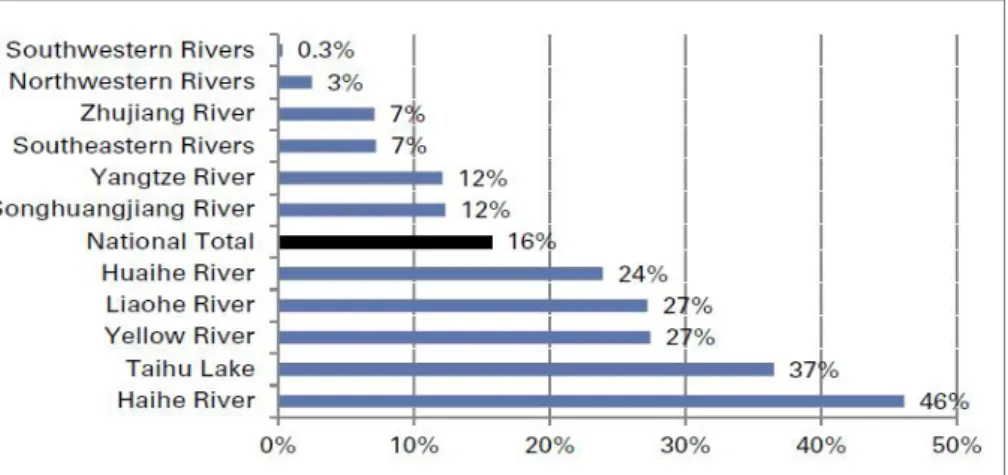
Figure 5. Chinese rivers by pollution level. % of evaluated length with worse than Grade V water
28 Water classified as grade IV-V is considered unfit for human consumption. According to the MLR, 60% of groundwater in China exceeded level IV in 2014, and, more worryingly, this figure was up five percentage points from 2013. As of 2014, 67% of the water resources in in China’s key river basins was grade I-III and 15.7% was worse than grade V with the Haihe River Basin heavily polluted and the Yellow River, Huaihe River and Liaohe River basins moderately polluted. Eutrophication of lakes and reservoirs remains a serious problem. China began its “three rivers and three lakes” pollution control scheme in 1995 but after a 20-year effort these regions continue to suffer from severe water pollution.
As s result of the rapid deterioration in China’s water quality, in recent years about half of China’s major environmental pollution-related social protests and unrest have been related to water pollution and contamination. One of this, based on official statistics from a range of government agencies, said that 85% of the length of China’s six biggest river systems consisted of water deemed undrinkable even after treatment. The proportion of groundwater that is polluted rose from 37% in 2000 to 60% in 2013. (The Economist, 2014)
Ministry of Environmental Protection (MEP), achieving the objectives set for control water pollution will require the purchase direct products and treatment services over 200 billion euro, and indirect investments for more than 71 billion. In 2014 it was operating 3,622 sewage treatment plants, for a capacity of 153 million meters’ cubes/day. However, even in 2015 over 300 cities does not have facilities. Official figures state that 70% of water wastewater is treated before being discharged the environment. However, some experts argue that in the industrial sector the most realistic percentage is around 30%.
A 2014 report of the Ministry of Protection Environmental showed that among the 4,778 stations of the active groundwater monitoring, 43.9% pointed to the water level IV (polluted but usable for industrial purposes) and 15.7% to Level V (polluted, but can be used for irrigation). The same report indicated that the quality ofgroundwater is gradually deteriorated
since 2011.The Chinese government has putted effort to tighten rules, limits and controls for
the industrial sector, with the publication of "Action Plan for the Prevention of Water "(May 2015) and issuing specific standards for certain sectors, including the tanning, textile finishing and industries that produce batteries.
Local governments should implement the Plan of Action without further elaboration and distinctions of responsibility. Among the planned actions, it highlights the goal of completing the system for collecting waste water in all towns and modernization of wastewater treatment
29
plants, improving the quality of the main river basins and the implementation of policies for the reduction of water consumption. In addition, among the objectives, shows the will to intervene in the tariff system for the use of water resources and for the assignment of waste water, giving room for the intervention of private investors.
1.3.3 Solid Waste and pollution
Controlling environmental pollution resulting from solid waste (SW) and hazardous waste (HW) has become one of the most pressing tasks in the field of environmental engineering in China. With economic development, the quantity of solid waste is increasing rapidly. China’s soil pollution has been significantly underestimated despite its much broader and more complex impacts on daily life such as the safety of groundwater and heavy metal contamination of agricultural production. More importantly, air pollution can be reduced by simply cutting toxic emissions, while reducing soil pollution requires curbs on pollution as well as a treatment process, which takes more time and demands more investment. However, there is relatively lower awareness of soil pollution among policymakers and the public. For example, the 12th Five-Year Plan only set aside US$4.8 bn to address soil pollution, which is a fraction of the US$277 bn the State Council allocated to alleviate air pollution in 2013-17. Until 2014, China had no official data on the state of contamination of soils; in that year was published a study developed by the Ministry of Environmental Protection (MEP) and Ministry of Land and Resources (MLR) on data collected between 2005 and 2013, which showed that 16.1% of Chinese land is contaminated beyond acceptable levels, while 19.4% of the arable area is severely contaminated with heavy metals. The Chinese government has determined that 90% of China's arable area is required for the maintenance food security of the country. The remaining contaminated soil, which cannot be used for food production, has been placed under the care of the Government so that measures can be taken for the functional restoration of this land.
Severe soil and water pollution have had a profound impact on China’s food supply and safety. MEP estimates that heavy metal contamination affects 12mn tons of grain in China every year, which is enough to feed 24mn people, equal to the population of Australia. In 2013, the discovery of rice tainted with cadmium in Guangdong and Hunan triggered panic buying of Thai rice.
30 According to the report What a Waste, published in 2012 by the World Bank, China produced 70% of Urban Solid Waste in South-East Asia, with more than 180 million tons per year, as some analysts has grown to over 200 million tons for 2014, and is expected to exceed 230 million tons in 2020. China's urban population produces 0.5 to 0.75 kg of municipal solid waste per day. The Urban Solid Refusal is primarily disposed of in landfills, which can be more or less operated and developed safely, while the industrial waste, according official data, is primarily reused, and only 25% would be disposed of in landfills. About a 17-18% of Urban Solid Waste is brought for incineration, of which, thanks to the Twelfth Five-Year Plan, a growing share also included an energy recovery Management and treatment of the huge amount of waste generation have enormous domestic and international implications. Inconsistent with the increasing waste production, solid waste treatment is less developed. Furthermore, China is struggling against an undercurrent of imported waste, especially the e-waste. The country, already laden with domestic pollution, is rapidly becoming the planet’s largest garbage dump, facing a huge influx of foreign garbage. An informal estimate, cited in an official environmental research report, claims that of the 80% of the world’s e-waste that pours into Asia every year, 90% is dumped in China. The mounting E-waste brings new challenges for both technological development and management in terms of Industrial Ecology (or Circular Economy).