Vol. 17, 2017, pp. 111-137 ISSN: 2340-5058
Submitted July 2017
DOI: 10.4192/1577-8517-v17_5 Accepted November 2017
Financial Reporting Practices of Italian SMEs:
Why Do They Disclose More?
Davide Panizzolo. University of Trento. Italy [email protected] Andrea Fradeani. University of Macerata. Italy [email protected]
Eldi Metushi. Canadian Institute of Technology. Albania [email protected]
Abstract. From reporting periods ending on or after 31 December 2014, Italian unlisted companies
filing their financial statements under the national GAAP have to deposit them to the Business Register in fully XBRL format. In particular, for companies submitting their financial statements in the abbreviated form, the mandatory taxonomy has offered the option to use in their notes also the tables of the standard one: this means that they can voluntarily provide more information than that normally required by the law. In this paper, we investigate this phenomenon focusing on its level and analyzing the variables explaining the reasons that push Italian SMEs to use, in their abbreviated financial statements, non-compulsory tables that are proper of the standard ones. Based on a large sample of 8,738 elements, we report surprising results: more than 80% of the abbreviated financial statements include at least one table proper of the standard ones, while on average they include seven. In addition, when analyzing the determinants of this phenomenon we find that the only relevant variable explaining the number of optional tables included in the abbreviated financial statements is the software used for preparing them.
Keywords: Digital Financial Reporting, Voluntary Disclosure, Financial Statement Notes, XBRL.
1. INTRODUCTION
From reporting periods ending on or after 31 December 2014, Italian unlisted companies have to file their financial statements under national GAAP to the Business Register in fully XBRL format (i.e. the digital language is mandatory not
only for the face statements but also for the notes). In our previous study (Fradeani et al., 2016), when investigating the impact of mandatory XBRL extension to the financial statements notes on financial reporting quality, we found that the Italian unlisted companies use extensively the customizations offered by the taxonomy. In particular, to those companies submitting their
financial statements in the abbreviated form1, the mandatory taxonomy
2014-11-17 has offered the option to use in their financial statement notes also the tables of the standard one: this means that they can voluntarily provide more information than is normally required by the law. We found that SMEs (i.e. the companies that can use the abbreviated form) tend to use not only more table customizations but also tables that are proper for the standard financial statements, thus voluntary offering a higher level of disclosure.
In this paper, we investigate this phenomenon focusing on its level and analyzing the variables explaining the reasons that push Italian SMEs to use, in their abbreviated financial statements, non-compulsory tables that are proper of the standard ones. Based on a large sample of 8,738 elements, we report surprising results: more than 80% of the abbreviated financial statements include at least one table proper of the standard financial statements, while on average they include seven. In addition, when analyzing the determinants of this phenomenon we find that the only relevant variable explaining the number of optional tables included in the abbreviated financial statements is the software used for preparing them. Interestingly, these results are partially in contrast even with the recent choice of the Italian legislator to introduce, implementing the Directive 2013/34/EU, the category of “micro-entities” for which the financial statement notes are not mandatory: our analysis shows that the small companies prefer to disclose a larger amount of information than the minimum required by the law.
1 The financial statements in the abbreviated form, offer the possibility to prepare a simplified
balance sheet in terms of number of items and also a reduced version of the notes to financial statements, while the income statement remains equivalent to that used for the standard financial statements. There are specific limits for companies submitting their financial statements in the abbreviated form, for two consecutive reporting periods two out of three of the following limits must not be exceeded: total assets of € 4,400,000, total revenues of € 8,800,000, and total number of employees of 50.
This article is organized as follows. In the next section, we make a thorough review of the literature while in section three we briefly describe the taxonomy 2014-11-17. Next, we report our findings in section four and in the last section, will follow the conclusions and some suggestions on future research.
2. LITERATURE REVIEW
XBRL represents a search-facilitating technology which improves the transparency of financial statements and allows the reuse of data, resulting in improved accessibility, interoperability and efficiency, thus limiting the time and costs of financial reporting (Hodge et al., 2004; Pinsker and Li, 2008; Vasarhelyi et al., 2012). For these benefits, XBRL as a business reporting language is being widely accepted by countries and companies for their reporting purposes (Bonsón, 2001; Kernan, 2008; Bonsón et al., 2009; Enachi and Andone, 2015). In the recent years, there has been an increasing number of studies highlighting the benefits of its adoption (Alles and Debreceny, 2012; Perdana et al., 2015). Hence, XBRL it is found to contribute to transparency and monitoring, improve the information efficiency and provide better information content (Efendi et al, 2014; Roohani and Attaran, 2014; Efendi et al., 2016). It can also facilitate the auditing activity as measured by the audit costs (Shan and Troshani, 2014) and audit report lags (Amin et al., 2017). In addition, with reference to SEC filings by small companies, Cong et al. (Cong et al., 2017) show that XBRL is the format preferred by the investors when compared to HTML, PDF, and TXT files.
XBRL it is found also to reduce information asymmetries. Thus, for a sample of Korean listed companies, Yoon et al. (Yoon et al., 2011) find a significant and negative association between XBRL adoption and information asymmetry suggesting that XBRL may reduce the information asymmetries in the capital market. Similarly, reduced information asymmetries are also reported by Liu et al., (2017) for a sample of European companies. Furthermore, XBRL adoption helps mitigate information risk and improve analysts forecast accuracy (Kim et al., 2012; Cho et al., 2014). In fact, when examining the analysts‟ responsiveness to 10-k filings in US, Cho et al. (Cho et al., 2014) find that after the XBRL adoption the responsiveness of small analysts has increased significantly compared to that of large analysts.
Research on US listed companies suggests that voluntary adopters of XBRL present different characteristics compared to non-voluntary adopters. Thus, corporate governance factors, liquidity, firm size, and better profitability are variables found to be significantly related to the XBRL voluntary adopters (Premuroso and Bhattacharya, 2008; Ragothaman, 2012; Boritz and Timoshenko, 2015). However, when analyzing the characteristics of the XBRL voluntary adopters, Callaghan and Nehmer (Callaghan and Nehmer, 2009) suggest that these are larger and visible companies seeking to improve their corporate governance appearance.
As for the XBRL taxonomy, there has been an extensive research analyzing its issues and benefits. Thus, scholars have stressed the need of third-party assurance on XBRL tagging process (Plumlee and Plumlee, 2008; Srivastava and Kogan, 2010). In fact, (Boritz and No, 2008), when analyzing the XBRL filings under the SEC‟s XBRL Voluntary Filing Program on EDGAR, find increasing quality control and assurance issues pertaining to the XBRL filings. In addition, filing errors could also negatively affect the quality of the information provided (Bartley et al., 2010). However, as time passes the filing errors of the companies decrease, suggesting a learning curve exhibited by the XBRL filers (Du et al., 2013). Issues and benefits of the XBRL taxonomy have been also widely analyzed in the Italian setting (Valentinetti and Rea, 2011; Valentinetti and Rea, 2012; Fradeani et al., 2017).
In this study, we focus on the financial statements‟ notes in XBRL to investigate the level of voluntary disclosure of the Italian SMEs. These represent almost all the Italian2 companies and are characterized by a weak corporate governance, related to a concentrated ownership and family controlled (Corbetta and Montemerlo, 1999; Melis, 2000; Brunello et al., 2003; Santarelli and Lotti, 2005; Di Pietra et al., 2008), which obviously impacts the financial statements‟ quality and disclosure level (Cascino et al., 2010; Antonelli et al., 2016; Torchia and Calabrò, 2016). We focus on the tables of the financial statement notes used by
2
According to ISTAT (the Italian National Institute of Statistics), 99% of Italian companies in 2015 had fewer than 50 employees. With reference to the companies for which is mandatory to deposit their financial statements in the Italian Business Register, just over 91% has filed the financial statements of 2015 in the abbreviated form and thus falling within the size limits shown in note 1.
the filers of the abbreviated financial statements, which are proper of the standard financial statements. It is important to mention that issues and benefits related to the notes of financial statements in XBRL have been widely analyzed in US studies (Debreceny et al., 2005; Debreceny et al., 2011; Janvrin and No, 2012; Arnold et al., 2012).
In Italy, studies on notes to financial statements are very recent, mainly after the mandatory requirement of the XBRL extension to the financial statements notes (Avallone et al., 2016; Fradeani et al., 2016). As with regard to the voluntary disclosure, several benefits push companies towards the voluntary disclosure of financial and non-financial information. In fact, voluntary disclosure helps mitigate the information asymmetries and thus reduce the investor‟s uncertainties and firm‟s cost of capital (Diamond and Verrecchia, 1991). In addition, the market responds positively to voluntary disclosure and firms‟ performance is positively related to voluntary disclosure (Lang and Lundholm, 1993; Miller, 2002). For financial statements in XBRL, Kaya (2014) when analyzing the extent of voluntary disclosure of the XBRL users finds that firm size and its level of innovativeness are significantly related to the overall XBRL disclosure.
Our study adds to the very few studies focusing on the XBRL extension to the financial statement notes. We provide field-based evidence on the disclosure practices of the Italian SMEs and analyze the variables that could explain why they use in their abbreviated financial statements tables that are proper of the standard financial statements. To the best of our knowledge, this represents the first study analyzing the disclosure practices of Italian SMEs from this perspective.
3. TAXONOMY CHARACTERISTICS
The taxonomy 2014-11-17 concerns the XBRL encoding of the financial statements of unlisted companies prepared in accordance with the Italian national GAAP and deposited in the Italian Business Register, for reporting periods ending on or after 31 December 2014; it is based on two basic assumptions:
1. the taxonomy is designed by XBRL Italy to comply only with the information that is explicitly required by the Italian Civil Code and, with
reference to the financial statement notes, with the disclosure explicitly required by the articles 2427 and 2427-bis;
2. contrary to the legal requirements in other countries, the new taxonomy is not extensible by the reporting entity. This implies, on one side, a strong standardization useful for improving the comparability of financial statements but, on the other side, it could undermine the information quality of the financial statements3.
The taxonomy codifies the balance sheet, the income statement and the notes to financial statements. While the first two prospects do not allow any margin of customization because of the impossibility to add extensions, the notes to financial statements allow certain flexibility. However, before addressing this aspect, it is necessary to clarify the characteristics of the taxonomy related to the notes to financial statements: the information disclosed in the notes must be inserted in a specific structure consisting of five sections (Introduction, Assets, Liabilities, Income Statement, Other Information and Final Part), each made of numerous textual fields (there are more than 100, and each accepts up to 32 Kbytes) and default tables (there are 53, designed to comply with the legal requirements).
In relation to the margin of flexibility in filing the notes to financial statements, this is achieved by using not the extensions but the textual fields “intelligently”: their content is completely free, allowing the filer to disclose as much information as needed, as an integration, comment or substitute of the default tables (which when deemed unsuitable, may not be used); however, the textual fields may also include xHTML coding that allows to view the customized tables used by the filers, to integrate, add or substitute the default tables.
Finally, to conclude we briefly address the differences that characterize the part of taxonomy for the financial statements in the abbreviated form. The taxonomy for the abbreviated financial statements is derived from that of the standard financial statements, and thus shows all the features already illustrated previously with the
3 For further details on taxonomy 2014-11-17, also with reference to its impact on the quality of
economic and financial information of Italian unlisted companies, please refer to our previous study (Fradeani et al., 2016).
exception of the simplifications provided by the art. 2435-bis of the Italian Civil Code. Thus, the taxonomy for the abbreviated financial statements comprises: a simplified balance sheet; an income statement that, excluding some marginal differences, is the same to the standard one; the notes that offer the same structure mentioned before but with a lower number of default tables, because of the simplifications provided by law. In addition, when the filer needs to provide further information beyond that required by the law may use also one or more of the 53 tables designed for the standard financial statements (Fradeani et al., 2016). Thus, the preparer can choose which tables of the standard and abbreviated financial statements to use based on his disclosure needs. This faculty, on one side follows the best practices adopted by the professionals, and on the other side provides more flexibility to the filers by offering them an additional possibility of customization: they can actually use the tables proper of the standard financial statements for disclosing additional information in the abbreviated form.
4. METHODOLOGY
To investigate the level of voluntary disclosure for the companies filing the financial statements in the abbreviated form, we randomly selected 10,000 financial statements deposited in the Business Register for the reporting periods ending on 31 December 2014. From that sample, we extracted only the financial statements submitted in the abbreviated form, thus reaching a final amount of 8,738 valid XBRL instances. In order to understand the sample characteristics, we report in the tables below descriptive statistics related to the variables representing the size of the companies (Revenues and Total Assets). We also show their distribution based on other parameters such as ownership and legal form.
Revenues Total Assets
Minimum - - 1st Quarter € 27,980 € 158,500 Median € 201,700 € 519,500 Mean € 859,500 € 1,801,000 3rd Quarter € 847,000 € 1,584,000 Maximum € 46,930,000 € 166,000,000
Table 1 reports descriptive statistics on company revenues. On average, the revenues amount to € 859,500. However, a much lower median suggests that the distribution is concentrated on low values (50% of the sample has revenues under € 200,000) and that there are few outliers with very high values affecting the mean. The same applies to the total assets: as shown in the second column of Table 1, on average total assets amount to € 1,801,000. However, as in the case of revenues, this is due to a few outliers with high values. In fact, it could be easily observed that 50% of the companies have total assets lower than € 520,000, suggesting that the distribution is concentrated on low values. Given the characteristics of the sample, it is not surprising to observe that there are only 138 joint stock companies. In addition, it is interesting to note that the number of companies with a sole shareholder is 1,289.
In order to complete our exploratory analysis of the sample, we also consider the software used for preparing the financial statements in XBRL4. In our selected sample, we find 25 different software used that cover 94.9% of the total sample (the remaining 5.1% of the financial statements do not report any information on the software used for filing the financial statements in XBRL). When analyzing the distribution of our sample in relation to the software used for filing the financial statements in XBRL, we observe a fairly clear concentration of the distribution of the financial statements of our sample towards six-main software (we will also call these software “principal”). In fact, our analysis shows that they cover 85% of the sample of financial statements in XBRL, while the remaining 15% of financial statements in part are related to the previously mentioned 5.1% that do not report any information on the software used, and the rest, 9.9%, are prepared using the other 19 minor software.
As mentioned previously, our focus is on analyzing the level of disclosure offered by the companies of the selected sample. Considering the fact that this sample is mainly composed of very small companies we expect the level of disclosure to be minimal. To measure this level, we consider two quantitative variables that can be collected using an automated procedure from the financial statements in XBRL:
4
A special tag including software vendor details may be provided in XBRL instances, so it was possible to associate the XBRL instance with the software used to produce it.
1. the total number of tables used by the filers when filing the notes to financial statements (we name this variable tot);
2. the number of tables proper of the standard financial statements used in the abbreviated financial statements (we name this variable ese).
The first variable provides an overall measure of the amount of information the filer has entered, while the second one is more related to the voluntary disclosure: these tables are not required by law but are voluntarily inserted by the filer who chooses to provide additional information.
We further investigate some of the determinants that could explain the optional tables used and thus the level of voluntary disclosure of the companies of the sample. For this reason, we consider the distribution of the variable ese in relation to the size of the company and company‟s legal form, and also in relation to the different software used for filing the financial statements. Previous studies have documented a positive relationship between firms‟ size and the extent of voluntary disclosure (Premuroso and Bhattacharya, 2008; Ragothaman, 2012; Kaya, 2014). In general, larger firms have more incentives to voluntary disclose financial and non-financial information because they may bear the costs of collecting and disclosing the data but also because they are more exposed to investors compared to smaller firms (Kaya, 2014). In addition, larger firms may have adopted technologies that improve the extent of voluntary disclosure earlier than smaller firms (Ragothaman, 2012).
With regard to the company‟s legal forms, we consider it as a proxy for the ownership of the companies. The literature suggests that ownership structure may affect the voluntary disclosure of companies and widely held companies tend to disclose more information than closely held companies (Chau and Gray, 2002; Eng and Mak, 2003; Boritz and Timoshenko, 2015). Thus, we expect different disclosure practices for companies of different legal forms. Finally, we think that the software used for filing the financial statements in XBRL may also affect the extent of voluntary disclosure of companies. In this regard, we expect that more user-friendly software may make it easier for filers to file additional information than that required by law and thus increase the level of voluntary disclosure.
To conclude, we examine the link between the variables ese and the software used for filing the financial statements in XBRL. The reason behind this choice is related to our findings. In fact, as we will show later in the results section, we find that the software is the only variable explaining the extent of voluntary disclosure of the companies of our sample. Considering that software is a qualitative variable
and ese a discrete variable, we use Pearson‟s Chi-square (2) test to analyze this
relationship and compute the Cramer‟s V index to verify the degree of association between these variables. Our hypotheses are as follows:
1. the presence of optional tables depends on the software used;
2. the number of optional tables, when higher than zero, depends on the software used;
3. the total number of optional tables depends on the software used. 5. RESULTS
We begin this section by showing the results of our descriptive statistics on the variables tot and ese and then will follow the results of the analysis on the determinants of voluntary disclosure.
5.1 Descriptive statistics
Table 2 shows descriptive statistics on the distribution of the total number of tables used in the financial statement notes for our sample: it is interesting to point out that, contrary to our expectations, the average number of tables used in the notes to financial statements is 11, with a maximum of 54. The percentage of
financial statements with zero tables used is 3.6%5, whereas the first quartile is 8
suggesting that the distribution of the number of tables is significantly distant from zero. Additionally, considering the fact that the median is close to the mean, we can conclude that the distribution is symmetric around the mean.
5
These financial statements represent cases when companies have not completed the notes to the financial statements, alternatively choosing the double filing option [for a detailed analysis see our previous study (Fradeani et al., 2016)], or when the disclosure is provided only in the textual fields of the notes: however, this percentage is very low, indicating that almost all the companies use the tables provided by the taxonomy for filing their financial statements.
tot ese Minimum 0 0 1st Quarter 8 3 Median 11 7 Mean 11 7 3rd Quarter 15 10 Maximum 54 37
Table 2. Descriptive statistics for the variable tot and ese
To better understand these results, we analyze the tables with the highest filing
percentage6. As we can observe, the tables with a usage frequency of more than
80% are those related to shareholders‟ equity, followed by the tables of changes of receivables and of changes in other assets with a usage frequency of more than 70%, and of changes in staff severance fund with a usage frequency around 50%. It is interesting to note that the tables typical of the abbreviated financial statements show a very polarized distribution: on one side they occupy four out of the first five positions of the table, while on the other side (with the exception of the table on changes in other liabilities, which is used in about 42% of the financial statements) they are almost all in the final part of the table, with usage rates of just over 20%.
We also note that the third table with the highest usage frequency is that of changes and due date of receivables included among current assets, which is an optional table with a very high filing rate. It should also be highlighted the balance between the number of tables used for assets and liabilities, even though those related to liabilities are on average filed with a higher frequency. In addition, we observe an almost total absence of tables for the profit and loss account and those of other information (there are only two tables on details on net revenue, however with relatively low filing percentages): it is probably due to a limited number of tables provided by the taxonomy for these sections and, as noted in our previous study (Fradeani et al., 2016), to the non-perfect design of some taxonomy tables, with particular reference to those of deferrals in the section of profit and loss account.
6
Names, sections, and absolute and relative frequency of tables with a usage frequency of more than 20% are listed in Annex 1.
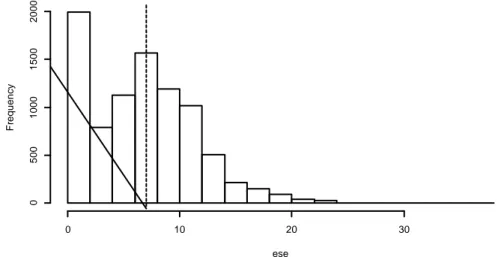
We observe surprising results when analyzing the second variable, that is the number of tables proper of the standard financial statements used in the abbreviated financial statements (ese): on average in an abbreviated financial statements, we find 7 tables proper of the standard ones. In detail, as we can observe in Table 2, the range goes from a minimum of zero to a maximum of 37 tables, with 50% of the sample using at least 7. To better clarify this distribution, in Figure 1 we show the histogram of the frequencies (the dotted line indicates the mean and the median).
Considering the fact that these are optional tables, we expect their concentration to be around zero. However, it is important to note that the number of financial statements of the entire sample without any optional table is less than 17%; thus, more than 83% of the financial statements present at least one optional table, showing a clear sign that the filers have widely used their faculty to adopt optional tables for their filing purposes. Again, as it was the case for the variable tot, it is interesting to see which are the optional tables that users have used most frequently for their filing purposes7.
Fig. 1. Distribution of the optional tables
As noted previously, the table of analysis of changes and due date of receivables was used in more than 72% of the cases, followed by the analysis of payables
7 Names, sections, and the absolute and relative frequency of tables proper of the standard
financial statements with a usage frequency of more than 20% are listed in Annex 2 (a subset of those shown in Annex 1).
Distribution of ese ese F re q u e n cy 0 10 20 30 0 500 1000 1500 2000
changes and due date, the analysis of changes in liquid funds, the detail of other reserves and the analysis of changes in inventories. In this case, there is a majority of asset tables both in terms of number and frequency of usage. It is of interest to point out the distribution of the filing frequency of these tables: there are 13 tables with a filing rate above 28% implying that the tables filed in the financial statements differ from each other. In fact, considering that on average for the abbreviated financial statements there are 7 tables proper of the standard financial statements, the fact that the usage frequency of individual tables is concentrated between 28% and 45%, means that different filers have filed different tables. While this may seem too obvious, considering the fact that filers have the faculty to choose which tables to file according to their specific disclosure purposes, on the other side, one could expect a more standardized information, hence that the tables proposed by the various filing software had been used in bulk since somehow “forced” by the software. This dispersion shows that in our sample seems to happen the opposite: the users file many optional tables by “freely” choosing which one to use.
5.2 Determinants of voluntary disclosure
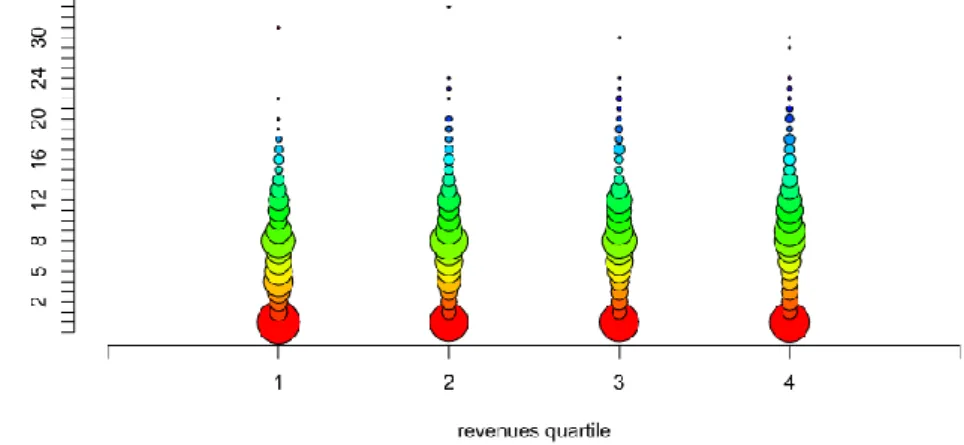
To further investigate the voluntary disclosure, we analyzed the determinants that could explain this phenomenon. Starting from the list of variables previously discussed, we have analyzed the distribution of the variable ese in relation to each variable of the list using a graphical approach. In Figure 2, we show the distribution of the variable ese in relation to revenues.
First, we divided the sample into 4 revenues quartiles (shown in the figure with numbers 1 to 4, where 1 is the Q1 and so on) to obtain four different sets of
companies with the same numerosity. For each set, we plotted a bubble diagram representing the distribution of the variable ese for each quartile. It could be easily observed that the distributions do not seem different for the different quartiles and thus we may assume that the distribution of the number of optional tables does not depend on revenues. We obtain similar results (which are not reported here) when using the total assets as well as the legal form or the presence of a single shareholder; all these variables do not seem to influence the overall distribution of the variable ese. Nevertheless, the same cannot be said for the software used for filing the financial statements in XBRL. Similar to the previous analysis, we proceed with a graphical analysis to observe the distribution of the variable ese in relation to the software used. We limited our analysis only to the principal software8, given the high concentration of our sample around this group and the large number of total software used in our overall sample.
Fig. 3. Distribution of ese in relation to the software used
When we observe the bubble diagram in Figure 3, it is evident the influence of the software used on the distribution of variable ese under two different points of view: the dominant presence of zeros (given by the size of the bubbles placed in the lower row of the graph) and the distribution with values other than zeros. A
8
Recall that a principal software is one of the six software mostly used (85% of our selected sample) to file the financial statements in XBRL.
concentration around zero refers to the frequency that the financial statements produced with a given software have not made use of optional tables. As we may observe, the software a, b and c present different behaviors compared to the other 3 software: among their users, there is a considerable number of those not using the optional tables. In our opinion, this clearly shows that the user‟s interface of this group of software has somehow driven them to file only the mandatory tables. In contrast, the users of software d, e and f have usually preferred to include more optional tables; even in this case, we assume that the software used has made it easier for the filers to provide non-compulsory information.
The same can be said even when we neglect the concentration in zero for the variable ese. We still observe that the software used has affected the distribution of the number of optional tables used, in the cases when the filer has chosen to file at least one optional table. In Figure 3, it is clear how the software b and c have influenced the users to not use optional tables or to use them in a limited number compared to the other software; vice versa, for the users of the other software, when they have decided to use optional tables, usually they have used a considerable number, with different distributions
Hypothesis Variable Description
Chi-square
Cramer’s V Value p-value
1 zero_ese Boolean.
TRUE if ese=0, FALSE if ese>0 2.590 <2.2e-16 61%
2 ese*
Numerical.
From 1 to 14 corresponds to ese, all values of ese higher than 14 were grouped into a single residual value.
3.747 <2.2e-16 36%
3 ese**
Numerical.
From 0 to 14 corresponds to ese, all values of ese higher than 14 were grouped into a single residual value.
5.541 <2.2e-16 40% Table 3. Pearson‟s Chi-square test and Cramer‟s V index
To give a quantitative measure of the relationship between the level of voluntary disclosure and software used, we conduct a bivariate test. Our results reported above in Table 3 show that all the three hypotheses stated before are statistically significant. However, the degree of association between the variables (as measured by Cramer‟s V) for the three hypotheses is different; in the first case, the association is very strong (over 60%), while for the second and the third case
this association is moderate even though still quite relevant (36% and 40%). In other words, there is a very strong association between the presence of optional tables and the type of software used (hypothesis 1), while there is a moderate association between the number of optional tables present and the type of software (hypothesis 2). When considered together these two aspects lead to an overall Cramer‟s V index of 40% (hypothesis 3), which means that the type of software alone explains 40% of the variability in the number of optional tables. From this discussion, it follows that the software used influences the choice of the financial statement filers to disclose additional non-mandatory information.
We further investigate whether the software choice depends on other variables, such as size: if so, the only software variable would not be sufficient to explain the distribution of the variable ese. In fact, it would also depend on these other factors.
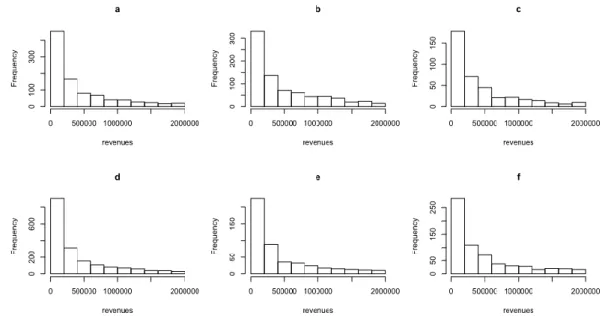
Fig. 4. Distribution of revenues for the major software programs
Figure 4 shows the distribution of the companies of the sample by the revenues range for the six-main software. We could easily observe that there is a substantial homogeneity in the different groups, suggesting that the size variable (measured in terms of revenues) does not determine the choice of the software. In fact, since the histograms seem to be substantially overlapping it does not seem to exist a
relationship between the software and company size, leading us to conclude that the only variable that explains the level of voluntary disclosure is the software used.
These results, drive us to conclude that the software, on one side, has led to the use of more or less optional tables, but on the other side, did not smooth the level of the information disclosed in the financial statements: each user has had the possibility to choose the most significant tables for his disclosure purposes, and he has been favored by the software for entering the information as structured data in the XBRL instance.
6. CONCLUSIONS AND FUTURE RESEARCH DIRECTIONS
With the taxonomy 2014-11-7, Italian unlisted companies have to file their financial statements under national GAAP to the Business Register in fully XBRL format: this means that also the notes should be codified in the mark-up language. In line with the new requirements, for companies submitting their financial statements in the abbreviated form, the Italian jurisdiction has offered the option to use in their notes also tables which are proper of the standard financial statements. Thus, these companies have the faculty to increase the amount of information disclosed by using also tables proper of the standard financial statements. In this paper, choosing a sample of 8,738 abbreviated financial statements deposited in the Business Register during 2015, we investigate this phenomenon by focusing on its level and by analyzing the variables that could explain the reasons that push Italian SMEs to use in their financial statements non-compulsory tables that are proper of the standard financial statements. Doing so, we find some interesting results.
When analyzing the sample characteristics in terms of size, we observe a concentration on low values for the revenues and total assets. In line with this, we find that only 138 of the companies of the sample are joint stock companies, whereas it is interesting to point out that the number of companies with a sole shareholder is 1,289. As with regard to the software used to file the financial statements in XBRL, we find in total 25 different software used. However, we observe a high concentration of the sample towards the six-principal software that cover around 85% of the sample.
We further investigate the total number of tables used by the filers when filing the notes to the abbreviated financial statements (tot), and the number of tables proper of the standard financial statements used by the filers of the abbreviated financial statements (ese). When investigating the tot variable, we find that, on average, the filers have used 11 tables and interestingly, the percentage of financial statements with zero tables used is only 3.6%. The tables mostly used by the filers are those related to shareholders‟ equity and the tables of changes of receivables and of changes in other assets. In addition, when analyzing the distribution of the variable ese we find that, on average, in an abbreviated financial statement there are 7 tables proper of the standard financial statements. The percentage of financial statements with at least one optional table used is more than 83% of the financial statements, a clear sign that the filers have widely used the faculty to adopt these tables for their disclosure purposes. Furthermore, we focus our attention on the reasons explaining the number of optional tables included in the abbreviated financial statements. We find that the variable explaining this faculty is the software used for preparing the financial statements. In fact, when analyzing whether the company revenues could explain the choice of software used we do not find any link, suggesting that the software is the only variable explaining the number of optional tables used.
Our results are important for researchers, standard setters, and software developers. This study adds to the previous literature focusing the attention on the notes to financial statements in XBRL. To the best of our knowledge, the literature analyzing the XBRL extension to the financial statements notes is still weak, especially for firm-level analysis and for non-listed companies. For the standard setters, our results show a non-perfect design of some taxonomy tables, as suggested by the fact that specific tables of the financial statements present a frequency of usage around zero. In addition, as previously mentioned, we showed that Italian SMEs based on the type of software used will tend to disclose more or less additional non-mandatory information. Furthermore, recently the Italian legislator introduced the category of “micro-entities” for which the financial statement notes are not mandatory. However, we show that our results are partially in contrast with the new requirement, in that small companies tend to disclose more information beyond that required by law. Thus, we suggest further
investigation from the standard setters in relation to their disclosure practices. As a conclusion, this study shows that the level of additional information disclosed in the financial statements of Italian SMEs depends exclusively on the software used to file these financial statements. In this regard, the software developers could consider our findings when designing the users interfaces to create the XBRL file. Further research directions should focus on investigating the reasons of SMEs voluntary disclosure by considering other variables not analyzed here. In addition, the size of our sample suggests that a multivariate analysis can be performed to test the combined effect of the various dependent variables considered. Moreover, it is of interest to see also what type of information disclose who voluntarily use tables proper of the standard financial statements for the abbreviated ones.
7. REFERENCES
Alles, M., & Debreceny, R. (2012). The evolution and future of XBRL research. International Journal of Accounting Information Systems, 13(2), 83–90. doi.org/10.1016/j.accinf.2012.03.006
Amin, K., Eshleman, J. D., & Feng, C. (2017). The Effect of the SEC's XBRL Mandate on Audit Report Lags. Accounting Horizons, In-Press.
Antonelli, V., D‟Alessio, R., & Cuomo, F. (2016). Beyond Stakeholders Theory: Financial reporting and voluntary disclosure in Italian SME according to a System dynamics point of view. Economia Aziendale Online, 7(4), 285–304.
Arnold, V., Bedard, J. C., Phillips, J. R., & Sutton, S. G. (2012). The impact of tagging qualitative financial information on investor decision making: Implications for XBRL. International Journal of Accounting Information Systems, 13(1), 2–20. doi.org/10.1016/j.accinf.2011.12.002
Avallone, F., Ramassa, P., & Roncagliolo, E. (2016). XBRL Extension to the Financial Statement Notes: Field-based Evidence on Unlisted Companies. The
International Journal of Digital Accounting Research, 16, 61–84.
doi.org/10.4192/1577-8517-v16_3
Bartley, J., Al-Chen, Y. S., & Taylor, E. (2010). Avoiding Common Errors of XBRL Implementation. Journal of Accountancy, 209(2) 46–51.
Bonsón, E. (2001). The Role of XBRL in Europe. The International Journal of Digital Accounting Research, 1(2), 101–110. doi.org/10.4192/1577-8517-v1_5 Bonsón, E., Cortijo, V., & Escobar, T. (2009). Towards the global adoption of XBRL using international financial reporting standards (IFRS). International
Journal of Accounting Information Systems, 10(1), 46–60.
doi.org/10.1016/j.accinf.2008.10.002
Boritz, J. E., & No, W. G. (2008). The SEC‟s XBRL Voluntary Filing Program on EDGAR: A Case for Quality Assurance. Current Issues in Auditing, 2(2), A36– A50. doi.org/10.2308/ciia.2008.2.2.a36
Boritz, J. E., & Timoshenko, L. M. (2015). Firm-Specific Characteristics of the Participants in the SEC‟s XBRL Voluntary Filing Program. Journal of
Information Systems, 29(1), 9–36. doi.org/10.2308/isys-50896
Brunello, G., Graziano, C., & Parigi, B. M. (2003). CEO turnover in insider-dominated boards: The Italian case. Journal of Banking & Finance, 27(6), 1027– 1051. doi.org/10.1016/s0378-4266(02)00244-3
Callaghan, J., & Nehmer, R. (2009). Financial and governance characteristics of voluntary XBRL adopters in the United States. International Journal of Disclosure and Governance, 6(4), 321–335. doi.org/10.1057/jdg.2009.15
Cascino, S., Pugliese, A., Mussolino, D., & Sansone, C. (2010). The influence of family ownership on the quality of accounting information. Family Business Review, 23(3), 246–265. doi.org/10.1177/0894486510374302
Chau, G. K., & Gray, S. J. (2002). Ownership structure and corporate voluntary disclosure in Hong Kong and Singapore. The International Journal of Accounting, 37(2), 247–265. doi.org/10.1016/s0020-7063(02)00153-x
Cho, Y. J., Bhattacharya, S., & Kim, J. B. (2014). XBRL Mandate and Access to Information: Evidence from Reactions of Financial Analysts and Institutional Investors, Available at http://ink.library.smu.edu.sg/soa_research/1280, last accessed 2017/11/20.
Cong, Y., Du, H., & Vasarhelyi, M. A. (2017). Are XBRL Files Being Accessed? Evidence from the SEC EDGAR Log File Data Set. Journal of Information Systems, In-Press.
Corbetta, G., & Montemerlo, D. (1999). Ownership, Governance, and Management Issues in Small and Medium‐Size Family Businesses: A Comparison of Italy and the United States. Family Business Review, 12(4), 361–374. doi.org/10.1111/j.1741-6248.1999.00361.x
Debreceny, R. S., Chandra, A., Cheh, J. J., Guithues‐Amrhein, D., Hannon, N. J., Hutchison, P. D., Janvrin, D., Jones, R. A., Lamberton, B., Lymer, A., Mascha, M., Nehmer, R., Roohani, S., Srivastava, R. P., Trabelsi, S., Tribunella, T., Trites, G., & Vasarhelyi, M. A. (2005). Financial Reporting in XBRL on the SEC‟s EDGAR System: A Critique and Evaluation. Journal of Information Systems, 19(2), 191–210. doi.org/10.2308/jis.2005.19.2.191
Debreceny, R. S., Farewell, S. M., Piechocki, M., Felden, C., Gräning, A., & d‟Eri, A. (2011). Flex or break? Extensions in XBRL disclosures to the SEC. Accounting Horizons, 25(4), 631–657. doi.org/10.2308/acch-50068
Di Pietra, R., Grambovas, C. A., Raonic, I., & Riccaboni, A. (2008). The effects of board size and „busy‟ directors on the market value of Italian companies. Journal of Management & Governance, 12(1), 73–91. doi.org/10.1007/s10997-008-9044-y
Diamond, D. W., & Verrecchia, R. E. (1991). Disclosure, Liquidity, and the Cost of Capital. The Journal of Finance, 46(4), 1325–1359. doi.org/10.2307/2328861 Du, H., Vasarhelyi, M. A., & Zheng, X. (2013). XBRL Mandate: Thousands of Filing Errors and So What? Journal of Information Systems, 27(1), 61–78. doi.org/10.2308/isys-50399
Efendi, J., Park, J. D., & Smith, L. M. (2014). Do XBRL filings enhance informational efficiency? Early evidence from post-earnings announcement drift.
Journal of Business Research, 67(6), 1099–1105. doi.org/10.1016/
j.jbusres.2013.05.051
Efendi, J., Park, J. D., & Subramaniam, C. (2016). Does the XBRL reporting format provide incremental information value? A study using XBRL disclosures
during the voluntary filing program. Abacus, 52(2), 259–285.
doi.org/10.1111/abac.12079
Enachi, M., & Andone, I. I. (2015). The Progress of XBRL in Europe – Projects, Users and Prospects. Procedia Economics and Finance, 20, 185–192. doi.org/10.1016/s2212-5671(15)00064-7
Eng, L. L., & Mak, Y. T. (2003). Corporate governance and voluntary disclosure. Journal of Accounting and Public Policy, 22(4), 325–345. doi.org/10.1016/s0278-4254(03)00037-1
Fradeani, A., Panizzolo, D., & Metushi, E. (2016). Financial Reporting in XBRL: First Evidence on Financial Statement Notes of Italian Unlisted Companies. The International Journal of Digital Accounting Research, 16, 85–115.
Mandatory IFRS Financial Disclosures in a Voluntary Format: Evidence from the Italian XBRL Project, in Corsi, K., Castellano, N. G., Lamboglia, R., & Mancini, D. (Eds.), Reshaping Accounting and Management Control Systems. New Opportunities from Business Information Systems, Springer, Cham.
Hodge, F. D., Kennedy, J. J., & Maines, L. A. (2004). Does search facilitating technology Improve the Transparency of Financial Reporting ? The Accounting Review, 79(3), 687–703. doi.org/10.2308/accr.2004.79.3.687
Janvrin, D. J., & No, W. G. (2012). XBRL Implementation: A Field Investigation to Identify Research Opportunities. Journal of Information Systems, 26(1), 169– 197. doi.org/10.2308/isys-10252
Kaya, D. (2014). The influence of firm-specific characteristics on the extent of voluntary disclosure in XBRL: Empirical analysis of SEC filings. International
Journal of Accounting and Information Management, 22(1), 2–17.
doi.org/10.1108/ijaim-05-2011-0007
Kernan, K. (2008). XBRL around the world. Journal of Accountancy, 206(4), 62– 66.
Kim, J. W., Lim, J. H., & No, W. G. (2012). The Effect of First Wave Mandatory XBRL Reporting across the Financial Information Environment. Journal of Information Systems, 26(1), 127–153. doi.org/10.2308/isys-10260
Lang, M., & Lundholm, R. (1993). Cross-Sectional Determinants of Analyst Ratings of Corporate Disclosures. Journal of Accounting Research, 31(2), 246– 271. doi.org/10.2307/2491273
Liu, C., Luo, X. R., & Wang, F. L. (2017). An empirical investigation on the impact of XBRL adoption on information asymmetry: Evidence from Europe. Decision Support Systems, 93, 42–50. doi.org/10.1016/j.dss.2016.09.004
Melis, A. (2000). Corporate governance in Italy. Corporate Governance: an international review, 8(4), 347–355. doi.org/10.1111/1467-8683.00213
Miller, G. S. (2002). Earnings Performance and Discretionary Disclosure. Journal of Accounting Research, 40(1), 173–204. doi.org/10.1111/1475-679x.00043 Perdana, A., Robb, A., & Rohde, F. (2015). An Integrative Review and Synthesis
of XBRL Research in Academic Journals. Journal of Information Systems, 29(1), 115–153. doi.org/10.2308/isys-50884
Pinsker, R., & Li, S. (2008). Costs and benefits of XBRL adoption. Communications of the ACM, 51(3), 47–50. doi.org/10.1145/1325555.1325565 Plumlee, R. D., & Plumlee, M. A. (2008). Assurance on XBRL for Financial Reporting. Accounting Horizons, 22(3), 353–368. doi.org/10.2308/acch.2008. 22.3.353
Premuroso, R. F., & Bhattacharya, S. (2008). Do early and voluntary filers of financial information in XBRL format signal superior corporate governance and operating performance? International Journal of Accounting Information Systems, 9(1), 1–20. doi.org/10.1016/j.accinf.2008.01.002
Ragothaman, S. (2012). Voluntary XBRL adopters and firm characteristics: An empirical analysis. International Journal of Digital Accounting Research, 12, 93– 119. doi.org/10.4192/1577-8517-v12_4
Roohani, S., & Attaran, S. (2014). Social media: New challenges and opportunities for corporate governance. International Journal of Disclosure & Governance, 1(6), 251–259. doi.org/10.1057/jdg.2013.30
Santarelli, E., & Lotti, F. (2005). The survival of family firms: The importance of control and family ties. International Journal of the Economics of Business, 12(2), 183–192. doi.org/10.1080/13571510500127246
Shan, Y. G., & Troshani, I. (2014). Does Xbrl Benefit Financial Statement Auditing? Journal of Computer Information Systems, 54(4), 11–21. doi.org/10.1080/08874417.2014.11645718
Srivastava, R. P., & Kogan, A. (2010). Assurance on XBRL Instance Document: A Conceptual Framework of Assertions. International Journal of Accounting Information Systems, 11(3), 261–273.
Torchia, M., & Calabrò, A. (2016). Board of directors and financial transparency and disclosure. Evidence from Italy. Corporate Governance, 16(3), 593–608. doi.org/10.1108/cg-01-2016-0019
Valentinetti, D., & Rea, M. A. (2011). Adopting Xbrl in Italy: Early evidence of fit between Italian GAAP taxonomy and current reporting practices of non-listed companies. The International Journal of Digital Accounting Research, 11, 45–67. doi.org/10.4192/1577-8517-v11_3
Valentinetti, D., & Rea, M. A. (2012). IFRS Taxonomy and financial reporting practices: The case of Italian listed companies. International Journal of Accounting Information Systems, 13(2), 163–180. doi.org/10.1016/j.accinf. 2011.09.001
Vasarhelyi, M. A., Chan, D. Y., & Krahel, J. P. (2012). Consequences of XBRL Standardization on Financial Statement Data. Journal of Information Systems, 26(1), 155–167. doi.org/10.2308/isys-10258
Yoon, H., Zo, H., & Ciganek, A. (2011). Does XBRL adoption reduce information asymmetry? Journal of Business Research, 64(2), 157–163. doi.org/10.1016/j.jbusres.2010.01.008
Annex 1
List of tables with maximum frequency of usage
Id Section Name No. %
T0283 Liabilities Analysis of changes in shareholders‟ equity* 7771 88,93% T0288 Liabilities Origin, possibility of use and leasability of shareholders‟ equity* 7450 85,26% T0186 Assets Analysis of the changes and due date of receivables included among current
assets 6337 72,52%
T0216 Assets Analysis of changes in other assets, abbreviated* 6256 71,60% T0301 Liabilities Analysis of changes in staff severance fund* 4383 50,16% T0307 Liabilities Analysis of payables changes and due date 4235 48,47%
T0207 Assets Analysis of changes in liquid funds 4166 47,68%
T0335 Liabilities Analysis of changes in other liabilities, abbreviated* 3743 42,84%
T0284 Liabilities Details on other reserves 3504 40,10%
T0180 Assets Analysis of changes in inventory 3271 37,43%
T0289 Liabilities Origin, possibility of use and leasability of miscellaneous other reserves 3189 36,50% T0191 Assets Details on receivables included among current assets by geographic area 3087 35,33% T0212 Assets Analysis of changes in accrued income and prepaid expenses 3063 35,05% T0312 Liabilities Details on payables by geographic area 3010 34,45% T0129 Assets Analysis of changes in tangible fixed assets 3002 34,36% T0385 Profit and loss Details on net revenue by business category 2972 34,01% T0122 Assets Analysis of changes in intangible fixed assets 2593 29,67% T0331 Liabilities Analysis of changes in accrued liabilities and deferred income 2466 28,22% T0389 Profit and loss Details on net revenue by geographic area 2092 23,94% T0316 Liabilities Analysis of payables covered by real guarantees on social assets* 1997 22,85% T0190 Assets Details on receivables included among current assets by geographic area* 1871 21,41% T0156 Assets Abbreviated details on non-current receivables by geographic area 1829 20,93% T0311 Liabilities Details on payables by geographic area* 1822 20,85% T0139 Assets Analysis of changes in financial assets: shares, other securities, own shares 1758 20,12% Note: tables with * are those specific of the standard financial statements.
Annex 2
Tables proper of the standard financial statements used in the abbreviated ones
Id Section Name No. %
T0186 Assets Analysis of the changes and due date of receivables included among current
assets 6337 72,52%
T0307 Liabilities Analysis of payables changes and due date 4235 48,47%
T0207 Assets Analysis of changes in liquid funds 4166 47,68%
T0284 Liabilities Details on other reserves 3504 40,10%
T0180 Assets Analysis of changes in inventory 3271 37,43%
T0289 Liabilities Origin, possibility of use and leasability of miscellaneous other reserves 3189 36,50% T0191 Assets Details on receivables included among current assets by geographic area 3087 35,33% T0212 Assets Analysis of changes in accrued income and prepaid expenses 3063 35,05% T0312 Liabilities Details on payables by geographic area 3010 34,45% T0129 Assets Analysis of changes in tangible fixed assets 3002 34,36% T0385 Profit and loss Details on net revenue by business category 2972 34,01% T0122 Assets Analysis of changes in intangible fixed assets 2593 29,67% T0331 Liabilities Analysis of changes in accrued liabilities and deferred income 2466 28,22% T0389 Profit and loss Details on net revenue by geographic area 2092 23,94% T0156 Assets Abbreviated details on non-current receivables by geographic area 1829 20,93% T0139 Assets Analysis of changes in financial assets: shares, other securities, own shares 1758 20,12%