http://siba-ese.unisalento.it
RESEARCH ARTICLE
Influence of chemical fixative on the cell size of
phytoplankton guilds
A. Fiocca1*, M.R. Vadrucci2, C. Mazziotti3
1Department of Biological and Environmental Sciences and Technologies,
University of the Salento, Sp.Provinciale Lecce-Monteroni, 73100 Lecce, Italy.
2ARPA Puglia-Regional Agency for the Environmental Prevention and
Protection, Department of Lecce, Via Miglietta 2, 73100 Lecce, Italy.
3ARPA Emilia-Romagna - Regional Agency for the Environmental Prevention
Viale Vespucci, 2, 47042 Cesenatico, Italy.
*Corresponding author: Phone: +39 0832 298932; Fax: +39 0832 298722; E-mail address: [email protected]
Abstract
1 - The quali-quantitative analysis of phytoplankton guild is usually carried out according to the method of Uthermöl (or sedimentation method), but in each step can be present a component of error that can affect the reliability of the final result, from sampling to data analysis.
2 - The following work is intended to focus attention on an important aspect of the phytoplankton analysis: the fixation, with the aim of assessing the effect of two chemical fixatives, formalin and Lugol’s solution, on the taxonomic composition and size structure of phytoplankton guilds. Accordingly, water samples were collected from three different water bodies, coastal marine area facing the Alimini Lake (Southern Adriatic Sea), transitional water (Alimini Grande Lake) and freshwater (Fontanelle Lake). The three water bodies are characterized by a different taxonomic structure of phytoplankton guilds due to difference in chemical-physical and hydrodynamic conditions.
3 - The samples were fixed and then analyzed according to a monthly time series for a period of 125 days.
4 - This study clearly shows that do not exist a better fixative, but on the basis of the phytoplankton classes observed in a sample we could prefer one of the two fixative.
Keywords: phytoplankton, size structure, Fixatives, Formalin, Lugol.
Introduction
Phytoplankton microscope counting requires fixation. Most of available techniques for fixation are taxon specific so that the selection of the most suitable method is dependent on the purpose of the studies (Gifford and Caron, 2000). Accurate determination of phytoplankton taxa required that samples are fixed in different ways. For
example, Chlorophyceae and Diatoms are fixed better in Formalin or in Lugol Acid solution, whereas phytoflagellates tend to lose the flagella when are fixed in Formaline (Sournia, 1978). Neutral or alkaline Lugol’s iodine solutions (Throndsen, 1978) is the most widely used fixatives and they are recommended commonly for preserving ciliates and flagellates. In any case practical
replaced by less dangerous substances or technologies where suitable economically and technically viable alternatives are available”. Comparing the section 2 ”Hazards identification” of the safety data sheets draw up according to 1907/2006/EC, Article 31, is highlighted that formalin is much more dangerous than Lugol’s solution (Fig. 1). Therefore at this time most of the limitations impose that subsamples for
phytoplankton analysis are preserved with a reduced number of fixatives, generally Lugol’s solution (acid, basic or neutral) and Formalin.
On the other hand, an important objective of the article 12 of Regulation EC 1907/2006 is “to encourage and in certain cases to ensure that substances of high concern are eventually
laboratories used mainly Lugol’solution even if in some case Formalin could be better. In any case, the two fixatives are generally know to introduce artefacts including changes in cell size, reduction in cell numbers and changes in cell structures.
The aim of this study was to evaluate the effects of these two chemical fixatives on phytoplankton cell biovolume, analyzing and comparing variations in cell structure and cell size in different types of phytoplankton guilds. To this aim, phytoplankton samples were collected from three sites with different salinity and turbidity. Taken into account the safety data sheets of the two fixatives, this study has also the aim to evaluate the possibility to minimize the use of formalin in favour of a less dangerous substance like the Lugol’s solution.
Materials and methods
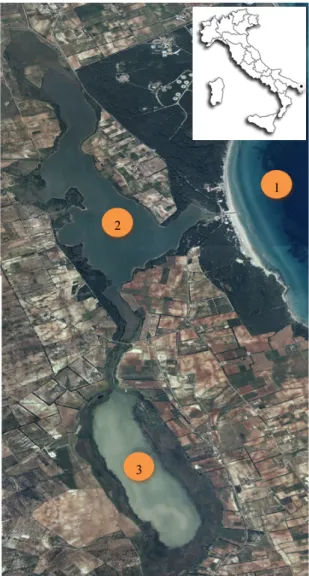
The study sites selected from this experiment were the Alimini lakes, a complex ecosystem characterized by the presence of two aquatic ecosystems: a freshwater lake, named Alimini Piccolo or Fontanelle, and a coastal brackish lake named the Alimini Grande, localized along the Adriatic coast of southern Italy (N 40°12'27'' - E 18°26'53''). The two aquatic ecosystems are connected by a canal called “the Strittu”, but the water exchange, due to the different altitude from the sea of the two ecosystems, occured only from Fontanelle Lake to Alimini Grande Lake. The Alimini Grande Lake was connected with the sea through its mouth (length: 100m, width: 15m). To assess the effects of different fixatives on the cell biovolume and cell structure, the experimental design involved the analysis of samples collected in three sampling points located in the three different water body categories (freshwater, transitional water and coastal marine water) the first sampling point was localized in the Fontanelle Lake, the second sampling point was localized in the Alimini Grande Lake
and the third in a coastal marine area facing the Alimini Grande lake (Fig. 2).
The choice of the three sampling point was primarily based on the presence of:
a) a strong salinity gradient (from 1-2 to 38) which allowed to have a high number of species, due to difference in life strategies (freshwater vs marine species); b) a strong turbidity gradient, which allowed to obtain qualitative information about the effect of different fixatives in the preservation of phytoplankton cells with
Figure 2. Localization of the sampling points in the Alimini lakes area: Localizzation of sampling stations in 1= Coastal marine area; 2= Lake Alimini Grande; 3= Fontanelle lake.
associated to the algal code in the same excel file. The biovolume is calculated according to the models proposed by different authors for a variety of aquatic environments (Edler, 1979; Smayda, 1978; Rott, 1981, Hillebrand
et al., 1999, Sun and Liu, 2003; Vadrucci et al., 2007; 2013). Only the algal cells larger
than 4-5 μm were included in this study. Results
Characteristics of phytoplankton guilds in the marine coastal area
The phytoplankton community identified in this sampling site is dominated by Bacillariophyceae (97.8%). The most abundant genus is Chaetoceros with a 52% of cell abundance. In terms of number of species, a total of 71 taxa belonging to the nano-microphytoplankton was observed, 44 taxa were Bacillariophyceae, 21 taxa were Dinophyceae whereas the remaining 6 taxa belong to Coccolitophorideae (3), Chlorophyceae (1), Cyanophyceae (1), Silicoflagellates (1). It was observed that the fixation of the sample had influenced both the taxonomic composition, in terms of number of taxa, and the average cell biovolume of the phytoplankton guilds. In fact, we observed a significant increase in the number of the species in both samples fixed with Lugol's solution and Formalin, tied to a reduction in the abundance of the species of smaller size which made possible the identification of the rare species. For example, we observed a significant reduction of a small genus belonging to Bacillariophyceae,
Nitzschia, that was dominant in vivo sample.
The average cell biovolume (µm³) increases in the days following the setting for both fixatives used. This increase is due to degradation in the time of smaller and more abundant cells that allows to include an higher number of other species of larger sizes, responsible for the increase in average cell biovolume. The analysis of variance showed that both fixatives have a significant effect a different concentrations of particulate
organic and inorganic matter.
About 6 liters of water were collected with a plankton net (mesch 5µm) in each sampling sites. In the laboratory, the water samples had been fractionated into 6 replicates, each of 1 liter. For each one of them, 5 ml of sample were collected for analysis in vivo, so we proceeded to the fixation as following: 3 replicates (1L each) were fixed with 10 ml of Lugol's solution and the other 3 replicates (1L each) with 15 ml of Formalin. For the duration of the experiment, fixed water samples were kept in a dark and cold room at a temperature of 2-5 °C. To evaluate the effect of the fixatives in time, the samples were analyzed according to a time series with monthly intervals in order to determine the time interval during which the major changes in taxonomic diversity and biovolume were observed. The experiment was carried out for 125 days. The quali- quantitative analysis was performed with a inverted microscope (Nikon mod. Diaphot T300E) with a magnification of 400 X according to the Utermöhl’s method (1958). The method involves sedimentation of a subsample (for 10 to 50ml), for a time depending on the water sample volume sedimented, and following recognition of the algal cells. For each sub-sample, 400 cells were counted and measured using only random fields as counting strategy. For the determination of the algal biovolume (Mazziotti et al., 2007; 2013), the manual method was used in combination with the image analysis system (image analysis software L.U.C.I.A.-Nikon). The operator selects the phytoplankton cells with the inverted optical microscope and draws the perimeter of the cells. The software automatically give as output an excel file with a list of cell measured with associate a code for taxonomic identification and two linear dimensions (maximum length and maximum width), other dimensions need for biovolume calculus are measured manually and then
The same analysis, performed on samples ixed with formalin, gives different results. In fact, it exists a statistically difference between the biovolumes of phytoplankton cells in the time, from 1 day to 75 days. Then the changes are no longer on the size of phytoplankton cells (Table 2).
In particular, the t-Student test shows (Table 3) that, in the samples fixed with Lugol's solution, there is a significant decrease immediately after the fixation, that remains, then, constant in the time.
Table 1 - Changing in time of the number of taxa identified of the phytoplankton guild sampled in the sea, Alimini Lake, Fontanelle Lake and fixed with Lugol’s solution and Formalin.
Biovolume (µm3) Biovolume (µm3) Biovolume (µm3) Fixative Time (days) n° taxa min max mean n° taxa min max mean n° taxa min max mean
Lugol 0 24 4 138,910 9,888 18 12 57,785 1,206 39 4.02 113,583 819 1 36 2 231,910 26,053 24 24 65,522 2,787 35 2 123,611 783 25 33 10 298,657 17,383 29 12 44,498 2,575 32 4 26,468 318 50 31 17 117,021 11,417 25 28 93,869 1,577 - - - -75 37 16 106,651 10,438 - - - -100 29 12 222,108 18,519 29 9 41,371 843 - - - -125 29 17 124,624 18,316 27 10 47,024 964 25 2 11,582 136 Formalin 0 24 4 138,910 9,888 33 16 173,31 3,419 34 4 259,855 1,109 1 38 3 169,932 12,628 32 36 162,93 3,56 32 4 80,303 674 25 31 37 377,163 20,095 26 24 30,635 1,034 35 4 264,465 961 50 26 21 205,913 23,232 31 15 59,078 1,707 - - - -75 32 22 121,009 19,470 - - - -100 27 21 188,359 19,868 34 11 17,669 679 - - - -125 21 10 162,077 21,703 24 11 34,535 1,201 26 3 6,014 126
Sea Alimini Lake Fontanelle lake
Sea SS GL MS F p Fixative 30 1 30 5.80 <0.05 Time (days) 5.678 6 946 183.50 <0.001 Interaction 529 6 88 17.10 <0.001 Error 84.404 16.365 5 Alimini Lake SS GL MS F p Fixative 86 1 86 18 <0.001 Time (days) 4.474 6 746 153 <0.001 Interaction 560 6 93 19 <0.001 Error 79.305 16.284 5 Fontanelle Lake SS GL MS F p Fixative 68 1 68 15 <0.001 Time (days) 1.548 6 258 57 <0.001 Interaction 170 6 28 6 <0.001 Error 75.989 16.771 5
Table 2 - Two-way analysis of variance of cell biovolume (µm³) of the phytoplankton guild in the sea, Alimini Lake, Fontanelle Lake.
significant. Therefore, it results that Lugol fixative is less impact on phytoplankton cell biovolume than the formalin one.
Characteristics of phytoplankton guilds in the Alimini Grande Lake
In the Alimini Lake, the phytoplankton guild, in terms of numerical abundance, is dominated by the Bacillariophyceae which represent the 63% of the cell abundance as a whole. The most representative species was Chaetoceros
wighamii, that contributes with a 40%.
Other important phytoplankton taxa were Cyanophyceae with a 13% of total abundance due to the single genus Spirulina (13%), Dinophyceae with a 12% of total abundance due to the single species Prorocentrum micans (6%), Chlorophyceae (2%), the remainder of total abundance was represented by other Classes. In terms of taxonomic diversity, a total of 58 taxa were identified, 27 of which belong to the class Bacillariophyceae, 11 taxa belong to Chlorophyceae and 16 taxa belong to Dinophyceae. The others
4 taxa belong to Cyanophyceae (2 taxa), to Coccolithophorideae (1 taxon), and to Coniugatophyceae (1 taxon). The effects of the two fixatives (Table 1) did not highlighted significant variation relating to the number of taxa; while for the average cell size (µm³), fixatives had significant effects but in different times. These effects were confirmed by the results of the analysis of variance (Table 2).
In particular, in samples preserved with Lugol's solution, it was observed a significant increase in cell size until the 50th day, then the size will remain constant until the 100th day and then change again. Formalin seems to be more conservative on a long-time series. In fact no further changes occur after 75 days of fixation (Table 4).
Characteristics of phytoplankton guilds in Fontanelle Lake
In terms of numerical abundance, the phytoplankton guild was characterized by 45% of Cyanophyceae, with the dominant
Table 3 - t-Student test for comparison of cell biovolume of phytoplankton guild fixed with Lugol’s solution and formalin. Fixative: Lugol Time (days) 1 25 50 75 100 125 0 <0.01 <0.01 <0.01 <0.01 <0.01 <0.01 1 <0.01 n.s. <0.01 n.s. n.s. 25 <0.05 n.s. n.s. <0.01 50 <0.01 n.s. n.s. 75 n.s. <0.01 100 <0.05 Fixative: Formalin Time (days) 1 25 50 75 100 125 0 <0.01 <0.01 <0.01 <0.01 <0.01 <0.01 1 <0.01 <0.01 <0.01 <0.01 <0.01 25 n.s. <0.05 <0.01 <0.01 50 n.s. n.s. <0.01 75 n.s. <0.05 100 n.s.
genus Spirulina which contributes for the 44%, followed by the Chlorophyceae with the 29% of the total abundance with the dominant contributes of the genus Kirchneriella (13%), the Cryptophyceae with the 20%. Other classes contributes less than 1%.
In terms of taxonomic diversity, 44 taxa were identified as a whole, 23 of which belong to the Chlorophyceae class, 12 taxa to Bacillariophyceae, 4 taxa to Coniugatophyceae, 3 taxa to Dinophyceae and 2 taxa to Cyanophyceae. The analysis in this ecosystem, found a pattern of variation both for taxonomic diversity and for cell biovolume (Table 1). In particular, only in samples fixed with Lugol's solution it was observed a decrease in taxonomic diversity in the time, while for both fixatives was observed a reduction in the average cell biovolume. The analysis of variance showed that both fixatives, during the preservation of the sample, have a significant effect on the size of phytoplankton cells (Table 2); the post-hoc test on cell biovolume data
(Table 5), proves that the samples preserved with Lugol's solution, show a change in the average cell biovolume from the first day of fixing to the 50th day, then we can see no further changes in the size structure. In contrast, for samples fixed with formalin, we have no significant change until the 50th day, then there is a decrease in biovolume that stopped at the 75th day of the experiment and then remains constant.
Discussion
The results obtained in this work help to define and standardize the method and procedure for the application of synthetic descriptors of phytoplankton in monitoring plans of aquatic ecosystems.
The results obtain in this work shows that the two fixatives have different effects above all in phytoplankton cell biovolume in all categories of water ecosystems sampled (marine coastal area, transitional water and freshwater).
In coastal marine environment, where there
Table 4 - t-Student test for comparison of cell biovolume of phytoplankton guilds fixed with Lugol’s solution and formalin. Fixative: Lugol Time (days) 1 25 50 75 100 125 0 <0.01 <0.01 <0.01 <0.01 <0.01 <0.01 1 n.s. <0.01 <0.01 <0.01 <0.01 25 <0.01 <0.01 <0.01 <0.01 50 n.s. n.s. <0.01 75 n.s. <0.01 100 <0.01 Fixative: Formalin Time (days) 1 25 50 75 100 125 0 <0.01 <0.01 <0.01 <0.01 <0.01 <0.01 1 <0.01 n.s. <0.01 <0.01 <0.01 25 <0.01 <0.01 <0.01 <0.01 50 <0.01 <0.01 <0.01 75 n.s. n.s. 100 n.s.
is a predominance of Bacillariophyceae, the less aggressive fixative against the cell biovolume seems to be the Lugol, which after a first modification of the dimensional structure of the average cell biovolume in the first 24 hours, after the fixation, did not alter it further and/or in a significant way for the next 50 days. In the transitional water ecosystems, where the phytoplankton guild was more heterogeneous, the two fixatives alter the structure of the community in size in a similar way, inducing an increase in the average size of the cells, due to the disappearance for degradation of the smaller species and the subsequent ostensible prevalence during microscopic examination of rare and large species. In the freshwater ecosystem, where the most abundant classes are Chlorophyceae and Cyanophyceae, the fixative that causes less alteration in the cell biovolume seems to be the Formalin.
From this analysis, it can be concluded that the Bacillariophyceae and Dinophyceae tecate better retain their dimensional
Table 5 - t-Student test for comparison of cell biovolume of phytoplankton guilds fixed with Lugol’s solution and formalin. Fixative: Lugol Time (days) 1 25 50 75 100 125 0 <0.01 n.s. <0.01 <0.01 <0.01 <0.01 1 n.s. <0.01 <0.01 <0.01 <0.01 25 <0.01 <0.01 <0.01 <0.01 50 n.s. n.s. n.s. 75 n.s. n.s. 100 n.s. Fixative: Formalin Time (days) 1 25 50 75 100 125 0 n.s. n.s. n.s. <0.01 <0.01 <0.01 1 n.s. n.s. <0.01 <0.01 <0.01 25 n.s. <0.01 <0.01 <0.01 50 <0.01 <0.01 <0.01 75 n.s. n.s. 100 n.s.
structure if preserved with Lugol's solution, whereas Cyanophyceae and Chlorophyceae seem to better preserve their biovolume if fixed with formalin. So the choice of the best fixative isn’t absolute but depends on the taxonomic classes that characterize an aquatic ecosystem. This aspect was also confirmed in literature: changes in the size and shape of the cells (shrinkage, swelling and so on), in response to the use of Lugol’s or formalin have been reported extensively in the literature (Mender-Deuer et al., 2001; Zarauz and Irigoien 2008 ).
In conclusion, the use of formalin can be limited in those environments where Chlorophyceae and Cyanophyceae are the most abundant taxa, such as in freshwater ecosystems. In this way also the exposition to this toxic substance by the operators can be reduced in accordance with the new EU regulation in matter of environmental protection, occupational health and safety.
Thronsen J, 1978. Preservation and storage. In: Phytoplankton manual, ed. A Sournia, UNESCO, 69-74.
Utermöhl H 1958. Zur Vervollkommnung der Quantitativen Phytoplankton Methodik. Mitteilungen. Internationale Vereiningung fuer Theoretische und Angewandte Limnologie 9: 1-38.
Vadrucci MR, Cabrini M, Basset A. 2007. Biovolume determination of phytoplankton guilds in transitional water ecosystems of Mediterranean Ecoregion. Transitional Water Bulletin 2: 83-102.
Vadrucci MR, Mazziotti C, Fiocca A, 2013. Cell biovolume and surface area in phytoplankton of Mediterranean transitional water ecosystems: methodological aspects. Transitional Water Bulletin 2: 100-123
Zarauz L, Irigoien X 2008. Effects of Lugol’s fixation on the size structure of natural nano– microplankton samples, analyzed by means of an automatic counting method. Journal of Plankton Research 30: 1297-1303.
Acknowledgments
This work was supported by INTERREG IIIB CADSES programme, TWReferenceNet project n° 3B073. This paper is a synthesis of Master's degree dissertation supported by INTERREG IIIA /CARDS PHARE Adriatic cross border cooperation program - EcoGovernance project. References
EC-REGULATION (EC) No 1907/2006 OF THE EUROPEAN PARLAMENT AND OF THE COUNCIL of 18 December 2006 concerning the Registration, Evaluation, Authorisation and Restriction of Chemicals (REACH), establishing a European Chemicals Agency.
Edler L (ed) 1979. Phytoplankton and Chlorophyll. Recommenadations on Methods for Marine Biological Studies in the Baltic Sea. Baltic Biologists Publication 5.
Gifford DJ, Caron DA 2000. Sampling, preservation, enumeration and biomass of marine protozooplankton. In: Harris R. P., Lenz J., Huntley M. E., et al., editors. ICES Zooplankton Methodology Manual. San Diego: Academic Press.
Hillebrand H, Durselen CD, Kirschtel D, Pollingher U, Zohary T 1999. Biovolume calculation for pelagic and benthic microalgae. Journal of Phycology 35: 403-424.
Mazziotti C, Fiocca A, Vadrucci MR 2013. Phytoplankton in transitional waters: Sedimentation and Counting methods. Transitional Water Bulletin 2: 90-99.
Mazziotti C, Vadrucci MR 2007. Methodological aspects of phytoplankton analysis in transitional waters. Transitional Water Bulletin 3: 9-12. Mender-Deuer S, Lessard E, Satterberg J 2001.
Effect of preservation on dinoflagellate and diatom cell volume and consequences for carbon biomass predictions. Marine Ecology Progress Series 222: 41-50.
Rott E 1981. Some results from phytoplankton counting intercalibration. Hydrobiology 43: 34-62.
Smayda TJ 1978. From Phytoplancton to biomass. In: Sournia A. (ed. 1978) Phytoplankton Manual. Monographs on Oceanographic Methodology 6. UNESCO, Paris.
Sun J, Liu D 2003. Geometric models for calculating cell biovolume and surface area for phytoplancton. Journal of Plankton Research 25:1331-1346.