COMPARING THE BODY MASS VARIATIONS IN ENDEMIC INSULAR SPECIES OF THE GENUS PROLAGUS (OCHOTONIDAE, LAGOMORPHA) IN THE PLEISTOCENE OF SARDINIA (ITALY)
BLANCA MONCUNILL-SOLÉ1, CATERINELLA TUVERI2, MARISA ARCA2 &
CHIARA ANGELONE1*
1Institut Català de Paleontologia Miquel Crusafont, Edifici Z ICTA−ICP, Carrer de les Columnes s/n, Campus de la Universitat Autònoma de
Barcelona, 08193 Cerdanyola del Vallès, Barcelona, Spain. E-mail: [email protected], [email protected]. *Corresponding author.
2Soprintendenza Archeologia della Sardegna, via G. Asproni 33, 08100 Nuoro, Italy. E-mail: [email protected], marisa.arca@
beniculturali.it.
To cite this article: Moncunill-Solé B., Tuveri C., Arca M. & Angelone C. (2016) - Comparing the body mass variations in endemic insular species of the genus Prolagus (Ochotonidae, Lagomorpha) in the Pleistocene of Sardinia (Italy). Riv. It. Paleont. Strat. 122(1): 25-36
Abstract. Prolagus figaro and P. sardus are part of an endemic insular anagenetic lineage that populated Sardinia since
the earliest Late Pliocene to Holocene. BM of some populations of these two species was calculated using re-gression models. The best BM proxies for Prolagus are: femur length, zeugopod measurements and distal humerus
diameter. The anagenetic lineage shows a BM increase of ca 20% from the populations of P. figaro (398-436 g) to P. sardus (504-525 g). The trend shown by the size of lower third premolar, even if not directly comparable with
BM, is opposite (ca -30% at the transition P. figaro-P. sardus). Compared to P. cf. calpensis, a continental species of
similar age, BM of P. figaro is ca +25%. The comparison with the insular endemic P. apricenicus evidenced
diffe-rences in BM range and timespan required to attain it, due to the different size and palaeogeographical situation of the islands. Insular endemic Prolagus follow the small mammal pattern of Island Rule. Mein’s (1983) biphasic
model seems applicable to the evolution of P. figaro. A tachytelic phase followed by a bradytelic one seems to
characterize also the appearance of P. sardus, at least for dental traits, a process probably triggered by important
variations of abiotic and biotic traits of the environment, as indicated by the turnover that marks the onset of the Dragonara subcomplex. The prediction of life history traits and other biological attributes of Sardinian Prolagus
using BM should be considered with caution due to the complexity of ecological selective regimes of Sardinia.
Received:September 27, 2015; accepted: January 12, 2016
Keywords: Body mass, regression models, postcranial bones, Island Rule, Mediterranean islands, Prolagus figaro, P. sardus.
I
ntroductIonBody size is a fundamental trait in the biology and ecology of species as it shows tight correlation with several physiological, behavioral, morpholo-gical, ecological and life history attributes (Peters 1983; Calder 1984). The best proxy for quantifying the BS of individuals is their body mass or weight (Gingerich et al. 1982). Thus, predicting the BM of fossil species is of critical significance for knowing their biology as well as for understanding and quantifying their adaptations to habitats (Palombo 2009a). For most of mammalian taxa, the allometric relationships among BM and bone/dental measu-rements of extant relative species allow the deve-lopment of regression models to estimate the ave-rage weight of extinct ones (Damuth & MacFadden 1990; see Palombo 2009a: tab. 1 for a synopsis).
In spite of the abundance, diversity and ubi-quity of fossil lagomorphs (leporids and ochoto-nids), models for estimating the BMs of species be-longing to this order were developed very recently. Quintana Cardona (2005) and Quintana et al. (2011) provided the first models for leporids. Subsequen-tly, expanding the database of Quintana Cardona (2005) and adding measurements of extant ochoto-nids, Moncunill-Solé et al. (2015) developed general and specific equations for estimating the BM of la-gomorphs based on a multiproxy approach (teeth, cranial and postcranial measurements). BM estima-tion models for lagomorphs are going to enhance data about palaeocommunity structures and their palaeoenvironmental interpretations.
In view of the potential of this field, we deci-ded to study the BM of the insular endemic ocho-tonids of the Pleistocene of Sardinia (Italy): Prola-gus figaro and ProlaProla-gus sardus. ProlaProla-gus figaro is known
from the latest Pliocene/earliest Pleistocene to the late Early Pleistocene of Sardinia (Capo Figari/
Orosei 1 subcomplex of the Nesogoral FC-
Oro-sei 2 subcomplex of the Microtus (Tyrrhenicola) FC; Palombo 2009b). Prolagus sardus is reported since
the Middle Pleistocene (Dragonara subcomplex of the Microtus (Tyrrhenicola) FC; Palombo 2009b)
until historical epoch in Sardinia and also in Cor-sica (Vigne & Valladas 1996; Wilkens 2004). We aim to:
1) Evaluate the BM trend of Prolagus in
an insular habitat from an evolutionary point of view, as the two species of Prolagus from
Sardi-nia are part of an anagenetic evolutionary lineage (Angelone et al. 2015).
2) Assess the response of fossil ochotonid species to insular regimes (Island Rule) (see Palom-bo 2009a and references therein for an update of the debate about this subject) as there are not extant relatives living on islands.
3) Provide data to increase the scarce biologi-cal knowledge of Sardinian Prolagus.
AbbrevIAtIons
BM: body mass; BS: body size; CMd1: Capo Mannu D1; IC: interval of confidence; FC: faunal complex; FL: femur length; FTDd: distal femoral transversal diameter; FTDp: proximal femoral transver-sal diameter; HAPDd: distal humeral anteroposterior diameter;
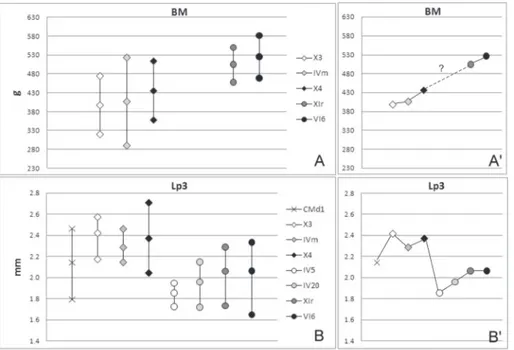
Fig. 1 - BM predictions (Y axis, in g) for Prolagus figaro and P. sardus calculated on the basis of different postcranial measurements (X axis). BM
average (black line), confidence interval (dotted lines) and number of individuals are shown. A) Prolagus figaro, fissure infilling X3; B) P. figaro, fissure infilling IVm; C) P. figaro, fissure infilling X4; D) Prolagus sardus, fissure infilling XIr and E) P. sardus, fissure infilling VIb.
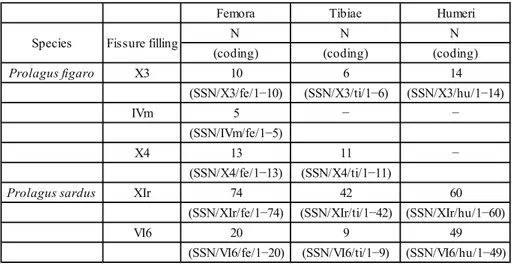
Femora Tibiae Humeri
N N N
(coding) (coding) (coding)
Prolagus figaro X3 10 6 14
(SSN/X3/fe/1−10) (SSN/X3/ti/1−6) (SSN/X3/hu/1−14)
IVm 5 − −
(SSN/IVm/fe/1−5)
X4 13 11 −
(SSN/X4/fe/1−13) (SSN/X4/ti/1−11)
Prolagus sardus XIr 74 42 60
(SSN/XIr/fe/1−74) (SSN/XIr/ti/1−42) (SSN/XIr/hu/1−60)
VI6 20 9 49
(SSN/VI6/fe/1−20) (SSN/VI6/ti/1−9) (SSN/VI6/hu/1−49) Species Fissure filling
Tab. 1 - Fossil material used for performing the study.
HAPDp: proximal humeral anteroposterior diameter; HL: humerus length; HTDd: distal humeral transversal diameter; Lp3: length of the third premolar; N: sample size; SSN: Soprintendenza dei Beni Archeologici per le Provincie di Sassari e Nuoro, sede di Nuoro; TAPDp: proximal tibia anteroposterior diameter; TL: tibia length; TTDd: distal tibia transversal diameter; TTDp: proximal tibia trans-versal diameter; : arithmetic mean; W: weighted mean.
MAterIAl
The samples of P. figaro and P. sardus come from the Monte
Tuttavista karstic complex (E Sardinia; Abbazzi et al. 2004) (Tab. 1). Remains of P. figaro come from infillings X3, IVm and X4, pertaining
to the Capo Figari/Orosei 1 subcomplex of the Nesogoral FC-Orosei
2 subcomplex of the Microtus (Tyrrhenicola) FC (latest
Pliocene/ear-liest Pleistocene to the late Early Pleistocene; Palombo 2009b). In this context, notice that Palombo (2009b) gave a different relative temporal arrangement of the aforementioned infillings (IVm-X4-X3). Remains of P. sardus have been sampled from infillings XIr and
VI6, included in the Dragonara subcomplex of the Microtus (Tyrrhe-nicola) FC (Middle and Late Pleistocene; Palombo 2009b). Infillings
XIr and VI6 were accumulated in a quite short time and their palae-ontological contents are taxonomically homogeneous (see Angelone et al. 2008 for discussion). Preliminary analysis of Prolagus remains
and literature data based on other taxa (Angelone et al. 2009; Palom-bo 2009b and references therein) pointed out that X3, IVm and X4
Tab. 2 - BM predictions (in g) for the populations of Prolagus figaro and P. sardus analyzed in this paper. Last two rows, highlighted in gray, show
the arithmetic mean of BM calculated for each site, and their weighted average.
also are taxonomically homogeneous infillings. The fossil material is curated at the SSN.
Methods
The skeletal maturation indicates the complete cessation of longitudinal growth and, consequently, the moment when animals achieve the final BS which is maintained until their death (Peters 1983). Thus, BM estimations of Prolagus species were only carried
out on individuals that have already attained skeletal maturity (fused epiphyses). Specimens with unfused or broken epiphyses were not considered. Ochotona, the extant relative of Prolagus, shows a minimal
sexual dimorphism (Smith 1988; Nowak 1999). For this reason, we did not assume BM differences between sexes in our fossil sample.
For undertaking the BM estimations, we followed the meth-odology described and illustrated by Moncunill-Solé et al. (2015: fig. 1). The following measurements were taken on postcranial remains: 1) FL, FTDd and FTDp on femora; 2) HL, HAPDp, HAPDd and HTDd on humeri; and 3) TL, TAPDp, TTDp and TTDd on tibi-ae. Moncunill-Solé et al. (2015) observed that burrower species of
Ochotona and leporids show significant differences in the allometric
models of the humerus, but not in other skeletal elements (femur and tibia). Although Ochotona is the closest relative of Prolagus, we
preferred to use a general regression model for humeri (i.e. models that include data of leporids and Ochotona) because the locomotion
of the species of Prolagus is not well known. The equations are shown
x̄ x̄ x̄ x̄ x̄
(IC) (IC) (IC) (IC) (IC)
537.57 1 444.74 1 − − 463.09 52 452.12 19 (448.98-477.20) (426.38−477.85) 441.19 6 484.96 4 474.51 10 624.91 55 566.28 18 (337.88-544.51) (432.23-537.69) (423.18-525.84) (605.96-643.86) (538.47-594.08) 406.21 3 289.40 2 306.13 3 440.50 58 424.84 19 (207.12-605.30) (178.91-399.90) (251.76-360.51) (421.79-459.21) (398.98-450.70) 364.47 3 − − − − 633.99 47 416.71 44 (360.73-368.22) (605.66-662.33) (403.42-430.00) 665.15 5 − − − − 633.99 37 709.82 35 (593.75-736.56) (605.66-662.33) (675.19-744.15) 345.03 11 − − − − 425.75 54 441.69 44 (311.26-378.80) (409.64-441.87) (421.16-462.25) 470.57 11 − − − − 519.21 53 528.79 44 (393.39-547.74) (493.6-544.77) (501.34-556.24) 342.28 2 − − − − 422.18 40 445.57 9 (296.52-388.03) (407.09-437.27) (415.82-475.32) 298.77 5 − − 545.27 6 530.28 35 578.26 8 (233.38-364.16) (454.86-635.69) (509.28-551.47) (530.81-625.71) 170.50 4 − − 400.62 6 536.58 32 586.70 8 (155.93-185.06) (312.36-488.68) (513.18-559.98) (558.05-615.35) 334.94 2 − − 452.19 5 540.94 38 624.73 9 (241.77-428.12) (353.44-550.93) (516.22-565.66) (551.11-698.36) 397.88 406.37 435.74 503.86 525.05 (320.68-475.08) (289.50-523.23) (357.59-513.90) (456.89-550.83) (468.12-581.97) Weighted Average 402.34 423.34 453.326 520.83 512.40 TTDp logBM=0.219++2.577logTTDp TTDd logBM=0.461+2.584logTTDd Arithmetic Mean HTDd logBM=1.053+1.513logHTDd TL logBM=−1.271+2.254logTL TAPDp logBM=0.599+2.265logTAPDp HL logBM=−1.221+2.418logHL HAPDp logBM=0.916+1.769logHAPDp HAPDd logBM=1.354+1.769logHAPDd N FL logBM=−1.11+2.229logFL FTDp logBM=0.498+2.217logFTDp N N N FTDd logBM=0.318+2.481logFTDd Measurement Equation N
BM Prolagus figaro BM Prolagus sardus
in Tab. 2. Once the regression models were applied, we eliminated outliers due to their potential for skewing the distributions. We fol-lowed the criterion of Tukey (1977): outliers (Y) were considered when Y < (Q1−1.5IQR) or Y > (Q3+1.5IQR) (where Q1 is the 25th percentile, Q3 is the 75th percentile, and IQR the interquartile range (Q3−Q1)) (Quinn & Keough 2002). For each specific measurement, it was calculated an arithmetic mean () and a confidence interval (IC) [±((σ/√N)Zα/2)]. Based on the BM of each measurement, we performed an arithmetic average () and a weighted average (W) [(X1W1+X2W2+…+XNWN)/(W1+W2+…+WN)].
In order to compare the different populations of Prolagus and
analyze the BM variation, we performed ANOVA analyses and post hoc tests (Tukey HSD) (α = 0.05) using the IBM SPSS Statistics 19 software.
r
esultsThe results of BM estimations (means, IC, N) are shown in Tab. 2 and are represented in Fig. 1.
For P. figaro, we estimate a weight of 397.88
g (320.68-475.08) in fissure filling X3, of 406.37 g (289.50-523.23) in IVm and of 435.74 g (357.59-513.90) in X4. For P. sardus the results are greater,
503.86 g (456.89-550.83) in fissure filling XIr and 525.05 g (468.12-581.97) in VI6. We do not observe significant differences between and W (their dif-ference is ca 10-20 g) and the latter falls perfectly in the IC of the former (Tab. 2). Statistically, there are only significant differences (p < 0.05) between the oldest population of P. figaro (X3) and the youngest
of P. sardus (VI6).
When the BM estimations of each measu-rement are assessed, a similar pattern could be observed comparing the populations with the
lar-gest N (VI6 and XIr) (Fig. 1). The variables FTDp and HAPDp estimate a BM far above the arithme-tic mean (between 100-200 g greater), especially in VI6 population. The other variables fall next or in-side the IC of the arithmetic mean (specially FL, TAPDp, TTDp, TTDd and HTDd). Analyzing the results of the other populations (X3, IVm and X4), we observe more heterogeneous patterns. This may be consequence of: 1) few measurements taken in postcranial bones (3 in IVm and 5 in X4) and 2) small N (ranging from 1 to 11 individuals in X3). However, in this latter population (X3), it is already evident a large value of BM when HAPDp measu-rement is used, but not in FTDp.
d
IscussIonBM of Sardinian Prolagus: trends and best estimators. Based on dental morphology, a
relative temporal arrangement of the studied fissure has been attempted. Preliminary results suggested the relative chronological arrangement X3-IVm-X4 (from older to younger) of populations of P. figa-ro (Angelone et al. 2009). In the case of
popula-tions of P. sardus, infilling XIr is older than VI6 on
the basis of a morphological cline (Angelone et al. 2008). In view of this and the BM results, the three selected populations of P. figaro show a total
weight increase of ca 10% from the oldest fissure filling (X3) to the youngest (X4) (see Tab. 2, Fig. 1 and 2A). The BM of the oldest population of P. Fig. 2 - BM range A) and Lp3
ran-ge B) showing max, averaran-ge and min values of Prolagus
aff. figaro (cross, CMd1), P. figaro (diamonds, X3, IVm,
X4) and P. sardus (circles,
IV5, IV20, XIr, VI6), with detail of average values and trends of BM (A’) and Lp3 (B’).
sardus here analyzed (XIr) is ca 15% greater than the
youngest of P. figaro (X4). The average BMs of the
two populations of P. sardus selected for this study
show a very slight difference (average BM of VI6 is about 4% larger). Finally, the total increase among the oldest (X3) to the youngest populations (VI6) of Sardinian Prolagus is of 32% (statistically
signifi-cant, p < 0.05). Thus, we can affirm that Sardinian
Prolagus increased its BM (average) throughout the
Pleistocene.
The best BM estimator for an extinct species not only depends on the accuracy of the model (statistical values), but also on a subjective judg-ment of the results of predictions (Reynolds 2002). According to the fissure infilling with highest sam-ple (XIr) (Fig. 1d), hindlimb bones seem to be the better BM estimators for Prolagus species (as shown
also in Moncunill-Solé et al. 2015), particularly FL, TAPDp, TTDp and TTDd. However, HTDd also gives adjusted estimations. All these measurements predicted BM that fall inside the IC of the arithme-tic mean and, consequently, we can consider them good proxies for the estimation of BM in the genus
Prolagus. However, N must be taken into due
ac-count. For example, the BM predicted by FL (N=1) in X3 population is far above the arithmetic mean. It is recommendable to work with the largest sample possible in order to better represent the biological variability of the species and, thus, obtain more rea-listic values.The measurements regarded as the best BM estimators are surprising for two facts. Firstly, zeugopods (tibiae), which are involved in the loco-motion and lifestyle of the animal, normally predict worse the BM of mammals (Scott 1990). Secondly, the lengths of long bones are also considered as less accurate than diameters or perimeters (Scott 1990). However, in the case of lagomorphs, the models that use length or zeugopodial measurements are as reliable (coefficient of determination or average absolute per cent prediction) as those that use other postcranial elements, in contrast to other mamma-lian orders (see also Moncunill-Solé et al. 2015).
Taking into consideration quantitative results, HAPDp measurement overestimates in all popula-tions the BM in Prolagus and could not be considered
a reliable proxy. FTDp does not show a clear pat-tern, being far above in the case of XIr population (those with the largest N), but not in others (X3, IVm, X4, VI6). The BM overestimation observed when HAPDp is used for prediction is indicative
that this measurement does not only represent the BM of the species but also other biological attribu-tes, such as locomotion or phylogeny. Samuels & Valkenburgh (2008) described some skeletal specia-lizations of rodents depending on their locomotion style. For example, a broad and robust distal hume-rus is indicative of fossorial or semifossorial habits. We encourage the scientific community to perform new studies that analyze the locomotion, biomecha-nics and skeletal proportions of Prolagus species in
comparison with its extant relatives (Ochotona spp.).
This will increase the biological knowledge of Prola-gus and might help us to discard those measures that
are correlated with their locomotion or phylogeny for predicting BM.
BM and teeth size: the case of Sardinian
Prolagus. It is interesting to compare the trends of
BM vs Lp3 in the P. figaro − P. sardus lineage. We
take into consideration p3 because it is the most reliable tooth position for specific identification in lagomorphs. As shown in Fig. 2b, average Lp3 in-creases (ca 13%) when the oldest population of P. figaro (X3) is compared to P. aff. figaro from CMd1
site, the “founder” of the Sardinian lineage. Lp3 of
P. figaro shows a maximum oscillation of 6% in the
considered populations. A drastic drop of Lp3 (al-most 30%) is recorded between P. figaro (X4) and
the oldest studied population of P. sardus (IV5).
After IV5, Lp3 values of P. sardus increase slightly
through time (total increase of ca 11% in the stu-died populations) following an asymptotic pattern (see also Angelone et al. 2008). When we analyzed the BM variation, the first thing that we observe is that its record is more incomplete than for teeth: BM estimations are not available for P. aff. figaro and
older populations of P. sardus (Fig. 2a). Moreover,
we have to take into due account that BM values have been obtained after complex data treatment, whereas Lp3 are raw data. Nevertheless, it is evident that BM and Lp3 of Sardinian Prolagus follow quite
different trends. The differences are not so evident among populations of P. figaro: average BM
increa-ses of ca 10%, whereas average Lp3 fluctuates of ca 6%. Evident discrepancies can be noticed with the appearance of P. sardus. Average Lp3 drops of
ca 30% between youngest P. figaro (X4) and oldest P. sardus (IV5). Then, Lp3 average increases
throu-gh time in P. sardus attesting to a value of 2.06 mm
data relative to older infillings (IV5 and IV20), we can only state that younger ones (XIr and VI6) show a higher BM average (ca 15-20%) than P. figaro (X4).
Hypothesizing a dramatic BM decrease between P. figaro and P. sardus followed by an explosive increase
to exceed P. figaro BM values is not realistic. The
most parsimonious hypothesis is that BM followed a general increase trend through the transition P. figaro-P. sardus and throughout the evolution of P. sardus, countertrending Lp3 drastic drop observed
at the transition P. figaro − P. sardus.
The fact that p3 dimensional trend shows evi-dent discrepancies with BM pattern inferred throu-gh postcranial elements casts doubts about the usa-ge of p3 as a proxy for BM estimation in insular endemic Prolagus. Compared to continental species
of Prolagus, insular endemic species show a
notice-able enlargement of the size of p3 vs the size of molariform elements of the lower tooth row (see Angelone 2005: fig. 6 for a qualitative comparison) probably due to a reassessment in jaw mechanics. At any rate, the reliability of teeth as BM proxies has been questioned also in studies that took into consideration a continental species of Prolagus as
well as a wider selection of fossil lagomorphs case studies (Moncunill-Solé et al. 2015). They prefer models based on postcranial bones, as directly rela-ted to weight bearing.
Timing and patterns of BM variations in Sardinian Prolagus. Mein (1983) illustrated a
biphasic pattern of evolution on islands consisting in a first tachytelic step in which the immigrant spe-cies undergoes sudden morpho-dimensional chan-ges corresponding to its entrance to insular selec-tive regimes and a second step in which the taxon undergoes a relatively long bradytelic phase. Mil-lien (2006) further corroborated and “quantified” Mein’s rule. According to some authors (Sondaar 1977; Alcover et al. 1981; Lister 1989, 1996), the tachytelic stage is a change in the “evolutionary di-rection” (sensu Sondaar 1977; e.g. BS shift or low gear locomotion) whereas the bradytelic one is a further continuation of the existing “direction of the change” (ib., e.g. harvesting saving by increase of hypsodonty, changes in dentognathic feeding ap-paratus, or developing traits for searching fallback resources). Evans et al. (2012) estimated a minimum of 4000 years for small mammals to become giants (ca 16000 generations).
If we apply Mein’s model to Sardinian Prolagus
lineage, the first phase should have taken place du-ring or short after the Early/Late Pliocene bounda-ry (age of the CMd1 fossil assemblage). Indeed, P.
aff. figaro from CMd1 shows very slight
morpholo-gical modifications due to endemism, evidence of its very recent arrival from mainland (Angelone et al. 2015). The Lp3 of P. aff. figaro is comparable to
the values of populations of continental Italy from MN16 (absence record for MN15; Angelone et al. 2015) and is between 7-13% smaller than P. figaro.
There is no record of the possible changes of BM occurred in the 1 Ma that separate CMd1 and the ol-dest populations of P. figaro from Monte Tuttavista.
We have not enough data to clearly recognize the tachytelic stage of Mein’s model in P. aff. figaro-P. figaro and to verify/quantify the dimensional chan-ges and the time span needed to produce them. The populations of P. figaro here analyzed should cover a
time span of ca 0.3-0.4 Ma (inferred from Palombo 2009b: fig 2). In this time span, slight weight fluctua-tions have been observed, which may correspond to the bradytelic phase of Mein’s model.
The appearance of P. sardus (closely related
to P. figaro and not an immigrant from mainland;
Angelone et al. 2015) occurred during the transition from the Orosei 2 subcomplex to the Dragonara subcomplex (ca 0.8-0.7 Ma; inferred from Palombo 2009b: fig 2). This transition is characterized by the highest species turnover recorded in the Quaterna-ry of Sardinia (Palombo 2009b). Leaving aside the reason of this dramatic change (see next section), it seems to have triggered a new biphasic evolutio-nary phenomenon which follows Mein’s model too. In general the phyletic lineages of Sardinian small mammals underwent outright (geologically spea-king), an abrupt and noticeable increase in dental size (Abbazzi et al. 2004). Contrarily Prolagus, as
sta-ted above, experienced a drastic Lp3 decrease. The absence of data from IV5 and IV20 fissure fillings does not allow us to quantify changes in BM. Teeth size and morphology in early populations of P. sar-dus underwent an evolution comparable to Mein’s
model first phase. The slight, asymptotic growth of
P. sardus Lp3 and postcranial measurements
(Ange-lone et al. 2008), that in our data covers the inter-val between ca 0.6-0.4 Ma (inferred from Palombo 2009b: fig. 2), parallelizes Mein’s model second pha-se. Indeed, Mein’s rule focuses on the first stages of colonization of the island, making reference to the
biological adaptation of the species to the new se-lective regimes. However later on, changes can also take place consequence of the variation in the en-vironment. Abiotic changes (climatic, topographic, among others) and variations of biotic traits (e.g. levels of predation, intra- and interspecific compe-tition), both have a significant role to drive evolu-tion (Alcover et al. 1981; Brockhurst et al. 2014). Our data seem to indicate that Mein’s model can be applied several times to a taxon during its evo-lution of an island, if significant ecological changes occur (e.g. climatic changes or variation in levels of selective regimes). The study of other mammalian lineages of the Pleistocene of Sardinia or other islands may provide more case studies to support this hypothesis.
Driving factors in the evolution of Sardi-nian Prolagus: some hypotheses. The sea level
low stand at the Early/Late Pliocene transition al-lowed the migration of P. sorbinii from Italian
main-land towards Sardinia (Angelone & Kotsakis 2001; Angeloneet al. 2015). Insular selective regimes trig-gered the morpho-dimensional changes in the im-migrant that led to P. figaro. Prolagus figaro survived
until the end of the Orosei 2 subcomplex. The ap-pearance of Prolagus sardus marks the onset of the
Dragonara subcomplex, characterized by a com-plete turnover in the small mammals’ component of Sardinian fauna (except for Talpa): the leporid
and the glirid Tyrrhenoglis did not survive the
transi-tion; the insectivore Nesiotites and the rodents Tyr-rhenicola and Rhagamys, descendants of taxa already
present in the Orosei 2 subcomplex, underwent evident modifications of teeth morphology and a noticeable increase of teeth size probably coupled with a BS increase (Abbazzi et al. 2004); the ochoto-nid Prolagus underwent a decrease of Lp3 but an
in-crease of BM.
The ancestors of the small mammal genera which survived into the Dragonara subcomplex were present and already showed endemic traits since the Orosei 2 subcomplex (i.e. Tyrrhenicola) or
at least since the Capo Figari/Orosei 1 subcomplex. The competition among small mammal species as driving factor of the turnover between the Orosei 2/Dragonara subcomplexes can be ruled out and the extinction of glirids and of the leporid is not likely to have triggered a competition to occupy its niche in taxa with such a wide range of ecological
requirements, and the arrival of Tyrrhenicola already
occurred earlier. The arrival of the canid Cynotheri-um (once regarded as a specialized Prolagus hunter,
and recently considered a small-prey hunter, pos-sibly also birds, without evident specialization in
Prolagus hunting; Malatesta 1970; Lyras et al. 2006,
2010) occurred at the onset of the Orosei 2 sub-complex without triggering any sudden, evident change in small mammals, least of all in Prolagus,
which increases its BM throughout Pleistocene. This fact apparently contradicts van der Geer et al. (2013) who noticed that the BS increase in insular small mammals that occurs following colonization or first appearance, ceases or is reversed after the arrival of mammalian predators or competitors. Probably the impact of a new predator was not so catastrophic because, contrarily to other islands, several carnivores were already present in Sardinia prior to Cynotherium (i.e. Chasmaporthetes, Mustela and Pannonictis; the latter also coexisted with Cynotherium
for a while). In fact, due to its large area, Sardin-ia had selective regimes more similar to mainland than other Mediterranean islands. It could support the presence of terrestrial predators and had not a strong resource limitation as small islands (Heaney 1978, 1984). Thus, we can not affirm that the arrival of Cynotherium sardoum increased the extrinsic
mor-tality of Sardinian pikas.
The most important cause of the turnover at the onset of the Dragonara subcomplex, and thus the trigger of the transition P. figaro-P. sardus is likely
to be climate change, in particular those related to the mid-Pleistocene Transition. Even after Middle Pleistocene, the evolution of P. sardus seem related
to climate changes and to consequent specific mod-ifications of the environment. Preliminary data by Boldrini & Palombo (2010) suggested a correlation between limb length and temperature in P. sardus.
Effects of climate on BS have been highlighted in insular endemic fossil vertebrates of the Mediter-ranean by van der Geer et al. (2013), according to whom BS fluctuates over time linked to climatic oscillation. Also Millien & Damuth (2004) noticed the influence of geographical climatic gradients and climatic change through time on fossil endemic in-sular species.
Regarding the extinction of Sardinian Prola-gus, it probably occurred less than 2000 years ago,
in the Roman period, between the arrival of Rattus rattus and the present time (Vigne 1982). Authors
do not agree on the importance of men’s influence (directly by predation and indirectly by introduction of alien predators, competitors, parasites, infectious diseases, modification of the landscape by agricul-tural activities, among others) to the extinction of
Prolagus.
Insular endemic lagomorphs and the Is-land Rule. Radical morpho-dimensional
adapta-tions are observed in insular endemic organisms. In mammals, apart from modifications in dental, crani-al and limbs morphology and relative proportions, it is observed a BS trend coined as Island Rule (Fos-ter 1964; Van Valen 1973): in general small-sized mammals considerably increase their size, whereas large-sized mammals show an opposite trend. This ecogeographic rule is also observed in insular en-demic fossil mammals. In the Neogene-Quaternary of Mediterranean islands and palaeoislands, insular gigantism and dwarfism have been the subject of several studies and debates (from the pioneer gen-eral studies, e.g. Vaufrey 1929; Thaler 1973; Sondaar 1977; Azzaroli 1982; to the most recent reviews, e.g. van der Geer et al. 2010; Lomolino et al. 2013 and references therein).
Lagomorphs are usually considered as small mammals together with rodents and insectivores. Although they have a larger size than the average of the small mammals, this order is far from reaching the size of the great majority of large mammals (e.g. elephants, rhinos, etc.). Their medium or interme-diate BM undertakes a key position in ecosystems (Valverde 1964) and compromises their response (adaptation) to island environments (Island Rule). Actually in extant endemic insular leporids the BM trend reported in literature is variable, but mostly di-rected towards a reduction of the size (Foster 1963, 1964; Lawlor 1982; Palacios & Fernández 1992; Tomida & Otsuka 1993). In the case of ochotonids, no extant species are present on islands and their trend is unknown.
When we deal with insular endemic fossil lagomorphs, it is not easy to determine their actual BM and its relative variation compared to the con-tinental ancestor. This is consequence of two facts: 1) mainly most remains consist in teeth, whose size, at least in lagomorphs, does not directly reflect BM (see above and Moncunill-Solé et al. 2015); and 2) the supposed ancestor is often unknown or wrongly identified (e.g. P. sardus from P. michauxi and
Gymne-sicolagus gelaberti from P. crusafonti in Lomolino et al.
2013 and van der Geer et al. 2013). A reliable BS estimation is available for an insular endemic fossil leporid, Nuralagus rex (Pliocene of Menorca, Spain),
which BM has been calculated in 8 kg (Moncunill-Solé et al. 2015, who reconsidered the BM estima-tion of 12 kg by Quintana et al. 2011). Even if not quantifiable, the size increase with respect to its supposed continental ancestor, the relatively small-sized genus Alilepus, should have been quite
remark-able.
For Prolagus species it is not possible to
quan-tify exactly the relative BM increase of insular en-demic vs their mainland ancestors. In the case of Sardinian Prolagus, this is due to the lack of studies
of postcranial remains of P. sorbinii, whereas in the
case of Apulian Prolagus, their continental
ances-tor is not known yet (Angelone 2007; Angelone & Čermák 2015; Angelone et al. 2015). Nevertheless, we can have a gauge of the BM difference between endemic insular Prolagus and continental species
tak-ing into consideration the only available BM datum of a continental Prolagus, i.e. the BM of P. cf. calpen-sis from the Late Pliocene of Spain, estimated in ca
320 g (based on average of femurs and tibiae; Mon-cunill-Solé et al. 2015). Thus, P. figaro from Monte
Tuttavista X3 had a noticeably larger BM (ca 25%) than an almost coeval western European mainland
Prolagus. One among the oldest known populations
of P. apricenicus (Cava Fina F1; BM = ca 282 g;
Mon-cunill-Solé et al. in press) had a BM ca 13% smaller than P. cf. calpensis, not because it decreased its size
in an insular domain, but probably because the con-tinental ancestor of Apulian Prolagus was a
pre-Mes-sinian, medium-sized species (see Angelone 2007; Angelone & Čermák 2015). Later populations of
P. apricenicus, weighing ca 601 g (Moncunill-Solé et
al. 2015), almost doubled the BM of P. cf. calpensis.
The known average BM range of both Sar-dinian species of Prolagus (397.88-525.05 g; a BM of
800 g for Mesolithic P. sardus inferred by Sondaar &
van der Geer (2000) on a qualitative basis has to be verified) is smaller than the populations of P. aprice-nicus, whose BM range is ca 280-600 g
(Moncunill-Solé et al. 2015, in press). The other Apulian spe-cies, P. imperialis, is traditionally considered gigantic,
because it has the largest p3. However, our analyses and results make clear that dental remains do not di-rectly reflect actual BM, and sometimes even coun-tertrend postcranial-based results. Pending a study
of postcranial remains of P. imperialis, we refrain to
make inferences about its BM.
Millien (2011) argued that in smaller islands the evolutionary rate is higher. This possibly ex-plains the explosive BM increase of P. apricenicus,
confined to a very limited, fragmented area, in con-trast to the P. figaro-P. sardus trend, which lived in a
larger island.
In general, the scanty available quantitative data indicate that both fossil leporids and ochoto-nids follow the small mammal Island Rule pattern. They underwent a BM increase which extent is highly variable, though. This trend is not in line with the variable response observed in extant insular en-demic leporids (see above).
BM and life history of insular endemic
Prolagus. In the last twenty years, several researches have been focused on the life history of insular fos-sil species, principally addressed to dwarfism (Bro-mage et al. 2002; Raia et al. 2003; Raia & Meiri 2006; Köhler 2010; Kubo et al. 2011; Marín-Moratalla et al. 2011; Jordana et al. 2012, 2013; van der Geer et al. 2014) although, newly, investigations regarding gi-gantism have been performed (Moncunill-Solé et al. in press; Orlandi-Oliveras et al. in press). BM scales with several traits of the life history of species such as life span, fecundity, age at maturity, among others (Blueweiss et al. 1978; Peters 1983; Calder 1984). For this reason, at first sight, we could think in pre-dicting some of these life history traits for P. figaro
and P. sardus using the BM results of our analysis.
However, Moncunill-Solé et al. (in press) analyzed the histology and BM of one of the Apulian insular endemic species of Prolagus (P. apricenicus) and
sug-gested that it had a slower life history than expected from its BS. Histologically, the longevity is estimat-ed of at least 7 years for P. apricenicus from F1 fissure
filling contrasting with the 4.5 years expected from its BS (around 300 g). The selective regimes of in-sular habitats (low levels of extrinsic mortality and resource limitation) are the most probable triggers of this shift (Palkovacs 2003). This is also observed in extant ochotonids (Ochotona spp.) that dwell in
rocky habitats which are subjected to a low aver-age yearly mortality. They show a slower life history (later age at maturity and longer longevity) than the species of Ochotona that live in meadows, although
both groups do not have steep differences in BM (Smith 1988).
Taking in consideration of the aforemen-tioned, extant and extinct relative species that dwell in habitats with low levels of extrinsic mortal-ity show a slower life history than expected from their BS. In the case of P. figaro and P. sardus the
levels of extrinsic mortality may not be as low as in the case of P. apricenicus from Gargano consequence
of the presence of predators. However, the ecologi-cal selective regimes of Sardinia would not be like the mainland’s one. For this reason, the prediction of life history traits and other biological attributes using the estimated BM should be considered with caution. Probably, we would underestimate the val-ues of these traits. The absence of histological data of extant and extinct ochotonids encourages the studies focused on this field in order to improve the biological knowledge of insular and mainland lago-morphs.
c
onclusIonsBMs were estimated for P. figaro from X3 (397.88 g), IVm (406.37 g) and X4 (435.74 g); and for P. sardus from XIr (503.86) and VI6 (525.05 g). These results allow us to state a significant in-crease of BM of the species Prolagus from Sardinia throughout the Pleistocene. The best measure-ments for determining the BM of Prolagus are FL, TAPDp, TTDp, TTDd and HTDd. In contrast, HAPDp and FTDp appear to be unreliable prox-ies. The BM increase opposes to the pattern of the Lp3, which shows a drastic drop at the transition between P. figaro and P. sardus. This is due to the fact that teeth are not weight-bearing elements, and thus, their use as BM proxies is not recommended. However, when the teeth dimensions are taken into account, the biphasic Mein’s model (tachytelic and bradytelic stages) may be observed twice. This can-not be confirmed with BM estimations due to the absence of postcranial elements in some key sites as CMd1 (P. aff. figaro) and IV5 (oldest known popula-tion of P. sardus). The entrance of Cynotherium and the presence of other species of carnivores during the Pleistocene seem to not have influence on the pattern of adaption to insular ecological regimes of Prolagus.
Currently, the absence of ochotonids on is-lands does not allow us to know the adaptions of this group to insular ecological regimes (Island Rule). In
the fossil record, the two species of Prolagus studied in our research and one of the two endemic insular Apulian species (P. apricenicus) suggest a gigantism pattern for ochotonids. However, this latter species shows a more explosive increase of BM perhaps as a result that it dwelled in a smaller, fragmented area. It is observed in extant and extinct species that the environments with a lower extrinsic mortality can promote a lower life history (e.g. greater longevity than that expected for its BM). Thus, the estima-tions of life history traits taking into account the BM results of our research should be considered with caution.
Acknowledgements. We are grateful to the firms that perform
quarrying activities at Monte Tuttavista for their kind collaboration; to M. Asole, P. Catte, A. Fancello, G. Mercuriu, G. Puligheddu, A. Useli for the careful work of preparation of the analyzed fossils; to M.A. Fadda and the Superintendents F. Lo Schiavo and F. Nicosia of the Soprintendenza Archeologica della Sardegna who allowed the study of the material analyzed in this paper; to T. Kotsakis, M.R. Palombo and to the reviewers S. Čermák, X. Jordana, and J. Quin-tana, and to the editor L. Rook for their useful remarks. This research was supported by the Spanish Ministry of Education, Culture and Sport (AP2010−2393, B.M-S.).
references
Abbazzi L., Angelone C., Arca M., Barisone G., Bedetti C., Delfino M., Kotsakis T., Marcolini F., Palombo M.R., Pavia M., Piras P., Rook L., Torre D., Tuveri N., Valli A. & Wilkens B. (2004) - Plio-Pleistocene fossil vertebrates of Monte Tuttavista (Orosei, E. Sardinia, Italy): an over-view. Riv. It. Paleont. Strat., 110: 681-706.
Alcover J.A., Moyà-Solà S. & Pons-Moyà J. (1981) - Les qui-meres del passat: els vertebrats fòssils del Plio-Quater-nari de les Balears i Pitiüses. Editorial Moll, Ciutat de Mallorca, 260 pp.
Angelone C. (2005) - Evolutionary trends in dental morphol-ogy of the genus Prolagus (Ochotonidae, Lagomorpha) in the Mediterranean Islands. In: Alcover J.A.& Bover P. (Eds) - Proceedings of the International Symposium Insular Vertebrate Evolution: the Paleontological Ap-proach. Mon. Soc. Hist. Nat. Balears: 17-26, Mallorca. Angelone C. (2007) - Messinian Prolagus (Ochotonidae,
Lago-morpha, Mammalia) of Italy. Geobios, 40: 407-421. Angelone C. & Čermak S. (2015) - Two new species of
Prola-gus (Lagomorpha, Mammalia) from the Late Miocene of Hungary: taxonomy, biochronology and palaeobiogeog-raphy. Paläontol. Z., 89(4): 1023-1038.
Angelone C., Čermak S. & Kotsakis T. (2015) - The most an-cient lagomorphs of Sardinia: an overview. Geobios, 48: 287-296.
Angelone C. & Kotsakis T. (2001) - Rhagapodemus azzarolii n. sp. (Muridae, Rodentia) from the Pliocene of Mandriola
(Western Sardinia, Italy). Boll. Soc. Paleont. It., 40: 127-32. Angelone C., Tuveri C. & Arca M. (2009) - Biocronologia del
Plio-Pleistocene sardo: il contributo degli ochotonidi (Lagomorpha, Mammalia). Abstr. “IX Giornate di Paleon-tologia”, 5, Apricena.
Angelone C., Tuveri C., Arca C., López Martínez N. & Kot-sakis T. (2008) - Evolution of Prolagus sardus (Ochotoni-dae, Lagomorpha) in the Quaternary of Sardinia island (Italy). Quat. Int., 182: 109-115.
Azzaroli A. (1982) - Insularity and its effects on terrestrial vertebrates: evolutionary and biogeographic aspects. In: Montanaro Gallitelli E. (Ed.) - Palaeontology, Essential of Historical Geology: 193-213. Edizioni S.T.E.M. Muc-chi, Modena.
Blueweiss L., Fox H., Hudzma V., Nakashima D., Peters R. & Sams S. (1978) - Relationships between body size and some life history parameters. Oecol., 37: 257-272. Boldrini R. & Palombo M.R. (2010) - Did temperature
regu-late limb length in the Sardinian endemic ochotonid Pro-lagus sardus? Abstr. “Convegno in memoria di Alberto Malatesta (1915-2007), geologo e paleontologo”: 12-13, Roma.
Bromage T.G., Dirks W., Erdjument-Bromage H., Huck M., Kulmer O., Öner R., Sandrock O. & Schrenk F. (2002) - A life history and climate change solution to the evolu-tion and extincevolu-tion of insular dwarfs: acypriotic experi-ence. In: Waldren W.H. & Ensenyat J.A. (Eds) - World Islands in Prehistory. International Insular Investiga-tions, V Deia International Conference of Prehistory: 420-427. Archaeopress, Oxford.
Brockhurst M.A., Chapman T., King K.C., Mank J.E., Pater-son S. & Hurst D.H.H. (2014) - Running with the Red Queen: the role of the biotic conflicts in evolution. Proc. Roy. Soc. B, 281: 20141382.
Calder W.A. III (1984) - Size, function, and life history. Dover Publications Inc., New York, 431 pp.
Damuth J. & MacFadden B.J. (1990) - Body size in mammalian paleobiology. Estimations and biological implications. Cambridge University Press, Cambridge, 397 pp. Evans A.R., Jones D., Boyer A.G., Brown J.H., Costa D.P.,
Er-nest S.K.M., Fitzgerald E.M.G., Fortelius M., Gittleman J.L., Hamilton M.J., Harding L.E., Lintulaakso K., Lyons S.K., Okie J.G., Saarinen J.J., Sibly R.M., Smith F.A., Ste-phens P.R., Theodor J.M. & Uhen M.D. (2012) - The maximum rate of mammal evolution. Proc. Natl. Acad. Sciences USA, 109: 4187-4190.
Foster J.B. (1963) - The evolution of native land mammals of the Queen Charlotte Islands and the problem of insu-larity. PhD Thesis, University of Columbia, Vancouver. Foster J.B. (1964) - Evolution of mammals on islands. Nature,
202: 234-235.
Gingerich P.D., Smith B.H. & Rosenberg K. (1982) - Allome-tric scaling in the dentition of primates and prediction of body weight from tooth size in fossils. Am. J. Phys. Anthropol., 58: 81-100.
Heaney L.R. (1978) - Island area and body size of insular mammals: evidence from the tri-colored squirrel (Cal-losciurus prevosti) of Southeast Asia. Evolution, 32: 29-44.
Heaney L.R. (1984) - Mammalian species richness on islands on the Sunda Shelf, Southeast Asia. Oecol., 61: 11-17. Jordana X., Marín-Moratalla N., De Miguel D., Kaiser T.M.
& Köhler M. (2012) - Evidence of correlated evolution of hypsodonty and exceptional longevity in endemic in-sular mammals. Proc. R. Soc. Biol. Sci., Ser. B, 279: 3339-3346.
Jordana X., Marín-Moratalla N., Moncunill-Solé B., Bover P., Alcover J.A. & Köhler M. (2013) - First fossil evidence for the advance of replacement teeth coupled with life history evolution along an anagenetic mammalian lin-eage. PLoS ONE, 8: e70743.
Köhler M. (2010) - Fast or slow? The evolution of life history traits associated with insular dwarfing. In: Pérez-Mellado V. & Ramon C. (Eds) - Islands and Evolution: 261-280. Institut Menorquí d’Estudis, Maó, Menorca.
Kubo M.O., Fujita M., Matsu’ura S., Kondo M. & Suwa G. (2011) - Mortality profiles of Late Pleistocene deer re-mains of Okinawa Island: evidence from the Hananda-Gama cave and Yamashita-cho cave I sites. Anthropol. Sci., 119: 183-201.
Lawlor T.E. (1982) - The evolution of body size in mammals: evidence from insular populations in Mexico. Am. Nat., 119: 54-72.
Lister A.M. (1989) - Rapid dwarfing of red deer on Jersey in the Last Interglacial. Nature, 342: 539-542.
Lister A.M. (1996) - Dwarfing in island elephants and deer: processes in relation to time of isolation. Symp. Zool. Soc. London, 69: 277-292.
Lomolino M.V., van der Geer A.A.E., Lyras G.A., Palombo M.R., Sax D.F. & Rozzi R. (2013) - Of mice and mam-moths: generality and antiquity of the island rule. J. Bio-geogr., 40: 1427-1439.
Lyras G, Van der Geer A.A.E, Dermitzakis M.D. & De Vos J. (2006) - Cynotherium sardous, an insular canid (Mammalia: Carnivora) from the Pleistocene of Sardinia, and its ori-gin. J. Vert. Paleont., 26: 735-745.
Lyras G, Van der Geer A.A.E. & Rook L. (2010) - Body size of insular carnivores: evidence from the fossil record. J. Biogeogr., 37: 1007-1021.
Marín-Moratalla N., Jordana X., García-Martínez R. & Köhler M. (2011) - Tracing the evolution of fitness components in fossil bovids under different selective regimes. C. R. Palevol, 10: 469-478.
Masini F., Petruso D., Bonfiglio L. & Mangano G. (2008) - Origination and extinction patterns of mammals in three central Western Mediterranean island form the Late Miocene to Quaternary. Quat. Int., 182: 63-79. Mein P. (1983) - Particularités de l’évolution insulaire chez les
petits Mammifères. Coll. Int. C.N.R.S., 330: 189-193. Millien V. (2006) - Morphological evolution is accelerated
among island mammals. PLoS Biol., 4(10): e321.
Millien V. (2011) - Mammals evolve faster in smaller areas. Evolution, 65(7): 1935-1944.
Millien V. & Damuth J. (2004) - Climate change and size evolu-tion in an island rodent species: new perspectives on the Island Rule. Evolution, 58(6): 1353-1360.
Millien V. & Jaeger J-J. (2001) - Size evolution of the lower
incisor of Microtia, a genus of endemic murine rodents from the late Neogene of Gargano, southern Italy. Paleo-biology, 27: 379-391.
Moncunill-Solé B., Orlandi-Oliveras G., Jordana X., Rook L. & Köhler M. (in press) - First approach of the life his-tory of Prolagus apricenicus (Ochotonidae, Lagomorpha) from Terre Rosse sites (Gargano, Italy) using body mass estimation and paleohistological analysis. C. R. Palevol., http://dx.doi.org/10.1016/j.crpv.2015.04.004.
Moncunill-Solé B., Quintana J., Jordana X., Engelbrektsson P. & Köhler M. (2015) - The weight of fossil leporids and ochotonids: body mass estimation models for the order Lagomorpha. J. Zool., 295: 269-278.
Nowak R.M. (1999) - Walker’s Mammals of the World Volume II. Johns Hopkins University Press, Baltimore, 2015 pp. Orlandi-Oliveras G., Jordana X., Moncunill-Solé B.& Köhler
M. (in press) - Bone histology of the giant fossil dor-mouse Hypnomys onicensis (Gliridae, Rodentia) from Bale-aric Islands. C. R. Palevol. http://dx.doi.org/10.1016/j. crpv.2015.05.001.
Palacios F. & Fernández J. (1992) - A new subspecies of hare from Majorca (Balearic Islands). Mammalia, 56: 71-85. Palombo M.R. (2009a) - Body size structure of Pleistocene
mammalian communities: what support is there for the “island rule”? Integr. Zool., 4: 341-356.
Palombo M.R. (2009b) - Biochronology, palaeobiogeography and faunal turnover in western Mediterranean Cenozoic mammals. Integr. Zool., 4: 367-386.
Peters R.H. (1983) - The ecological implications of body size. Cambridge University Press, Cambridge, 329 pp. Quinn G.P. & Keough M.J. (2002) - Experimental design and
data analysis for biologists. Cambridge University Press, New York, 537 pp.
Quintana Cardona J. (2005) - Estudio morfológico y funcional de Nuralagus rex (Mammalia, Lagomopha, Leporidae). Unpublished PhD thesis, Universitat Autònoma de Bar-celona.
Quintana J., Köhler M. & Moyà-Solà S. (2011) - Nuralagus rex, gen. et sp. nov., an endemic insular giant rabbit from the Neogene of Minorca (Balearic Islands, Spain). J. Vert. Paleontol., 31: 231-240.
Raia P., Barbera C. & Conte M. (2003) - The fast life of a dwarfed giant. Evol. Ecol., 17: 293-312.
Raia P. & Meiri S. (2006) - The island rule in large mammals: paleontology meets ecology. Evolution, 60: 1731-1742. Reynolds P.S. (2002) - How big is a giant? The importance of
method in estimating body size of extinct mammals. J. Mammal., 83: 321-332.
Samuels J.X. & Valkenburgh B.V. (2008) - Skeletal indicators of locomotor adaptations in living and extinct rodents. J. Morphol., 269: 1387-1411.
Scott K.M. (1990) - Postcranial dimensions of ungulates as predictors of body mass. In: Damuth J. & MacFadden B.J. (Eds) - Body size in mammalian paleobiology: esti-mation and biological implications: 301-305. Cambridge University Press, Cambridge.
Smith A.T. (1988) - Patterns of pika (genus Ochotona) life his-tory variation. In: Boyce M.S. (Ed.) - Evolution of Life
Histories: Theory and Patterns from Mammals: 233-256. Yale University Press, New Haven.
Sondaar P.Y. (1977) - Insularity and its effect on mammal evo-lution. In: Hecht M.K., Goody P.C. & Hecht B.M. (Eds) - Major patterns in vertebrate evolution: 671-707. Ple-num Publishing Corporation, New York.
Sondaar P.Y. & van der Geer A.A.E. (2000) - Mesolithic envi-ronment and animal exploitation on Cyprus and Sardin-ia/Corsica. In: Mashkour M., Choyke A.M., Buitenhuis H. & Poplin F. (Eds) - Archaeozoology of the Near East IVA: 67-73. ARC Publications 32, Groningen.
Thaler L. (1973) - Nanisme et gigantisme insulaires. La Re-cherche, 37: 741-750.
Tomida Y. & Otsuka H. (1993) - First Discovery of Fossil Amami Rabbit (Pentalagus furnessi) from Tokunoshima, Southwestern Japan. Bull. Nat. Sci. Mus. Tokyo, Ser. C, 19: 73-79.
Tukey J.W. (1977) - Exploratory Data Analysis. Addison-Wes-ley, Boston, 688 pp.
Valverde J.A. (1964) - Estructura de una comunidad de verteb-rados terrestres. Mon. Est. Biol. Doñana, 1: 1-129. van der Geer A.A.E., de Vos J., Dermitzakis M. & Lyras G.
(2010) - Evolution of Island Mammals: Adaptation and Extinction of Placental Mammals on Islands. Wiley-Blackwell, Oxford, 496 pp.
van der Geer A.A.E., Lyras G.A., Lomolino M.V., Palombo M.R. & Sax D.F. (2013) - Body size evolution of palaeo-insular mammals: temporal variations and interspecific interactions. J. Biogeogr., 40: 1440-1450.
van der Geer A.A.E., Lyras G., MacPhee R.D.E., Lomolino M. & Drinia H. (2014) - Mortality in a predator-free insular environment: the dwarf deer of Crete. Am. Mus. Novit., 3807: 1-26.
Van Valen L. (1973) - Pattern and the balance of nature. Evol. Theory, 1: 31-49.
Vaufrey R. (1929) - Les éléphants nains des îles mèditerra-néennes et la question des isthmes pléistocènes. Arch. Inst. Pal. Hum., 6: 1-220.
Vigne, J.-D. (1982) - Zooarchaeology and the biogeographical history of the mammals of Corsica and Sardinia since the last ice age. Mammal Rev., 22: 87-96.
Vigne J.D. & Valladas H. (1996) - Small mammal fossil assem-blages as indicators of environmental change in north-ern Corsica during the last 2500 Years. J. Archaeol. Sci., 23: 199-215.
Wilkens B. (2004) - La fauna sarda durante l’Olocene: le co-noscenze attuali. Sard. Cors. Bal. Antiquae, 1: 181-197.