Volume 2012, Article ID 461784,7pages doi:10.1155/2012/461784
Research Article
Correlations among PPAR
γ, DNMT1, and DNMT3B Expression
Levels and Pancreatic Cancer
Valerio Pazienza,
1Francesca Tavano,
2Giorgia Benegiamo,
1Manlio Vinciguerra,
3Francesca Paola Burbaci,
2Massimiliano Copetti,
4Fabio Francesco di Mola,
2Angelo Andriulli,
1and Pierluigi di Sebastiano
21Division and Laboratory of Gastroenterology Unit, “Casa Sollievo della Sofferenza” IRCCS Hospital, Viale dei Cappuccini n.1,
71013 San Giovanni Rotondo, Italy
2Division of Abdominal Surgery, “Casa Sollievo della Sofferenza” IRCCS Hospital, 71013 San Giovanni Rotondo, Italy 3The Foundation for Liver Research, c/o The Institute of Hepatology, 69-75 Chenies Mews,
London WC1E 6HX, UK
4Biostatistic Unit, “Casa Sollievo della Sofferenza” IRCCS Hospital, 71013 San Giovanni Rotondo, Italy
Correspondence should be addressed to Valerio Pazienza,[email protected] Received 7 June 2012; Accepted 13 June 2012
Academic Editor: Gianluigi Mazzoccoli
Copyright © 2012 Valerio Pazienza et al. This is an open access article distributed under the Creative Commons Attribution License, which permits unrestricted use, distribution, and reproduction in any medium, provided the original work is properly cited.
Emerging evidence indicates that peroxisome proliferator-activated receptorγ (PPARγ) and DNA methyltransferases (DNMTs) play a role in carcinogenesis. In this study we aimed to evaluate the expression of PPARγ, DNMT1, and DNMT3B and their correlation with clinical-pathological features in patients with pancreatic cancer (PC), and to define the effect of PPARγ activation on DNMTs expression in PC cell lines. qRT-PCR analysis showed that DNMT3B expression was downregulated in tumors compared to normal tissues (P =0.03), whereas PPARγ and DNMT1 levels did not show significant alterations in PC patients. Expression levels between PPARγ and DNMT1 and between DNMT1 and DNMT3B were highly correlated (P = 0.008 and P=0.05 resp.). DNMT3B overexpression in tumor tissue was positively correlated with both lymph nodes spreading (P=0.046) and resection margin status (P=0.04), and a borderline association with perineural invasion (P=0.06) was found. Furthermore, high levels of DNMT3B expression were significantly associated with a lower mortality in the whole population (HR=0.485; 95% CI=0.262–0.895, P=0.02) and in the subgroup of patients without perineural invasion (HR=0.314; 95%CI=0.130–0.758; P =0.01), while such association was not observed in patients with tumor invasion into perineural structures (P =0.70). In conclusion, in vitro and in vivo PPARγ and DNMTs appear interrelated in PC, and this interaction might influence cell phenotype and disease behavior.
1. Introduction
Pancreatic cancer (PC) is ranked as the fourth leading cause of cancer-related deaths worldwide [1,2]. It is highly aggressive and resistant to chemotherapy, and our inability to detect it at an early stage and the lack of effective systemic therapies are responsible for nearly identical incidence and mortality rates [3, 4]. More effective treatments and/or development of novel strategies are needed to improve the prognosis for patients with PC.
The peroxisome proliferator-activated receptors (PPARs) belong to the nuclear receptor superfamily and are con-sidered master regulators of lipid and glucose metabolism
by transducing metabolic and nutritional signals into tran-scriptional responses [5, 6]. Three subtypes of PPARs are known: PPARα, PPARδ, and PPARγ [7]. The latter has been implicated in the pathology of numerous diseases including obesity, diabetes, atherosclerosis, and cancer. PPARγ ligands induce differentiation of liposarcoma cells and have a variety of antitumor effects also in pancreatic cancer cells [8]. The availability of such high-affinity ligands has facilitated the study of the signalling pathways through which PPARγ regulates metabolic processes, which are regulated also by epigenetic events. The mechanisms underlying epigenetic modulation mediated by PPARs remain to be fully explored. DNA methyltransferases (DNMTs) are critical in epigenetic
Table 1: Clinical and pathological features of patients with pancreatic ductal adenocarcinoma (PDAC).
PDAC n=30 Age at diagnosis, median (Q1–Q3) 69 (42–81) Duration of followup, median (Q1–Q3) 18.48 (8.16–53.11) Gender, male/female (% male) 25/5 (83) Tumour localization,n (%) Head 28 (93) Body-tail 2 (7) Tumour type,n (%) Adenocarcinoma 24 (80) Adenocarcinoma mucinous 6 (20) Tumour grading,n (%) G1: well differentiated 4 (13) G2: moderately differentiated 16 (54) G3: poorly differentiated 10 (33) T: tumour size,n (%) T2 5 (17) T3 25 (83)
N: regional lymph nodes,n (%)
N0 7 (23)
N1 23 (77)
Lymph nodes ratio, median (Q1–Q3) 0.13 (0.00–0.80) Tumour stage,n (%)
IIA 7 (23)
IIB 23 (77)
Perineural invasion,y/n (%y) 9/21 (30) Margins of resection ,n (%)
R0: negative rection margins 22 (27)
R1: microscopic positive resection margins 8 (73) Pancreatic cancer staging. “Exocrine and endocrine pancreas,” in [25].
events through the addition of methyl groups to DNA [9,10]. Maintenance of methylation pattern is achieved by DNMT1 function [11] during DNA replication while new or de novo methylation is primarily catalyzed by DNMT3a and DNMT3b [12]. Whether and how PPARs modulate epigenetic events remain to be fully explored. In this paper, we sought to examine mRNA levels of PPARγ and DNMT1 and 3B in a cohort of PC patients and to correlate the findings with clinical-pathologic features, including patient survival, and to evaluate whether pharmacological modulation of PPARγ could influence the expression of DNMTs in PC cell lines.
2. Material and Methods
2.1. Patients and Tissues Samples Preparation. A cohort of 30 matched pairs of tumour and adjacent normal tissue samples were collected from patients undergoing pancreatic resection at the Department of Surgery, “Casa Sollievo della Sofferenza” Hospital, IRCCS, San Giovanni Rotondo, Italy
0.01 0.1 1 10 100 1000 R elati ve and nor maliz ed mRN A e xpr ession le ve l DNMT1 DNMT3B PPARγ
Figure 1: PPARγ, DNMT1, and DNMT3b mRNA expression levels in tissues from 30 patients with pancreatic ductal Adenocarcinoma (PDAC). Each blot indicates the relative expression of genes in tumour compared to normal tissue, after normalization to the endogenous GAPDH. Values greater than 1 indicate gene overexpression in inflamed tissue. For each gene, the median expression levels observed in patients group were indicated by the horizontal black bars. Relative expression values are reported in log scale (y-axis). 1 10 100 1000 0.01 0.1 DNMT3B r elati ve e xpr ession le ve l IP YES IP NO
Figure 2: Association of DNMT3b expression levels with perineural invasion (IP) in patients with pancreatic ductal adenocarcinoma (PDAC). Patients were stratified according to IP status (No versus Yes). Each box highlights median, interquartile range (Q1–Q3) and lower and upper adjacent values (vertical bars) for each subjects group. The upper and lower boundaries of the boxes define the quartiles, 75% and 25% percentiles, respectively, and the black bar represents the median value. Relative expression values are reported in log scale (y-axis).
between October 2007 and June 2011. Written informed con-sent was obtained before collection of tissues from patients. The final diagnosis of pancreatic ductal adenocarcinoma was ascertained in all patients by histological examinations. At the last followup, 18 (60%) patients were still alive and 12 (40%) patients had died. Demographics and clinical characteristics of patients are shown inTable 1.
Tissue specimens were immediately frozen in liquid nitrogen, and stored at−80◦C until RNA extraction. Cancer
1 10 100 1000 0.01 0.1 DNMT3B r elati ve e xpr ession le ve l R0 R1
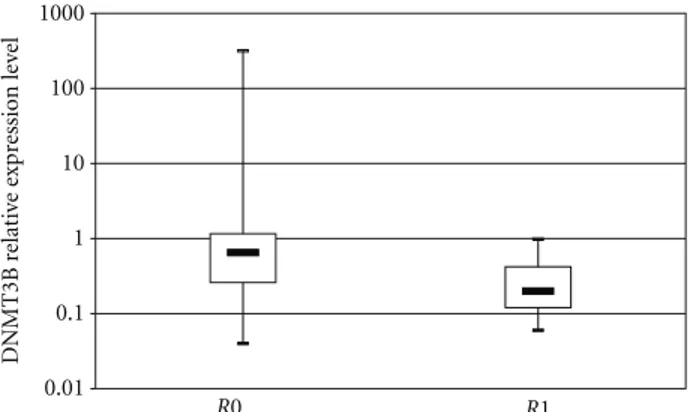
Figure 3: Association of DNMT3b expression levels with resec-tion margins in patients with pancreatic ductal adenocarcinoma (PDAC). Patients were stratified according to resection margin status (R0 versus R1). Each box highlights median, interquartile range (Q1–Q3) and lower and upper adjacent values (vertical bars) for each subjects group. The upper and lower boundaries of the boxes define the quartiles, 75% and 25% percentiles, respectively, and the black bar represents the median value. Relative expression values are reported in log scale (y-axis).
0.8 0.6 0.4 0.2 0 0 1 Time 6 12 18 24 30 36 Su rv iv al dist ri bution function
“Low DNMT3 level and not invasivity” “High DNMT3 level and not invasivity” “Low DNMT3 level and invasivity” “High DNMT3 level and invasivity”
Figure 4
cellularity was enriched by cryostat sectioning and dissection of most cellular areas.
2.2. Cell Culture and Treatment. BxPC3, CF-PAC, MiaPaca, and Panc1 cells were cultured at 37◦C in 5% CO2atmosphere
in DMEM medium supplemented with 10% fetal bovine serum (FBS), 100 U/mL penicillin and 100 ng/mL strep-tomycin (Invitrogen Life Technologies, Milan, Italy) while CFPAC and MiaPaca were maintained in RPMI medium (Invitrogen Life Technologies, Milan, Italy). Treatment with rosiglitazone (purchased from Cayman Chemicals) was performed at different time points (24 hours and 48 hours) and at different concentration (5 μM and 15 μM).
2.3. Quantitative Real-Time PCR (qRT-PCR). Total RNA was extracted from 30 PC fresh frozen specimens and from different pancreatic cancer cells (BxPC3, CFPAC, MiaPaca, and Panc1) using the RNeasy Mini Kit (Qiagen S.P.A. Milano Italy) and subsequently digested by DNase I. cDNA was synthesized from 50 ng total RNA and quantitative real-time PCR was performed using QuantiFast Sybr Green PCR kit following the one-step protocol. For real-time RT-PCR, we used the following SYBR Green QuantiTect Primer pur-chased from Qiagen: human PPARγ (QT00029841) DNMT1 (QT00034335) and DNMT3B (QT00032067). Reactions were set up in 96-well plates using a 7700 real-time PCR System (Applied Biosystems, Foster City, CA) and all samples were assayed in triplicate. Optical data obtained were analyzed using the default and variable parameters available in the SDS software package (version 1.9.1; Applied Biosystems, Foster City, CA). Expression levels of target gene were normalized using the housekeeping control genes: TATA binding protein (TBP, QT00000721) as previously performed [14].
2.4. Statistics. Demographic, clinical, and genetic charac-teristics were reported as median and interquartile range (Q1–Q3). Gene expression up- or downregulation was tested by using the one-sample Wilcoxon signed-rank test. Group comparisons were performed using the Pearson, chi-square test and the Mann-Whitney U test for categorical and continuous variables, respectively. Correlations between continuous variables were assessed using the r Spearman coefficient. Time-to-death analyses were performed using Cox proportional hazards regression models and risks were reported as hazards ratios (HR) along with their 95% confidence intervals (95% CI). Overall survival was defined as the time elapsed between surgery and death. For subjects who did not experience the event, time variable was censored at the time of the last available follow-up time. In the time to death analysis, genes’ expressions were logarithm-transformed to respect Cox model’s linearity assumption. Kaplan-Meier curves were also reported for display purposes. All statistical analyses were performed using SAS version 9.1.3 (SAS Institute, Cary, NC, USA). As for cell experiments, results were expressed as means ± SD. For statistical comparison, significance was evaluated using the Studentt test. Values ofP < 0.05(∗) andP < 0.005(∗∗) orP < 0.001 (∗∗∗) were considered statistically significant.
3. Results
3.1. PPARγ, DNMT1 and 3B Expression in Pancreatic Cancer Biopsies. Relative expression levels of PPARγ, DNMT1, and DNMT3B mRNA in tissue samples from 30 PC patients are presented in Figure 1. Looking at median levels of gene expression in tumor compared to adjacent nontumor tissues, the DNMT3B mRNA expression was downregulated (median = 0.4, Q1–Q3 = 0.22–1.05, P = 0.03), while PPARγ and DNMT1 mRNA levels were not significantly altered (PPARγ: median = 0.98, Q1–Q3 = 0.41–1.8, P =
0 0.5 1 1.5 2 2.5 3 mRN A r elati ve e xpr ession
BxPC3 CFPAC PANC1 MiaPaca
PPARγ
∗∗∗ ∗ ∗∗
(a)
BxPC3 CFPAC PANC1 MiaPaca
0 0.2 0.4 0.6 0.8 1 1.2 1.4 DNMT1 ∗∗∗ ∗ ∗∗∗ (b)
BxPC3 CFPAC PANC1 MiaPaca
0 0.5 1 1.5 2 2.5 3 DNMT3b ∗∗∗ ∗∗ ∗∗ (c)
Figure 5: Quantitative real-time PCR. mRNA relative expression levels of PPARγ, DNMT1, and 3B in four different pancreatic cancer cell lines.
Analysis of the association among PPARγ, DNMT1, and DNMT3B mRNA levels showed that PPARγ expression levels were positively correlated with DNMT1 expression levels in PC patients (r = 0.48, P = 0.008), but not with DNMT3B expression levels (r = −0.20, P = 0.30). A significant correlation between DNMT1 and DNMT3B expression levels in patients with PC was observed, (r=0.36, P=0.053).
3.2. Correlation between PPARγ, DNMT1, and DNMT3B mRNA Levels with Clinical and Pathological Features. When PC patients were stratified according to their clinical phe-notypes, PPARγ expression levels were unrelated to the considered demographic and clinical features, and DNMT1 showed only a trend of increased expression towards tumors of lower grades of differentiation (G1: median = 0.55, Q1–Q3 = 0.45–0.57; G2: median = 0.87, Q1–Q3 = 0.62– 1.47; G3: median = 0.94, Q1–Q3 = 0.75–1.29; P = 0.06). Conversely, DNMT3B expression levels were associated with important prognostic variables in PC patients. In details, expression of DNMT3B in tumor tissues was directly related with lymph node ratio, expressed as total involved lymph nodes over total number of resected lymph nodes (r =
0.37, P =0.046). Furthermore, DNMT3B expression levels showed a borderline association with perineural invasion in PC patients: DNMT3B levels were higher in patients with evidence of perineural invasion (median = 0.98, Q1–Q3 = 0.67–1.07) than in those without tumor invasion into neural structures (median = 0.26, Q1–Q3 = 0.18–0.62),P = 0.06 (Figure 2). In addition, DNMT3B expression was higher in patients with resection margins free of tumor cells (R0: median = 0.65, Q1–Q3 = 0.26–1.16), than in those with evidence of tumor infiltration on resected margins (R1: median= 0.20, Q1–Q3 = 0.12–0.42),P=0.04 (Figure 3). 3.3. Survival Analysis. In the time-to-death analysis, DNM-T3B expression levels were logarithmic-transformed to accomplish with the linearity assumption of the Cox model. At univariate analysis of the 30 PC patients, DNMT3B high
expression levels were associated with lower mortality with an HR= 0.485 (95% CI = 0.262–0.895,P=0.02). In addition, a significant interaction between DNMT3B expression levels and perineural invasion was also observed (P = 0.05). In details, in the subgroup of 21 patients without evidence of perineural invasion high DNMT3B expression levels were related with longer survival (HR= 0.314; 95% CI = 0.130– 0.758;P=0.01). Conversely, such an effect was not observed in the subgroup of 9 patients with tumour invasion into perineural structures (HR = 0.879; 95%CI = 0.466–1.655; P=0.70) (Figure 4).
3.4. PPARγ, DNMT1, and 3b in Pancreatic Cancer Cell Lines. In order to corroborate previous findings, we then analyzed PPARγ, DNMT1, and 3B mRNA levels in four different pancreatic cancer cell lines. As shown inFigure 5, PANC-1 cells displayed higher levels of PPARγ as compared to the other cell lines, whilst CFPAC and MiaPaca cells presented lower mRNA levels of PPARγ. A similar pattern was observed for DNMT1 expression. DNMT3B display higher levels in CFPAC and PANC-1cells, while it was downregulated in BxPC3 and MiaPaca cells.
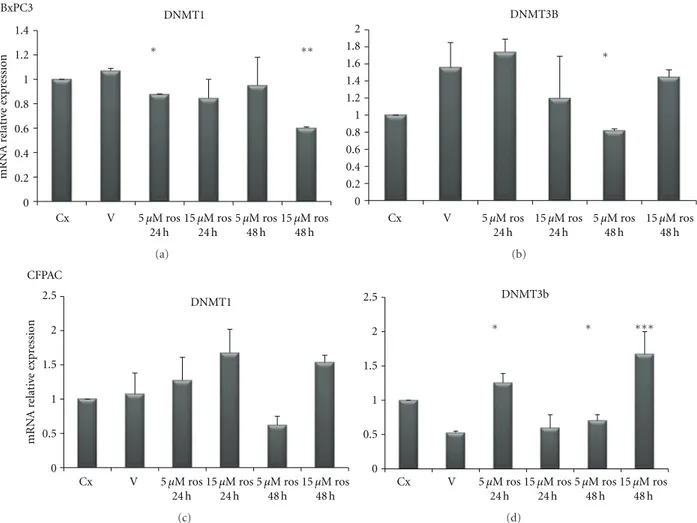
3.5. Effect of Rosiglitazone Treatment on DNMTs Expression in Pancreatic Cancer Cell Lines. In order to test whether PPARγ and DNMTs were correlated each other, we used a pharmacological approach by treating PC cells with rosigli-tazone (a PPARγ agonist): upon rosiglitazone challenge different expression patterns in different PC cell lines were observed. As shown in Figure 6, in BxPC3 cells rosiglita-zone treatment at 15μM concentration for 48 h decreased DNMT1 expression (P < 0.0001) while DNMT3B resulted downregulated after treatment with rosiglitazone at 5μM for 48 h as compared to vehicle treatment (P = 0.003). As for CFPAC cells (Figure 6), rosiglitazone challenge did not influence DNMT1 expression, whereas DNMT3B resulted increased upon treatment with rosiglitazone at 5μM for 24 h and for 48 h (P = 0.0007 and P = 0.03, resp.) and after treatment with rosiglitazone at 15μM for 48 h
Cx V 5 μM ros 24 h 5 μM ros 48 h 24 h 15 μM ros 48 h 15 μM ros 0 0.2 0.4 0.6 0.8 1 1.2 1.4 mRN A r elati ve e xpr ession BxPC3 DNMT1 ∗ ∗∗ (a) Cx V 5 μM ros 24 h 5 μM ros 48 h 24 h 15 μM ros 48 h 15 μM ros 0 0.2 0.4 0.6 0.8 1 1.2 1.4 1.6 1.8 2 DNMT3B ∗ (b) Cx V 5 μM ros 24 h 5 μM ros 48 h 24 h 15 μM ros 48 h 15 μM ros 0 0.5 1 1.5 2 2.5 mRN A r elati ve e xpr ession CFPAC DNMT1 (c) Cx V 5 μM ros 24 h 5 μM ros 48 h 24 h 15 μM ros 48 h 15 μM ros 0 0.5 1 1.5 2 2.5 DNMT3b ∗∗∗ ∗ ∗ (d)
Figure 6: Quantitative real-time PCR. mRNA relative expression levels of DNMT1 and 3B in BxPC3 and CFPAC pancreatic cancer cell lines upon treatment with rosiglitazone at the indicated concentrations and time points.
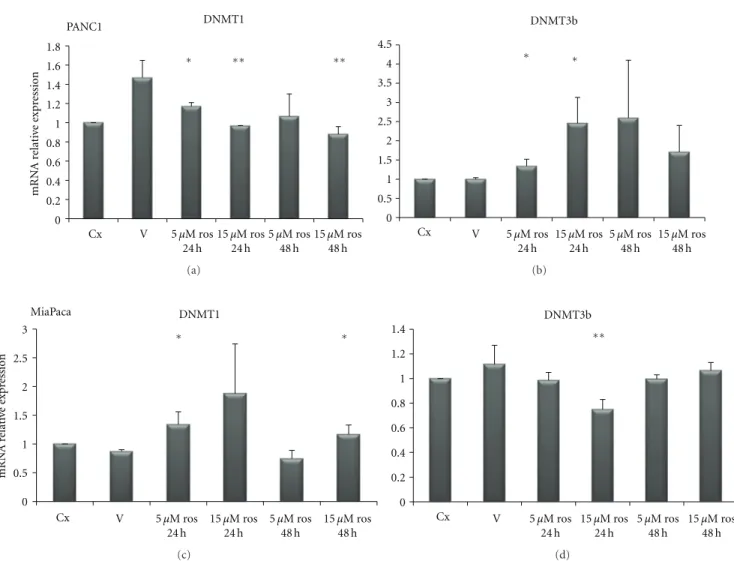
(P=0.03). In PANC1 cells (Figure 7) DNMT1 was decreased after rosiglitazone treatment at 5μM for 24 h (P=0.047) and 48 h (P =0.07), and at 15 μM for 24 h (P=0.008) and 48 h (P = 0.006). Regarding DNMT3B, rosiglitazone treatment induced a significant upregulation at 5μM and 15 μM for 24 h (P = 0.03 and P = 0.02) but not significant at 5 μM and 15μM for 48 h (P=0.139 and P=0.153 resp.).
As for MiaPaca cells (Figure 7), DNMT1 resulted increased after ros treatment at 5μM and 15 μM for 24 h (P=0.02 and P=0.039 resp.), but this overexpression was not evident after 48 h treatment 5μM (P =0.21) being still present after 48 h at 15μM concentration (P = 0.003). As for DNMT3B we observed a reduced expression after 48 h treatment with 5μM of rosiglitazone (P=0.02).
4. Discussion
Emerging evidence indicates that PPARγ plays a role in the pathogenesis of several pathological processes such as diabetes, obesity, atherosclerosis, and cancer [15]. Recent scientific reports suggest that the modulation of PPARγ activity may be of therapeutic value in PC [16–19]. PPARs
activators might be an ideal combination partner in ther-apeutic settings where the inhibition of tumour-protecting proteins may be relevant to overcome treatment resistance [20]. Kristiansen et al. [21] demonstrated that PPARγ mRNA and protein expression were upregulated in pancreatic ductal adenocarcinoma and might serve as prognostic marker for this disease. In the present investigation we analyzed mRNA levels of PPARγ, DNMT1, and DNMT3B in PC patients in order to assess correlations among these factors and their associations with some clinical and pathological features of patients. We did not find an altered PPARγ expression in tumor as compared to normal matched tissues, but PPARγ expression showed a positive correlation with DNMT1 but not with DNMT3B expression. In addition, mRNA expres-sion of the latter two genes was highly related. DNMT3B expression was significantly downregulated in tumors as compared to normal matched tissue, and positively asso-ciated to lymph node ratio and margin status. Peng et al. [22] suggested that increased DNMT1 protein expression participates in multistage pancreatic carcinogenesis from a precancerous stage to the malignant transition of ductal carcinomas and may be a biological predictor of poor prognosis. In our cohort, we found that DNMT3B expression
∗∗ ∗∗ Cx V 5 μM ros 24 h 5 μM ros 48 h 24 h 15 μM ros 48 h 15 μM ros DNMT1 PANC1 0 0.2 0.4 0.6 0.8 1 1.2 1.4 1.6 1.8 mRN A r elati ve e xpr ession ∗ (a) Cx V 5 μM ros 24 h 5 μM ros 48 h 24 h 15 μM ros 48 h 15 μM ros DNMT3b ∗ ∗ 0 0.5 1 1.5 2 2.5 3 3.5 4 4.5 (b) Cx V 5 μM ros 24 h 5 μM ros 48 h 24 h 15 μM ros 48 h 15 μM ros DNMT1 MiaPaca mRN A r elati ve e xpr ession ∗ ∗ 0 0.5 1 1.5 2 2.5 3 (c) ∗∗ Cx V 5 μM ros 24 h 5 μM ros 48 h 24 h 15 μM ros 48 h 15 μM ros DNMT3b 0 0.2 0.4 0.6 0.8 1 1.2 1.4 (d)
Figure 7: Quantitative real-time PCR. mRNA relative expression levels of DNMT1 and 3B in PANC1 and MiaPaca pancreatic cancer cell lines upon treatment with rosiglitazone at the indicated concentrations and time points.
displayed lower levels in noninvasive compared to invasive tumors. These data were in agreement with the in vitro findings showing that DNMT3B levels were higher in PANC1 and CFPAC cells whose superior invasive ability has been already demonstrated [23–25] as compared to BxPC3 and MiaPaca cells.
In PC patients, the univariate analysis showed a protec-tive role, in terms of reduced mortality, of high DNMT3B expression levels in noninvasive tumours, whereas in invasive tumours such an effect for DNMT3B overexpression was not further observed.
Moreover, in our in vitro models of PC cells, PPARγ displayed higher levels in PANC-1 cells as compared to the other cell lines whilst CFPAC and MiaPaca cells presented the lower PPARγ mRNA levels. DNMT1 showed the same trend of PPARγ corroborating the positive correlation between PPARγ expression with DNMT1 in PC tissue.
When treated with PPARγ ligand (rosiglitazone), pancre-atic cancer cells responded in different manner suggesting
a dose-dependent and time-dependent effect. The observed difference of PPARγ and DNMTs levels and the differences in rosiglitazone response in the different cell lines could be due to their different genetic background [23]. Moreover, DNMTs alterations triggered by a low dose of rosiglitazone after 24 hours, which surprisingly was not observed upon incubation with a higher dose for 48 hours, indicate the existence of cell adaptative mechanisms to enhanced and perhaps saturated PPAR signaling.
5. Conclusion
Our study demonstrated that PPARγ positively correlates with DNMT1, but not with DNMT3B, and that higher DNMT3B mRNA levels in presence of noninvasive tumor predict longer survival in pancreatic cancer patients whereas in presence of invasive tumour higher DNMT3B mRNA levels were associated with a poor prognosis.
Authors’ Contribution
A. Andriulli and P. di Sebastiano have contributed equally to this work.
Acknowledgments
The authors thank Professor Aldo Scarpa for providing the cell lines. This work was supported by “Ministry of Italian Health” Grant through the Research Laboratory of Gastroenterology Unit (RC1203GA58), Division of Internal Medicine and Chronobiology Unit (RC1203ME46) and from Department of Surgery (RC1203CH50) IRCCS Scientific Institute and Regional General Hospital “Casa Sollievo della Sofferenza,” Opera di Padre Pio da Pietrelcina, San Giovanni Rotondo, Italy, and by the “5x1000” voluntary contributions.
References
[1] A. Jemal, R. Siegel, E. Ward, Y. Hao, J. Xu, and M. J. Thun, “Cancer statistics, 2009,” CA: Cancer Journal for Clinicians, vol. 59, no. 4, pp. 225–249, 2009.
[2] S. H. Landis, T. Murray, S. Bolden, and P. A. Wingo, “Cancer Statistics, 1999,” CA: Cancer Journal for Clinicians, vol. 49, no. 1, pp. 8–31, 1999.
[3] A. L. Warshaw and C. Fern´andez-del Castillo, “Pancreatic carcinoma,” The New England Journal of Medicine, vol. 326, no. 7, pp. 455–465, 1992.
[4] D. Hariharan, A. Saied, and H. M. Kocher, “Analysis of mortality rates for pancreatic cancer across the world,” HPB, vol. 10, no. 1, pp. 58–62, 2008.
[5] P. Ferr´e, “The biology of peroxisome proliferator-activated receptors: relationship with lipid metabolism and insulin sensitivity,” Diabetes, vol. 53, supplement 1, pp. S43–S50, 2004. [6] M. H. Hsu, U. Savas, K. J. Griffin, and E. F. Johnson, “Identification of peroxisome proliferator-responsive human genes by elevated expression of the peroxisome proliferator-activated receptor α in HepG2 cells,” Journal of Biological Chemistry, vol. 276, no. 30, pp. 27950–27958, 2001.
[7] S. A. Kliewer, B. M. Forman, B. Blumberg et al., “Differential expression and activation of a family of murine peroxisome proliferator-activated receptors,” Proceedings of the National Academy of Sciences of the United States of America, vol. 91, pp. 7355–7359, 1994.
[8] B. Farrow, K. L. O’Connor, K. Hashimoto, T. Iwamura, and B. M. Evers, “Selective activation of PPARγ inhibits pancreatic cancer invasion and decreases expression of tissue plasminogen activator,” Surgery, vol. 134, no. 2, pp. 206–212, 2003.
[9] X. Cheng, “DNA modification by methyltransferases,” Current Opinion in Structural Biology, vol. 5, no. 1, pp. 4–10, 1995. [10] S. S. Smith, B. E. Kaplan, L. C. Sowers, and E. M. Newman,
“Mechanism of human methyl-directed DNA methyltrans-ferase and the fidelity of cytosine methylation,” Proceedings of the National Academy of Sciences of the United States of America, vol. 89, no. 10, pp. 4744–4748, 1992.
[11] M. F. Robert, S. Morin, N. Beaulieu et al., “DNMT1 is required to maintain CpG methylation and aberrant gene silencing in human cancer cells,” Nature Genetics, vol. 33, no. 1, pp. 61–65, 2003.
[12] I. Rhee, K. E. Bachman, B. H. Park et al., “DNMT1 and DNMT3b cooperate to silence genes in human cancer cells,” Nature, vol. 416, no. 6880, pp. 552–556, 2002.
[13] American Joint Committee on Cancer, “Exocrine and endocrine pancreas,” in AJCC Cancer Staging Manual, S. B. Edge, D. R. Byrd, C. C. Compton et al., Eds., pp. 241–246, Springer, New York, NY, USA, 7th edition, 2010.
[14] G. Benegiamo, M. Vinciguerra, G. Mazzoccoli, A. Piepoli, A. Andriulli, and V. Pazienza, “DNA methyltransferases 1 and 3b expression in Huh-7 cells expressing HCV core protein of different genotypes,” Digestive Disease Science, vol. 57, no. 6, pp. 1598–1603, 2012.
[15] P. Lefebvre, G. Chinetti, J. C. Fruchart, and B. Staels, “Sorting out the roles of PPARα in energy metabolism and vascular homeostasis,” Journal of Clinical Investigation, vol. 116, no. 3, pp. 571–580, 2006.
[16] M. Tsujie, S. Nakamori, J. Okami et al., “Thiazolidinediones inhibit growth of gastrointestinal, biliary, and pancreatic adenocarcinoma cells through activation of the peroxisome proliferator-activated receptorγ/retinoid X receptor α path-way,” Experimental Cell Research, vol. 289, no. 1, pp. 143–151, 2003.
[17] K. Hashimoto, R. T. Ethridge, and B. M. Evers, “Peroxisome proliferator-activated receptor γ ligand inhibits cell growth and invasion of human pancreatic cancer cells,” International Journal of Gastrointestinal Cancer, vol. 32, no. 1, pp. 7–22, 2002.
[18] A. Galli, E. Ceni, D. W. Crabb et al., “Antidiabetic thiazo-lidinediones inhibit invasiveness of pancreatic cancer cells via PPARγ independent mechanisms,” Gut, vol. 53, no. 11, pp. 1688–1697, 2004.
[19] W. Motomura, M. Nagamine, S. Tanno et al., “Inhibition of cell invasion and morphological change by troglitazone in human pancreatic cancer cells,” Journal of Gastroenterology, vol. 39, no. 5, pp. 461–468, 2004.
[20] H. Koga, K. Selvendiran, R. Sivakumar et al., “PPARγ poten-tiates anticancer effects of gemcitabine on human pancreatic cancer cells,” International Journal of Oncology, vol. 40, no. 3, pp. 679–685, 2012.
[21] G. Kristiansen, J. Jacob, A. C. Buckendahl et al., “Peroxisome proliferator-activated receptorγ is highly expressed in pan-creatic cancer and is associated with shorter overall survival times,” Clinical Cancer Research, vol. 12, no. 21, pp. 6444– 6451, 2006.
[22] D. F. Peng, Y. Kanai, M. Sawada et al., “Increased DNA methyl-transferase 1 (DNMT1) protein expression in precancerous conditions and ductal carcinomas of the pancreas,” Cancer Science, vol. 96, no. 7, pp. 403–408, 2005.
[23] E. L. Deer, J. Gonz´alez-Hern´andez, J. D. Coursen et al., “Phenotype and genotype of pancreatic cancer cell lines,” Pancreas, vol. 39, no. 4, pp. 425–435, 2010.
[24] K. Hashimoto, B. J. Farrow, and B. M. Evers, “Activation and role of MAP kinases in 15d-PGJ2-induced apoptosis in the human pancreatic cancer cell Line MIA PaCa-2,” Pancreas, vol. 28, no. 2, pp. 153–159, 2004.
[25] M. Gaviraghi, P. Tunici, S. Valensin et al., “Pancreatic cancer spheres are more than just aggregates of stem marker-positive cells,” Bioscience Reports, vol. 31, no. 1, pp. 45–55, 2011.
Submit your manuscripts at
http://www.hindawi.com
Stem Cells
International
Hindawi Publishing Corporation
http://www.hindawi.com Volume 2014
Hindawi Publishing Corporation
http://www.hindawi.com Volume 2014 INFLAMMATION
Hindawi Publishing Corporation
http://www.hindawi.com Volume 2014
Behavioural
Neurology
Endocrinology
International Journal ofHindawi Publishing Corporation
http://www.hindawi.com Volume 2014
Hindawi Publishing Corporation
http://www.hindawi.com Volume 2014
Disease Markers
Hindawi Publishing Corporation
http://www.hindawi.com Volume 2014
BioMed
Research International
Oncology
Journal of Hindawi Publishing Corporationhttp://www.hindawi.com Volume 2014
Hindawi Publishing Corporation
http://www.hindawi.com Volume 2014 Oxidative Medicine and Cellular Longevity Hindawi Publishing Corporation
http://www.hindawi.com Volume 2014
PPAR Research
The Scientific
World Journal
Hindawi Publishing Corporation
http://www.hindawi.com Volume 2014
Immunology Research
Hindawi Publishing Corporation
http://www.hindawi.com Volume 2014
Journal of
Obesity
Journal ofHindawi Publishing Corporation
http://www.hindawi.com Volume 2014
Hindawi Publishing Corporation
http://www.hindawi.com Volume 2014 Computational and Mathematical Methods in Medicine
Ophthalmology
Journal ofHindawi Publishing Corporation
http://www.hindawi.com Volume 2014
Diabetes Research
Journal of Hindawi Publishing Corporationhttp://www.hindawi.com Volume 2014
Hindawi Publishing Corporation
http://www.hindawi.com Volume 2014
Research and Treatment
AIDS
Hindawi Publishing Corporation
http://www.hindawi.com Volume 2014 Gastroenterology Research and Practice
Hindawi Publishing Corporation
http://www.hindawi.com Volume 2014