R E S E A R C H P A P E R
Integrating qualitative system dynamics with accounting
practices: The case of integrated reporting and resource
mapping
Maria Cleofe Giorgino
1| Federico Barnabè
1| Martin Kunc
21Department of Business and Law,
University of Siena, Siena, Italy
2Southampton Business School,
University of Southampton, Southampton, UK
Correspondence
Martin Kunc, Southampton Business School, University of Southampton, University Road, Southampton SO17 1BJ, UK.
Email: [email protected]
Abstract
The article explores the role of qualitative system dynamics (SD) in evaluating the information presented in corporate accounting reports. Particularly, this study focuses on a recent corporate report called integrated reporting (<IR>), and analyses the <IR> information using a specific qualitative SD technique, resource mapping, in order to visualize the key resources and their connections responsible for the performance of the organization. The study's contribution is twofold. First, it provides insights on how to apply qualitative SD in the field of management accounting and corporate reporting. Second, it verifies the bene-fits of combining qualitative SD and corporate reporting tools to develop new knowledge useful to represent and face the dynamic complexity implicit in a business domain.
K E Y W O R D S
dynamic complexity, integrated reporting, management accounting, qualitative system dynamics, resource mapping
1 | I N T R O D U C T I O N A N D
B A C K G R O U N D T O T H E R E S E A R C H
A wide literature debated the various typologies of data used for building models in system dynamics (SD; Forrester, 1961, 1968; Richardson & Pugh, 1981; Sterman, 2000). As Forrester (1980) states, data can be primarily divided into three categories, that is, mental data, written data, and numerical data, which differ on their level of formalization, amount, and availability. Among them, written data certainly represent an “excellent source of information about system structure and the reasons for decisions” (Forrester, 1980, p. 557), particularly in the business domain, where a widely available source of data are corporate reports. Different types of corporate reports that provide more qualitative information, specifically to improve the relationship between the organization and its stakeholders, are becoming increasingly relevant(Deegan & Blomquist, 2006; Gray, Kouhy, & Lavers, 1995). Thus, these reports can be a good written database for the development of SD models, as implicitly suggested by many scholars (e.g., Kim & Andersen, 2012; Kunc & Morecroft, 2009; Luna‐Reyes & Andersen, 2003; Richard-son & Pugh, 1981; Schaffernicht, 2010; Sterman, 2000). Moreover, there is an increasing number of studies based on the use of different variations of qualitative SD, such as causal loop diagramming (e.g., Senge, 1990; Wolstenholme, 1999), cognitive mapping (e.g., Eden, 1992), and resource mapping (e.g., Kunc & Morecroft, 2009; Kunc & O'Brien, 2017). Indeed, SD literature offers the breadth of application, and the potentials of qualita-tive SD for the inspection and analysis of various manage-rial problems (e.g., Coyle & Alexander, 1997; Gary & Wood, 2011; Kopainsky & Luna‐Reyes, 2008; Lane, 2008; Pala, Vennix, & Van Mullekom, 2003; Snabe & Größler, 2006; Wolstenholme & Coyle, 1983).
DOI: 10.1002/sres.2602
However, previous research also raised some concerns on the use of qualitative SD. More in detail, there are some challenges within the academic community (e.g., the challenge of increasing the degree of transparency and structure analysis in qualitative SD models, Martinez‐Moyano, 2012; of improving the accuracy of mental models, Schaffernicht & Groesser, 2011; or of ameliorating the analysis of qualitative SD models through the investigation of a selected number of system characteristics, such as the no. of variables, the no. of loops, and the length of loops included in the model, see Schaffernicht & Groesser, 2014), as well as calls for action and more evidence of the potentials and usefulness of qualitative SD models, in comparison with (or for inte-gration with) quantitative modelling (Wolstenholme, 1999). Particularly, the effectiveness of qualitative SD models is still at the centre of a very lively debate and requires in‐depth analyses in terms of its potentials to represent and evaluate the dynamic complexity inherent in an organization's business activities (Groesser, 2013), which is ultimately embedded in its corporate reports. On this point, the aim of our study is two‐fold:
1. to provide insights on how to apply qualitative SD in the field of management accounting and corporate reporting by re‐organizing and re‐framing existing data and information into new dynamic‐oriented knowledge; and
2. to investigate the dynamic complexity expressed in a comprehensive corporate report and evaluate the role of qualitative SD to represent dynamic complexity and support decision‐makers.
In sum, the main expected contribution of this study is to verify the usefulness of combining qualitative SD and cor-porate reporting tools to both re‐frame the written infor-mation of these documents through specific visual artefacts and develop additional knowledge about the value creation process of an organization.
To achieve this aim, the study focuses on a specific qualitative SD method, that is, resource mapping (Kunc & Morecroft, 2009), applied to a recent type of corporate reports—the so‐called Integrated Reporting (hereafter <IR>)—selected for being a written text including also many qualitative information on the social and environ-mental impacts of the organization's activities (IIRC, 2013a). Moreover, <IR> is currently at the centre of a very active debate involving both academics in manage-ment accounting and practitioners worldwide (e.g., Adams, 2015; de Villiers, Rinaldi, & Unerman, 2014; Eccles & Krzus, 2011; Giorgino, Supino, & Barnabè, 2017). In a second step, our analysis employs a quantita-tive tool, that is, SDM‐Doc (Martinez‐Moyano, 2012), to
analyse the dynamic complexity represented and embed-ded in the <IR>‐based resource map developed. Particu-larly, the analysis of the maps performed with the SDM‐ Doc software allows investigating specific properties of the structure of qualitative SD modelling (Groesser & Schaffernicht, 2012; Schaffernicht & Groesser, 2011, 2014).
This study expects to verify the utility of combining <IR> with qualitative SD (specifically with resource mapping) as a method to increase the information con-tent of an integrated report and support decision‐makers in understanding the dynamic complexity.
2 | T O W A R D S T H E C O M B I N A T I O N
O F S Y S T E M D Y N A M I C S W I T H
I N T E G R A T E D R E P O R T I N G
Scholars have demonstrated the validity of combining SD tools and principles with strategic management, account-ing, and reporting tools and frameworks (e.g., Barnabè, 2016; Gary, Kunc, Morecroft, & Rockart, 2008; Kunc & Morecroft, 2007; Snabe & Größler, 2006; Warren, 2008). Examples include the combination of SD with balanced scorecard (Akkermans & Van Oorschot, 2005; Barnabè & Busco, 2012; Capelo & Ferreira Dias, 2009; Humphreys, Gary, & Trotman, 2015) and with the data envelopment analysis (e.g., Lacagnina & Provenzano, 2009, 2011). Overall, this stream of literature highlights the benefits of combining SD with other tools/techniques for: elicita-tion of mental models (Ford & Sterman, 1998; Vennix, 1996), increased participation of stakeholders in decision‐making (Stave, 2002), improved corporate per-formance (Warren, 2008), identification of linkages between strategy and operations (Morecroft, 2007), understanding of the potential side‐effects and counter‐ intuitive results generated by policies (Forrester, 1971), and mitigation of bounded rationality in decision‐making (Größler, 2004).
However, a further combination of SD with additional management, accounting, and reporting tools is advo-cated particularly by non‐SD scholars (e.g., Kaplan, 2012), but there have not been studies satisfying this request. This study aims to address such a gap in the lit-erature by investigating the usefulness of combining SD principles with a recent corporate reporting tool (i.e., the integrated report) developed by the International
Inte-grated Reporting Council (IIRC)in order to represent and communicate in one document the overall process of value creation.
According to the IIRC framework (IIRC, 2013a), an <IR> has to contain all the elements describing the orga-nization's activities and support the process of value
creation involving organization's stakeholders through the use of specific guidelines, such as connectivity and
materiality. Connectivity entails representing the interre-latedness and dependencies among the different factors (e.g., the various resources or financial and non‐financial information) influencing the organization's capacity to create value over time. Materiality requires disclosing all factors impacting the organization's value creation process.
In the IIRC framework, the organization's inputs (the resources/capitals at disposal) are classified into six cate-gories (IIRC, 2013b): Financial, Manufactured, Human,
Intellectual, Social, and Natural. Overall, an <IR> repre-sents the value creation process as a dynamic and circular system because the economic and non‐economic out-comes produced by the organization affect the future organization's availability of inputs for successive produc-tion cycles (Figure 1).
In broad terms, the <IR>'s ultimate goal is to inform the organization's shareholders and stakeholders about the value created using the inputs at disposal (IIRC, 2013a, p. 35). Unfortunately, this goal inevitably clashes with the difficulties in“capturing” the dynamic complex-ity affecting the organization's activities, defining the sys-tem boundaries, and identifying which relationships and outcomes have to be included in the model of the organization.
Therefore, this study integrates the <IR> perspective on value creation (and the written database delivered by
the report itself) with an SD approach to provide more insights into the performance of the organization, thus investigating if this combination may be fruitful to encourage more cross‐fertilization between SD and the field management accounting.
In detail, this study applies qualitative SD in the form of resource mapping (Kunc & Morecroft, 2009), an SD technique adopting a particular graphical tool— a resource map—to visualize the key strategic resources, their connections, and the overall pattern of value crea-tion. Resource maps are essentially stock and flow diagrams (Sterman, 2000), so they overcome some of the weaknesses of causal loop diagrams in terms of understanding the dynamics of the system structures (Schaffernicht, 2010). In resource maps, “stocks” repre-sent diagrammatically resources or asset stocks using the description suggested in Barney (1986) and Dierickx and Cool (1989).“Flows” depict increases and decreases in the level of resources, controlled by implicit or explicit operating policies (Kunc, 2007). Finally, a web of “connectors” represents the perceived causal attributions that, through operating policies, link resources to the accumulation rate of other resources in the organization.
In the business domain, resource maps are primarily meant to assist organizations to visualize their strategy (Kunc & Morecroft, 2009, 2010) and the fundamental architecture according to which the specific business system operates (Warren, 2008). They also act as visual
representations of the network of interdependencies existing both within and outside the organization, hence, demonstrating graphically the complexity existing in business models and analytically its impact on value creation through the analysis and evaluation of the feedback processes represented in a resource map (Kazakov & Kunc, 2016). Moreover, as mentioned by Torres, Kunc, and O'Brien (2017), resource maps may introduce CEOs to the use of SD, clarifying the concepts behind SD models (stocks, flows, and integral equa-tions) by associating them with their knowledge about the organization.
In this study, the network of stocks and flows is informed by the comprehensive reporting of business operations—the <IR>—in terms of resources underpin-ning competitive advantage and value creation. The aim pursued is to investigate the benefits of developing <IR>‐based resource maps in order to reframe the <IR> information and provide new knowledge useful to understand the dynamic complexity of an organization, explicitly supporting decision‐makers in clearly representing key capitals/resources, explaining trade‐offs between capitals, gaining policy insights (Lane, 2012), and exploiting key value creation patterns (Kim, 2001).
3 | R e s e a r c h m e t h o d
The research design of the study consists of three consec-utive steps: identification of the specific <IR> being analysed, development of the related <IR>‐based resource map, and analysis of the dynamic complexity resulting from the resource map. Additional details on each step are provided below.
3.1 | Selecting the case study
As a first step, the research design requires the selection of the specific <IR> to be analysed according to the aim pursued. For this study, there was the need of identifying an“exploratory case study” (Ryan, Scapens, & Theobald, 2002; Yin, 1994) useful to explore the benefits of combin-ing this corporate reportcombin-ing tool with qualitative SD. Therefore, the selection fell on the 2015 <IR> (retrieved in date 2 December 2016) of an Italian oil and gas com-pany, ENI, due to multiple reasons. First, ENI is consid-ered to be an experienced organization using <IR> because it is one of the organizations that have joined the IIRC Pilot Programme in its beginnings and subse-quently published numerous annual versions of <IR>. Additionally, ENI belongs to the oil and gas industry, which represents one of the most scrutinized business
sectors in terms of sustainability and reporting practices (e.g., Roca & Searcy, 2012).
3.2 | Resource mapping process
In a second step, the research method requires the analy-sis of the information included in the organization's <IR> (in this case, the ENI's <IR>), and particularly in the section presenting the organization's business model (ENI, 2015, pp. 16–17), in order to develop the resource map representing the processes of value creation. For this step, it might be useful to adopt a specific software, such as Vensim (Eberlein & Peterson, 1992).
Specifically, the resource mapping process entails four main activities (Kunc & Morecroft, 2009):
• identification of the organization's resources and capabilities;
• assessment of their strength and importance in the organization's business strategy;
• graphical representation of resources, capabilities, and relationships among them using specific graphic signs (like boxes and arrows);
• identification of the dynamic complexity existing in the organization, as derived from the system represented.
To increase the study's reliability, data and information contained in the selected <IR> were analysed sepa-rately by more than one researcher in order to reduce potential “researcher effects” (Miles, Huberman, & Saldana, 2013, p. 296). The results of the different autonomous data processing were compared to identify the“shared” resource map, including the type of causal relationships and the feedback loops involving the orga-nization's key resources. For non‐experts in the field of SD, a feedback process consists of a circular relationship between a set of concepts (or parts of a system), for example, A affects B, then B affects C, and ultimately C affects A determining a circular relationship between A, B, and C. Feedback processes are recognized and labelled as either reinforcing (positive, amplifying change) or balancing (negative, generating equilibrium), depending on the number and typologies of the rela-tionships, for example, the number of negative linkages connecting such variables. In broad terms, a positive (or direct) relationship between two variables means that an increase (or a decrease) in the first one will lead to an increase (or a decrease) in the second one as well; on the contrary, a negative (or indirect) relationship means that an increase (a decrease) in the first one will lead to a decrease (an increase) in the second one (Sterman, 2000).
3.3 | Analysis of the dynamic complexity
in qualitative SD
Finally, the research method requires the identification of measures useful to evaluate the dynamic complexity characterizing the system represented in the resource map, such as the number of components (stocks, flows, and auxiliaries) with their type of relationships (positive or negative linkages; Spector, Christensen, Sioutine, & McCormack, 2001), as well as the feedback loops affect-ing the stocks or specific variables. It is noteworthy to remind that the identification of feedback processes in a resource map is crucial to provide clear and transparent information to the various organization's stakeholders about the critical areas of the business underpinning value creation.
The approach to evaluating structural dynamic complexity is originated from the work of Schaffernicht (2010) and Schaffernicht and Groesser (2011) related with comparing mental models of dynamic systems. According to their work, the structure of models can be analysed at three levels: the level of the elements (variables, linkages per variable, ratio between in/out linkages, and ratio between positive and negative linkages), the level of the individual feedback loop (size) and the level of the complete model (total number
of feedback loops and positive and negative
feedback loops). In this perspective, (see Groesser & Schaffernicht, 2012, p. 49) “causal links, link strength, link polarities, variables, feedback loops, and, less often,
other properties such as length of a feedback loop” are viewed as a core set of elements that can be used to operationalize the structural representation of a mental model of dynamic systems. Stated differently, studying and understanding the model structure enables the researcher to analyse the key “properties” of the system under investigation, thus triggering important implications.
For example, measuring the average loop length allows deriving useful information both on the structure of the system and the managers' mental models: as to the former, a higher loop length indicates that some busi-ness components are more interconnected than others (Doyle, Radzicki, & Trees, 2008); as to the latter, and cit-ing the work by Verburgh (1994, p. 50), an increase in the average length of loops can“be seen as an increase in the awareness that changes in one element of the system do not only result in a change in one other element, but that this next element is bringing about a change in other ele-ments as well.”
Additionally, the number of bivariate causal relation-ships, the polarity of these relationrelation-ships, and the number of immediate feedback loops between two variables deter-mine the strength of their impact on the performance of the business (Gary & Wood, 2011).
Last, dense resources (i.e., “spots” where there is a high number of feedback loops) can be seen as an inter-esting feature of not only the system under analysis but also the managers' mental models that govern such resources (Groesser & Schaffernicht, 2012).
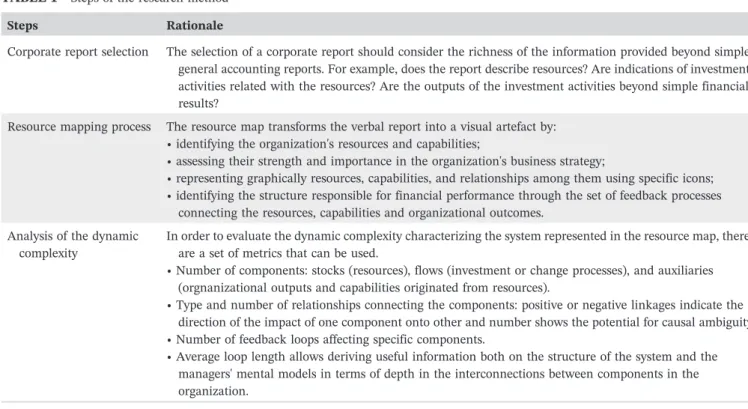
TABLE 1 Steps of the research method
Steps Rationale
Corporate report selection The selection of a corporate report should consider the richness of the information provided beyond simple general accounting reports. For example, does the report describe resources? Are indications of investment activities related with the resources? Are the outputs of the investment activities beyond simple financial results?
Resource mapping process The resource map transforms the verbal report into a visual artefact by: • identifying the organization's resources and capabilities;
• assessing their strength and importance in the organization's business strategy;
• representing graphically resources, capabilities, and relationships among them using specific icons; • identifying the structure responsible for financial performance through the set of feedback processes
connecting the resources, capabilities and organizational outcomes. Analysis of the dynamic
complexity
In order to evaluate the dynamic complexity characterizing the system represented in the resource map, there are a set of metrics that can be used.
• Number of components: stocks (resources), flows (investment or change processes), and auxiliaries (orgnanizational outputs and capabilities originated from resources).
• Type and number of relationships connecting the components: positive or negative linkages indicate the direction of the impact of one component onto other and number shows the potential for causal ambiguity. • Number of feedback loops affecting specific components.
• Average loop length allows deriving useful information both on the structure of the system and the managers' mental models in terms of depth in the interconnections between components in the organization.
TABLE 2 ENI's business model (ENI, 2015, p. 17) Typology of capital Stock of capital ENI's main actions Value creation for ENI Value creation for ENI's stakeholders Financial capital ‐ Financial structure ‐ Liquidity reserves ‐ Cash flow from operations ‐ Bank loans ‐ Bonds ‐ Maintaining strategic liquidity ‐ Hedging ‐ Dividends ‐ Working capital optimization ‐ Going concern ‐ Lower cost of capital ‐ Reduction of working capital ‐ Leverage optimization ‐ M&A opportunities ‐ Mitigation of market volatility ‐ Credit worthiness ‐ Yields ‐ Share price appreciation ‐ Social and economic growth ‐ Satellite activities Productive capital ‐ Onshore and offshore plants ‐ Pipelines and storage plants ‐ Liquefaction plants ‐ Refineries ‐ Distribution networks ‐ Power plants ‐ Buildings and other equipment ‐ Hydrocarbon reserves (Oil and gas) ‐ Technological upgrade ‐ Process upgrade ‐ Investment in new businesses (biorefinery, car sharing) ‐ Maintenance and development activities ‐ Increase environment Certifications (ISO 14001, ISO 50001, EMAS, etc.) ‐ Returns ‐ Enlarging asset portfolio ‐ Increase asset value ‐ Reduction of operational risk ‐ Energy and operational efficiency ‐ Reputation ‐ Hydrocarbon reserves growth ‐ Availability of energy sources and green products ‐ Employment ‐ Satellite activities ‐ Reductions of direct GHG emissions and responsible use of resources Intellectual capital ‐ Technologies and intellectual property ‐ Corporate internal procedures ‐ Corporate governance system ‐ Integrated risk management ‐ Management and control system ‐ Knowledge management ‐ ICT (Green data center) ‐ Research and development expenditures ‐ Partnership with centres of excellence ‐ Development of proprietary technologies and patents ‐ Application of procedures and systems ‐ Audit ‐ Competitive advantage ‐ Risk mitigation ‐ Transparency ‐ Performance ‐ License to operate ‐ Stakeholders' acceptability ‐ Reduction of environmental and social impacts ‐ Transfer of best available technologies and know ‐how to host countries ‐ Contribution to the fight against corruption ‐ Green products Human capital ‐ Health and safety of people ‐ Know ‐how and skills ‐ Experience ‐ Engagement ‐ Diversity (gender, seniority, geographical) ‐ Safety at work ‐ Recruiting, education and training on the job ‐ Promotion of human rights ‐ ENI's people engagement ‐ Performance ‐ Efficiency ‐ Competitiveness ‐ Innovation ‐ Risk mitigation ‐ Create employment and preserve jobs ‐ Job enhancement ‐ Wellness of ENI's people and local communities (Continues)
TABLE 2 (Continued) Typology of capital Stock of capital ENI's main actions Value creation for ENI Value creation for ENI's stakeholders ‐ ENI's thinking ‐ Knowledge management ‐ Welfare ‐ Leveraging on diversity ‐ Enhancing individual talents and remuneration in accordance to a merit system ‐ Reputation ‐ Talent attraction ‐ Job enhancement ‐ Career development ‐ Increase and transfer know ‐how Social and relationship capital ‐ Relationship with stakeholders (institutions, governments, communities, associations, customers, suppliers, industrial partners, NGO, universities, trade unions) ‐ ENI brand ‐ Stakeholders' engagement ‐ MoU with governments and local authorities ‐ Projects for local development and local content ‐ Strategic partnerships ‐ Involvement in international panel discussion ‐ Development of programmes on research and training ‐ Partnership with trade unions ‐ Quality of services rendered ‐ Brand management ‐ Operational & social licence ‐ Reduction of time ‐ to ‐market ‐ Country risk reduction ‐ Market share ‐ Alignment to international best practices ‐ Reputation ‐ Competitive advantage ‐ Suppliers reliability ‐ Customers retention ‐ Local socio ‐economical development ‐ Customers and suppliers satisfaction ‐ Share of expertise with territories and communities ‐ Satisfaction and incentive of people ‐ Promoting respect for workers' rights Natural capital ‐ Oil and gas reserves ‐ Water ‐ Biodiversity and ecosystems ‐ Air ‐ Soil ‐ Exploration, production, transporting, and refining and distributing hydrocarbons ‐ Investment in new businesses (biorefinery, car sharing) ‐ Investment in technological and process upgrade ‐ Remediation activities ‐ Investment in alternative energy sources ‐ Hydrocarbon reserves growth ‐ Opex reduction ‐ Mitigation of operational risk (asset integrity) ‐ Reputation ‐ License to operate ‐ Stakeholders' recognition ‐ Reduction of gas flared ‐ Reduction of oil spill ‐ Reduction of blow out risk ‐ Preservation of biodiversity ‐ Green products ‐ Containment of water consumption (reinjection and water reuse) ‐ Energy efficiency
In more detail, to obtain the measures for dynamic complexity, it is useful to adopt the model assessment function related to variables types, feedback loops, polar-ities, and relationships existing in SDM‐Doc (Martinez‐ Moyano, 2012), which is a tool able to analytically inves-tigate the structure of an SD model.
Table 1 shows the generic steps that can be followed to replicate the study with other corporate reports.
4 | R E S U L T S
This section presents the resource map and the analysis of the dynamic complexity existing in ENI's business according to its <IR>. The starting point of our
exploration is briefly represented in Table 2 that describes the ENI's business model as presented in its 2015 <IR>.
For each typology of capital identified (Financial, Pro-ductive, Intellectual, Human, Social and Relationship, and Natural), Table 2 reports the list of stocks (or capitals/resources) and the actions carried out by ENI to manage them. Outputs and outcomes, measured in terms of value creation, are subsequently classified into two typologies: Value created for ENI and Value created for
ENI's stakeholders.
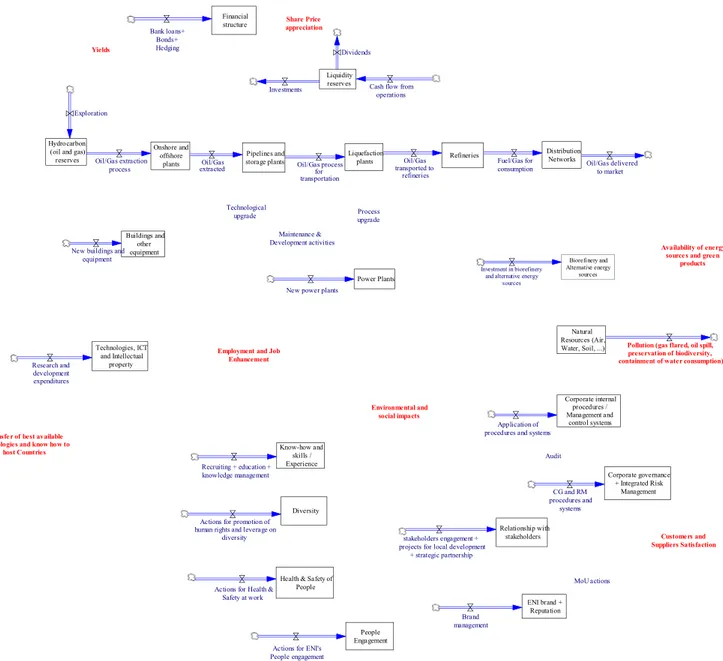
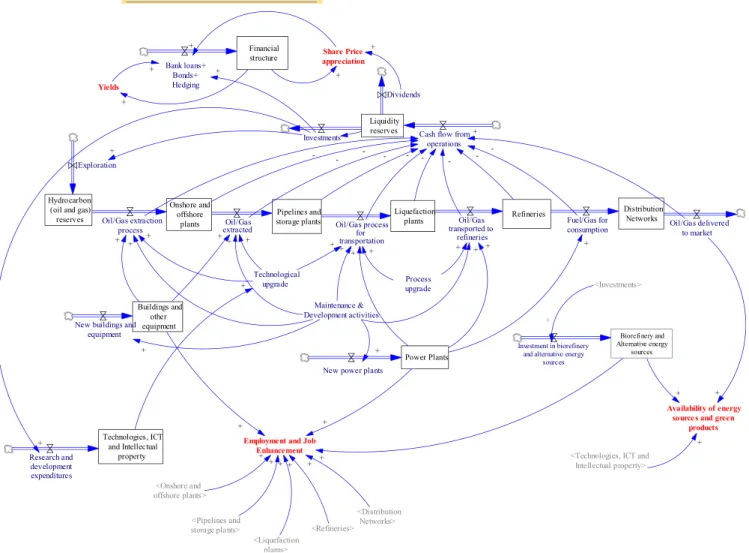
Building on the information displayed in Table 2, the resource map was developed, representing the process of value creation developed by ENI (Figure 2).
Specifically, this first simple map allowed identifying the key stocks of capital (black items), ENI's main actions to drive the stocks of capital (flows, in blue colour), and
value creation outcomes for ENI's stakeholders (red items), together with processes and capabilities generated by the resources (additional blue items). The adoption of different colours is an artefact to make the resource map more intelligible and facilitate communication with non‐ experts. The names of the resources (rectangles) are aligned to the stocks of capital displayed in Table 2, and the names of the flows (arrows with little valves) indicate the actions responsible for building the resources (ENI's main actions in Table 2). Some capitals shown in Table 2 were aggregated in our resource map, given their inherent similarity and common management (e.g., Air, Water, and Soil were merged into one single resource— Natural resources). This is a deliberate choice related to the level of detail adopted in illustrating the system of strategic resources comprising ENI and responsible for the process of value creation in the company.
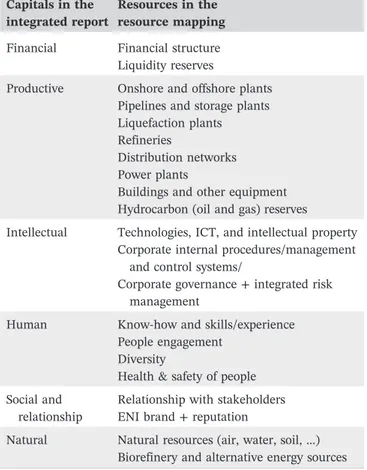
Table 3 presents the 21 resources identified in the ENI's report.
Table 3 Typologies of integrated reporting capitals/ resources in the resource map
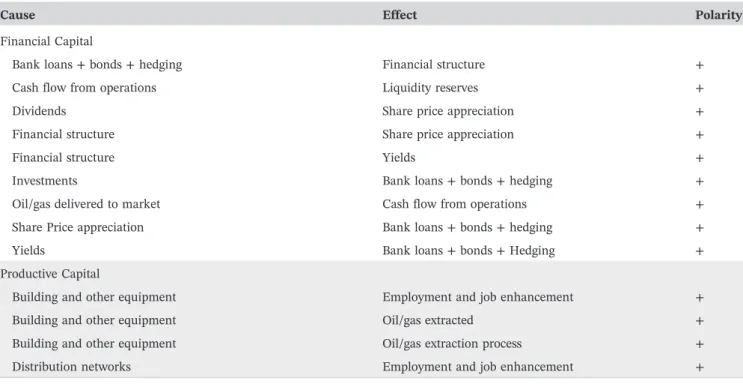
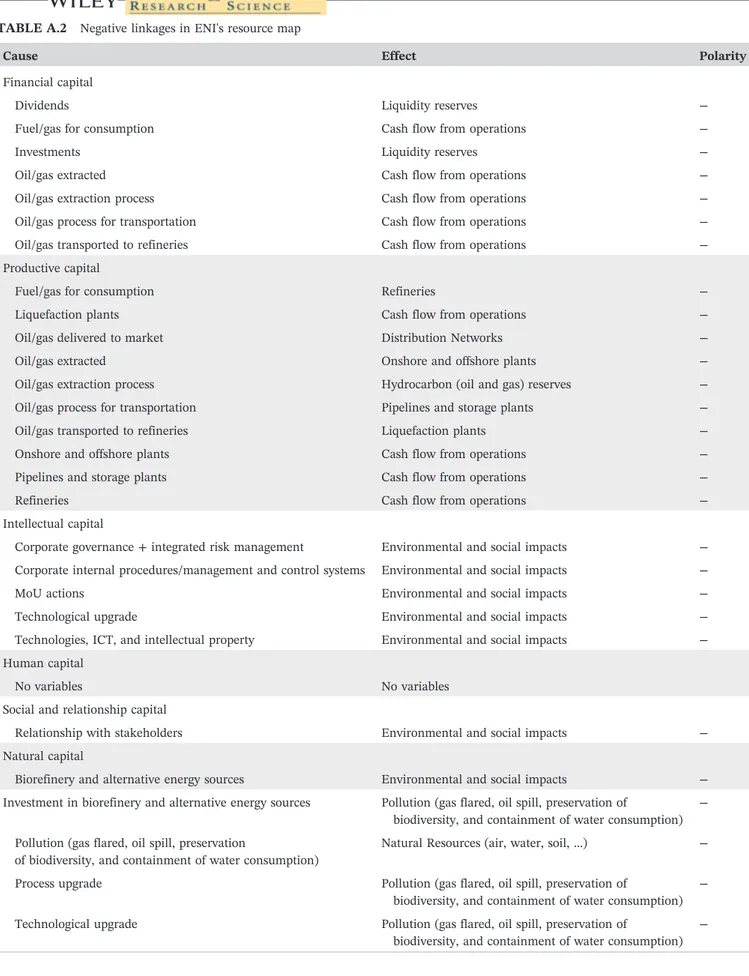
The successive step entailed the addition of causal relationships derived from the ENI's <IR>. The source of the causal relationships was either a verbal descrip-tion of the linkages between two concepts or the
graphical display of information such as in Table 2. Each causal relationship is assigned a “polarity,” either positive (+) for an influence in the same sense of direc-tion (e.g., positive slope) or negative (−) for an effect in the opposite directions (e.g., negative slope; Senge, 1990). The polarity was identified by observing the verbs employed describing the linkages of two variables or inferred from basic accounting principles (Tables A.1 and A.2 in the Appendix show all the positive and neg-ative linkages identified). As an example, Figure 3 por-trays the upper part of the resource map (shadow variables are in grey colour).
The analysis of the dynamic complexity represented in the resource map displays that ENI's value creation pro-cess is driven by mostly positive linkages between vari-ables (96 linkages mostly concentrated in the productive and human capital areas) rather than by negative links (28 linkages mostly in the productive capital area). Busi-ness processes generate cash that is reinvested in the business growing the resources even more and leading to positive linkages and outcomes. Managerial actions drive tangible and intangible resources to generate value creation processes. Thus, value creation is a positive feed-back process driven by managers to perpetuate the growth of a company over time and create value for a variety of internal and external stakeholders.
As shown in the complete resource map (Figure 4), negative linkages are usually cost‐related to either finan-cial or environmental impacts rather than negative effects from resources constraining the business. There is only one exception in the case of investments in technologies, which has a negative link as it reduces the negative impact of environmentally damaging activities. These results illustrate the basic principle in financial account-ing that costs are negative for the business profitability so it is important to contain them. It is also noteworthy that no negative polarities involve variables from the human capital illustrating the basic principle of knowl-edge resources are scale‐free resources. Scale‐free resources are resources with the potential to be used in multiple applications without affecting their usability, for example, not curtailing the positive feedback loops in a business.
The adoption of the SDM‐Doc software allows evaluat-ing the dynamic complexity responsible for value crea-tion. First, there are 61 concepts (21 resources and 40 capabilities and factors, with 24 investment and opera-tional processes) connected through 124 causal links which generate 301 feedback loops. Additionally, the analysis reveals that ENI's strategy is heavily anchored in a large number of positive feedback loops: there are 254 positive (or reinforcing) and just 47 negative (or balancing) feedback loops.
TABLE 3 Typologies of integrated reporting capitals/resources in the resource map
Capitals in the integrated report
Resources in the resource mapping
Financial Financial structure Liquidity reserves
Productive Onshore and offshore plants Pipelines and storage plants Liquefaction plants Refineries
Distribution networks Power plants
Buildings and other equipment Hydrocarbon (oil and gas) reserves Intellectual Technologies, ICT, and intellectual property
Corporate internal procedures/management and control systems/
Corporate governance + integrated risk management
Human Know‐how and skills/experience People engagement
Diversity
Health & safety of people Social and
relationship
Relationship with stakeholders ENI brand + reputation
Natural Natural resources (air, water, soil,…) Biorefinery and alternative energy sources
Table 4 shows the number (and relative percentage)
of feedback loops affecting each of the
capitals/resources and, subsequently, classified accord-ing to their typology (positive and negative). These data can identify resources that are most relevant to ENI's value creation. Additionally, Table 4 indicates further information useful to understand the resource relevance in terms of model structure, as discussed in the research methodology. With 21 resources, the system is a high‐ order system whose behaviour is difficult to predict due to extensive cause–effect chains and a high number of very long feedback loops. However, the business seems to be concentrated in key hotspots of activity given their high density of feedback loops. In our case study, as shown by Table 4, the critical resources are Liquidity reserves and Know‐how, skills, and experi-ence, which concentrate approximately 82% of the feed-back loops, and are characterized by a fairly similar proportion of positive and negative feedback loops, with ratios between positive and negative loops of 6.03 and 5.68, respectively. Moreover, results highlight that the ENI's resources with the highest ratios belong to the
productive capital, for example, hydrocarbon (oil and gas) reserves with a ratio of 12.33. Among the other resources that can be considered as intangible, the highest numbers of feedback loops refer to technologies, ICT, and intellectual property (163) and corporate inter-nal procedures/management and control systems (122). Notably, the two resources aforementioned also display quite similar ratios (respectively, 5.04 and 3.52). Inter-estingly, natural resources are not part of any feedback loop, and related activities, such as environmental and social impacts, are just in only one feedback loop.
Table 5 presents the same information organized in Table 4, however in reference to the other variables (or concepts) of the resource map. There are some concepts that stand out for the number of loops going through them: two related to the financial capital (investments and cash flow from operations) and two to the human
capital (employment and job enhancement and
recruiting + education + knowledge management) but there are quite dissimilar ratios.
Table 5 confirms that the minimum and the maximum number of variables per loop are respectively of 3–23 for
positive loops and 2–21 for negative loops. As underlined, loop length not only can be employed to evaluate the structural complexity of a mental model corresponding to a specific dynamic system under analysis (see Schaffernicht & Groesser, 2014), but it can also be consid-ered as a proxy of how the effects of our actions (in this case, value creation stemming from the organization's policies) occur across the business domain under analysis (see Verburgh, 1994). In detail, longer loops are more likely (than shorter loops) to span across the whole busi-ness domain, involving various stakeholders, organiza-tional layers, and geographical areas. Subsequently, they could play a relevant role in revealing hidden pathways for value creation, or paths of value creation, which will require a definite effort by the organization management to be properly exploited.
Interestingly, Table 5 also shows that there is an important number of concepts that do not have any
feedback loop associated with them offering the impres-sion of ad hoc activities.
5 | D I S C U S S I O N
According to our research questions, this study primarily offers evidence on how adopting qualitative SD tech-niques to reframe the information are embedded in cor-porate reports and provide new knowledge in terms of corporate reporting. In this context, the combination of <IR> with qualitative SD (specifically with resource mapping) is suitable to support visualizing organizational capitals (or resources) and their interconnections to com-municate the unique value‐creation story of the organiza-tion in a comprehensive and transparent way (Barnabè, 2016). Specifically, the development of the <IR>‐based resource map requires the critical reinterpretation and
TABLE 4 ENI's integrated reporting capitals, feedback processes, and variable link details ENI's IR typology of capital ENI's capital/resource Total no. of feedback loops (and “% ”) No. of positive feedback loop and min and max length of n of variables No. of negative feedback loops and min and max length of n of variables +/ − Ratio
Variables in/out counts In/out ratio In links by polarity +|− Out links by polarity +|− Financial Liquidity reserves 246 (81.7) 211 [6,23] 35 [2,21] 6.03 3|2 1.50 1|2 2|0 Financial structure 2 (0.7) 2 [3,3] 0 [0,0] NA 1|2 0.50 1|0 2|0 Productive Liquefaction plants 168 (55.8) 154 [6,23] 14 [2,21] 11.00 2|3 0.67 1|1 3|0 Onshore and offshore plants 160 (53.2) 136 [6,23] 24 [2,21] 5.67 2|3 0.67 1|1 3|0 Pipelines and storage plants 155 (51.5) 135 [6,23] 20 [2,19] 6.75 2|3 0.67 1|1 3|0 Refineries 128 (42.5) 118 [8,23] 10 [2,21] 11.80 2|3 0.67 1|1 3|0 Hydrocarbon (oil and gas) reserves 80 (26.6) 74 [6,22] 6 [2,17] 12.33 2|1 2.00 1|1 1|0 Distribution networks 46 (15.3) 42 [10,23] 4 [2,21] 10.50 2|2 1.00 1|1 2|0 Power plants 0 (0.0) 0 [0,0] 0 [0,0] NA 1|4 0.25 1|0 4|0 Buildings and other equipment 0 (0.0) 0 [0,0] 0 [0,0] NA 1|3 0.33 1|0 3|0 Intellectual Technologies, ICT, and intellectual property 163 (54.2) 136 [7,23] 27 [8,21] 5.04 1|4 0.25 1|0 4|0 Corporate internal
procedures/management and control
systems 122 (40.5) 95 [8,23] 27 [8,21] 3.52 1|2 0.50 1|0 2|0 Corporate governance/ integrated risk management 0 (0.0) 0 [0,0] 0 [0,0] NA 1|1 1.00 1|0 1|0 Human Know ‐how and skills/experience 247 (82.1) 210 [3,23] 37 [6,21] 5.68 1|8 0.12 1|0 8|0 Health & safety of people 16 (5.3) 14 [3,21] 2 [16,16] 7.00 1|2 0.50 1|0 2|0 People engagement 3 (1.0) 3 [4,7] 0 [0,0] NA 1|2 0.50 1|0 2|0 Diversity 0 (0.0) 0 [0,0] 0 [0,0] NA 1|2 0.50 1|0 2|0 Social and relationship ENI brand + reputation 6 (2.0) 6 [3,7] 0 [0,0] NA 1|3 0.33 1|0 3|0 Relationship with stakeholders 5 (1.7) 5 [3,7] 0 [0,0] NA 1|3 0.33 1|0 3|0 Natural Biorefinery and alternative energy sources 64 (21.3) 58 [10,22] 6 [11,13] 9.67 1|3 0.33 1|0 3|0 Natural resources (air, water, soil, … ) 0 (0.0) 0 [0,0] 0 [0,0] NA
TABLE 5 ENI's integrated reporting concepts, feedback processes, and variable link details Concept in the resource map (F, flow; A, auxiliary; C, constant) Total no. of feedback loops (and “% ”) No. of positive feedback loops and min and max length of n of variables No. of negative feedback loops and min and max length of n of variables +/ − Ratio
Variables in/out counts In/out ratio In links by polarity +| − Out links by polarity +| − Employment and job enhancement (A) 248 (82.4) 211 [3,23] 37 [6,21] 5.7 10|4 2.50 10|0 4|0 Recruiting + education + knowledge management (F,A) 247 (82.1) 210 [3,23] 37 [6,21] 5.68 1|2 0.50 1|0 2|0 Investments (F,A) 245 (81.4) 211 [6,23] 34 [2,21] 6.21 1|5 0.20 1|0 4|1 Cash flow from operations (F,A) 244 (81.1) 211 [6,23] 33 [8,21] 6.39 10|1 10.00 10|0 1|0 Technological upgrade (A) 225 (74.8) 193 [6,23] 32 [6,21] 6.03 2|6 0.33 2|0 6|0 Oil/gas process for transportation (F,A) 200 (66.4) 177 [6,23] 23 [2,21] 7.70 5|3 1.67 5|0 2|1 Oil/gas transported to refineries (F,A) 175 (58.1) 154 [8,23] 21 [2,21] 7.33 4|3 1.33 4|0 2|1 Oil/gas extracted (F,A) 163 (54.2) 144 [6,23] 19 [2,21] 7.58 4|3 1.33 4|0 2|1 Research and development expenditures (F,A) 163 (54.2) 136 [7,23] 27 [8,21] 5.04 2|1 2.00 2|0 1|0 Oil/gas extraction process (F,A) 147 (48.8) 138 [6,23] 9 [2,18] 15.33 4|3 1.33 4|0 2|1 Application of procedures and system (F,A) 122 (40.5) 95 [8,23] 27 [8,21] 3.52 2|1 2.00 2|0 1|0 Process upgrade (A) 122 (40.5) 95 [8,23] 27 [8,21] 3.52 1|4 0.25 1|0 4|0 Fuel/gas for consumption (F,A) 83 (27.6) 76 [10,23] 7 [2,21] 10.86 2|3 0.67 2|0 2|1 Exploration (F,A) 79 (26.2) 74 [6,22] 5 [13,17] 14.8 1|1 1.00 1|0 1|0 Investment in biorefinery and alternative energy sources (F,A) 64 (21.3) 58 [10,22] 6 [11,13] 9.67 1|2 0.50 1|0 2|0 Oil/gas delivered to market (F,A) 38 (12.6) 34 [13,23] 4 [2,21] 8.50 1|3 0.33 1|0 2|1 Actions for health & safety at work (F,A) 16 (5.3) 14 [3,21] 2 [16,16] 7.00 4|1 4.00 4|0 1|0 Brand management (F,A) 6 (2.0) 6 [3,7] 0 [0,0] NA 3|1 3.00 3|0 1|0 stakeholders engagement + projects for local development + strategic partnership (F,A) 5 (1.7) 5 [3,7] 0 [0,0] NA 9|1 9.00 9|0 1|0 Actions for ENI's people engagement (F,A) 3 (1.0) 3 [4,7] 0 [0,0] NA 5|1 5.00 5|0 1|0 Customers and suppliers satisfaction (A) 3 (1.0) 3 [3,7] 0 [0,0] NA 3|1 3.00 3|0 1|0 Bank loans + bonds + hedging (F,A) 2 (0.7) 2 [3,3] 0 [0,0] NA 3|1 3.00 3|0 1|0 Dividends (F,A) 1 (0.3) 0 [0,0] 1 [2,2] 0.00 1|2 0.50 1|0 1|1 Environmental and social impacts (A) 1 (0.3) 1 [3,3] 0 [0,0] NA 8|1 8.00 8|0 1|0 Share price appreciation (A) 1 (0.3) 1 [3,3] 0 [0,0] NA 2|1 2.00 2|0 1|0 (Continues)
TABLE 5 (Continued) Concept in the resource map (F, flow; A, auxiliary; C, constant) Total no. of feedback loops (and “% ”) No. of positive feedback loops and min and max length of n of variables No. of negative feedback loops and min and max length of n of variables +/ − Ratio
Variables in/out counts In/out ratio In links by polarity +| − Out links by polarity +| − Employment and job enhancement (A) 248 (82.4) 211 [3,23] 37 [6,21] 5.7 10|4 2.50 10|0 4|0 Yields (A) 1 (0.3) 1 [3,3] 0 [0,0] NA 1|1 1.00 1|0 1|0 Actions for promotion of human rights and leverage on diversity (F,A) 0 (0.0) 0 [0,0] 0 [0,0] NA 1|1 1.00 1|0 1|0 Audit (C) 0 (0.0) 0 [0,0] 0 [0,0] NA 0|2 0.00 0|0 2|0 Availability of energy sources and green products (A) 0 (0.0) 0 [0,0] 0 [0,0] NA 3|1 3.00 3|0 1|0 Maintenance & development activities (C) 0 (0.0) 0 [0,0] 0 [0,0] NA 0|7 0.00 0|0 7|0 Pollution (gas flared, oil spill, preservation of biodiversity, and containment of water consumption) (F,A) 0 (0.0) 0 [0,0] 0 [0,0] NA 3|2 1.50 3|0 1|1 Transfer of best available technologies and knowhow to host countries (A) 0 (0.0) 0 [0,0] 0 [0,0] NA 2|1 2.00 2|0 1|0 MoU actions (C) 0 (0.0) 0 [0,0] 0 [0,0] NA 0|3 0.00 0|0 3|0 CG and RM procedures and systems (F,A) 0 (0.0) 0 [0,0] 0 [0,0] NA 2|1 2.00 2|0 1|0 New power plants (F,A) 0 (0.0) 0 [0,0] 0 [0,0] NA 1|1 1.00 1|0 1|0 New buildings and equipment (F,A) 0 (0.0) 0 [0,0] 0 [0,0] NA 1|1 1.00 1|0 1|0
reframing of the report data according to the qualitative SD perspective to represent the business architecture in terms of capitals/resources supported by investment
pro-cessesand interconnected through the use of positive and
negative causal relationships to identify critical elements,
hotspots, in the business.
This is coherent with the literature, emphasizing that the main goal of using qualitative SD is not to develop a fully working model able to reproduce the behaviour of a given system, rather support decision‐makers, clients, and stakeholders, creating“a shared language for mutual understanding” (Vennix, 1996, p. 109), gain policy insights (Lane, 2012), foster consensus, “stimulate, feed, and structure the debate” (Pala et al., 2003, p. 706), and provide the conditions for “a useful exercise, [through which] a given problem is effectively «solved» in the sense that the insights from the diagram are so convinc-ing that managers are prepared to act on them without a quantified analysis” (Coyle & Alexander, 1997, p. 206). The <IR>‐based resource map also provides an ana-lytic explanation of the systemic structure of reference, therefore generating new knowledge suitable to:
• support decision‐making with integrated thinking which is a key feature of <IR> (IIRC, 2013a) and a feedback process‐oriented approach (Kazakov & Kunc, 2016; Kunc & Morecroft, 2007);
• identify trade‐offs between capitals and explore how actions focused on one capital may affect other capi-tals (de Villiers et al., 2014);
• assist managers and decision‐makers in figuring out the consequences of their actions and understand that short, medium, and long‐term outcomes of decisions can vary, or even be counterintuitive (Forrester, 1971); • explore how an organization may create value in a multi‐stakeholder and holistic perspective, eventually facilitating stakeholders' participation in management decisions (e.g., Stave, 2002).
With respect to the second aim of this study, that is, verify the potentials of qualitative SD in inspecting the dynamic complexity expressed in a comprehensive corporate report, the analysis of the <IR>‐based resource map pro-vides useful insights. In this regard, the <IR>‐based resource map represents the structure of feedback pro-cesses governing the business. This would eventually allow managers to move away from the more traditional view of business as systems governed by linear thinking and event‐oriented representations, towards the consider-ation of their business as a complex domain, to be analysed in a feedback‐oriented and multi‐actor perspective. Adopting the qualitative SD approach to the business domain reaffirms the need to manage
simultaneously multiple organizational resources to create value in a holistic perspective (Kunc & Morecroft, 2010).
Additionally, our analysis and the use of the SD model documentation software allows analysing and investigat-ing relevant features of an enriched resource map, that is, density, corresponding to the number of loops going through a resource. The resources that contain most of the feedback loops become critical, hotspot for value
crea-tion, for the organization because they are considered indispensable for most of the business processes. The information on the length of loops can be considered as a proxy of the distance existing within a given system between an action being carried out and the result that is the most distant from the origin. Indeed, as Senge (1990, p. 71) points out, “dynamic complexity is present when an action has one set of consequences locally and a very different set of consequences in another part of the system … [or] when obvious interventions produce nonobvious consequences”. In this perspective, the analy-sis of the length of feedback loops contributes to operationalize the structural representation of the mental model implicitly disclosed in an <IR> and increases the awareness about the consequence of a change throughout the dynamic system (Groesser & Schaffernicht, 2012; Verburgh, 1994).
To summarize, density and length of loops are proper-ties of the underlying managers' mental models, now revealed through the process of reframing allowed by the resource map.
In brief, an integrated report, enhanced with resource mapping, offers an explanation of how a specific business is structured and operated, making clear and visible the complex hierarchy of capitals/resources—and their causal connections—at the organization's disposal, acting as a tool to boost the organization's ability to generate value under dynamic complexity (Kunc & Morecroft, 2010). Notably, our results also demonstrate how a com-bined use of the <IR> concepts and guidelines, together with a qualitative SD map (the resource map), may reduce the burden of data collection and modelling and improve the focus on the components of the business and the dynamic complexity generated by their interac-tions (Wolstenholme, 1999).
6 | C O N C L U S I O N
Because Gary et al. (2008) presented a view of the contri-bution of SD to strategy, there have been important advances in this area. More recently, articles in the man-agement literature have demonstrated an increasing acceptance of SD for research in the area of resource‐
based modelling and mental models (e.g., Gary & Wood, 2011; Kunc & Morecroft, 2010). However, there are fewer developments in the area of corporate reporting. This article contributes to expanding the previous literature on the application of qualitative SD in the field of man-agement accounting, providing additional evidence on the procedure and potential use of integrating a qualita-tive perspecqualita-tive into the practices of corporate reporting. Specifically, the combination of <IR> and resource map-ping, as an example of integrating qualitative SD into accounting, can provide important contributions to reframing corporate reporting information into new knowledge, hence, revealing the dynamic complexity embedded in business models and its impact on value creation (Kazakov & Kunc, 2016). Therefore, this article may represent a first step in a new approach to comple-ment traditional accounting reporting with selected infor-mation related to the dynamic complexity embedded in the business such as the ratio between positive and nega-tive feedback loops and the density of feedback loops in critical components of the business.
This study has some limitations that provide the basis for future research. First, the study is only applied to one company and by one team of researchers. Future work can make comparative studies using more than one com-pany (also belonging to different industries), and more than one team can work in parallel to cross‐evaluate their resource maps. Second, the study analysed one report so there is not enough evidence to suggest that the dynamic complexity here represented reflects all of the deep inter-connections among variables affecting the organization's value creation. Future work should compare multiple reports over time and generate a unique resource map reflecting the most common elements. Third, our study is based on the development of a qualitative resource map. Not all of the characters defining dynamic complex-ity can be fully represented and embedded into this repre-sentation (e.g., the presence and effect of time delays and nonlinearities, history dependency, and side‐effects of policies).
R E F E R E N C E S
Adams, C. A. (2015). The international integrated reporting council: A call to action. Critical Perspectives on Accounting, 27(1), 23–28. https://doi.org/10.1016/j.cpa.2014.07.001
Akkermans, H. A., & Van Oorschot, K. E. (2005). Relevance assumed: A case study of balanced scorecard development using system dynamics. Journal of the Operational Research Society,
56(8), 931–941. https://doi.org/10.1057/palgrave.jors.2601923 Barnabè, F. (2016). “Representing” value creation: A combined
approach of system dynamics and integrated reporting for the airline sector. International Journal of Applied Systemic Studies,
6(3), 202–222. https://doi.org/10.1504/IJASS.2016.079085
Barnabè, F., & Busco, C. (2012). The causal relationships between performance drivers and outcomes: Reinforcing balanced score-cards' implementation through system dynamics models.
Journal of Accounting and Organizational Change, 8(4), 528–538. https://doi.org/10.1108/18325911211273518
Barney, J. B. (1986). Strategic factor markets: Expectations, luck and business strategy. Management Science, 32(10), 1231–1241. https://doi.org/10.1287/mnsc.32.10.1231
Capelo, C., & Ferreira Dias, J. (2009). A system dynamics‐based sim-ulation experiment for testing mental model and performance effects of using the balanced scorecard. System Dynamics Review,
25(1), 1–34. https://doi.org/10.1002/sdr.413
Coyle, R. G., & Alexander, M. D. W. (1997). Two approaches to qualitative modelling of a nation's drugs trade. System Dynamics
Review, 13(3), 205–222. https://doi.org/10.1002/(SICI)1099‐ 1727(199723)13:3<205::AID‐SDR126>3.0.CO;2‐P
Deegan, C., & Blomquist, C. (2006). Stakeholder influence on corpo-rate reporting: an exploration of the interaction between WWF‐ Australia and the Australian minerals industry. Accounting,
Organizations and Society, 31(4–5), 343–372. https://doi.org/ 10.1016/j.aos.2005.04.001
Dierickx, I., & Cool, K. (1989). Asset stock accumulation and sus-tainability of competitive advantage. Management Science,
35(12), 1504–1511. https://doi.org/10.1287/mnsc.35.12.1504 Doyle, J. K., Radzicki, M. J., & Trees, W. S. (2008). Measuring
change in mental models of complex dynamic systems. In H. Qudrat‐Ullah, M. J. Spector, & P. Davidsen (Eds.), Complex
deci-sion making: Theory and practice(pp. 269–294). Berlin: Springer‐ Verlag.
Eberlein, R. L., & Peterson, D. W. (1992). Understanding models with Vensim™. European Journal of Operational Research,
59(1), 216–219. https://doi.org/10.1016/0377‐2217(92)90018‐5 Eccles, R. G., & Krzus, M. P. (2011). One Report. In Integrated
Reporting for a Sustainable Strategy. New York: Wiley and Sons. Eden, C. (1992). On the nature of cognitive maps. Journal of
Man-agement Studies, 29(3), 261–265. https://doi.org/10.1111/j.1467‐
6486.1992.tb00664.x
ENI. (2015). Integrated Annual Report 2015, Roma. Retrieved November 10, 2016, from https://www.eni.com/docs/en_IT/ enicom/company/integrated‐annual‐report‐2015.pdf.
Ford, D., & Sterman, J. D. (1998). Expert knowledge elicitation for improving mental and formal models. System Dynamics Review,
14(4), 309–340. https://doi.org/10.1002/(SICI)1099‐1727(199824)
14:4<309::AID‐SDR154>3.0.CO;2‐5
Forrester, J. W. (1961). Industrial dynamics. Cambridge: The M.I.T. Press.
Forrester, J. W. (1968). Principle of systems. Cambridge: The M.I.T. Press.
Forrester, J. W. (1971). Counterintuitive behavior of social systems.
Technology Review, 73(3), 52–68.
Forrester, J. W. (1980). Information sources for modeling the national economy. Journal of the American Statistical
Associa-tion, 75(371), 555–566. https://doi.org/10.1080/01621459.1980. 10477508
Gary, M. S., Kunc, M., Morecroft, J. D. W., & Rockart, S. F. (2008). System dynamics and strategy. System Dynamics Review, 24(4), 407–429. https://doi.org/10.1002/sdr.402
Gary, M. S., & Wood, R. E. (2011). Mental models, decision rules, and performance heterogeneity. Strategic Management Journal,
32(6), 569–594. https://doi.org/10.1002/smj.899
Giorgino, M. C., Supino, E., & Barnabè, F. (2017). Corporate disclo-sure, materiality, and integrated report: An event study analysis.
Sustainability, 9(12), 2182. https://doi.org/10.3390/su9122182 Gray, R., Kouhy, R., & Lavers, S. (1995). Corporate social and
environmental reporting: A review of the literature and a longitu-dinal study of UK disclosure. Accounting, Auditing & Accountability Journal, 8(2), 47–77. https://doi.org/10.1108/ 09513579510146996
Groesser, S. N. (2013). Co‐evolution of standards in innovation
sys-tems: The dynamics of voluntary and legal building codes. Berlin: Springer. https://doi.org/10.1007/978‐3‐7908‐2858‐0 Groesser, S. N., & Schaffernicht, M. (2012). Mental models of
dynamic systems: Taking stock and looking ahead. System
Dynamics Review, 28(1), 46–68. https://doi.org/10.1002/sdr.476 Größler, A. (2004). A content and process view on bounded
ratio-nality in system dynamics. Systems Research and Behavioral
Science, 21(4), 319–330. https://doi.org/10.1002/sres.646 Humphreys, K. A., Gary, M. S., & Trotman, K. T. (2015). Dynamic
decision making using the balanced scorecard framework. The
Accounting Review, 91(5), 1441–1465.
International Integrated Reporting Council (IIRC). (2013a). The international <IR> framework. Retrieved December 20, 2016, from http://www.theiirc.org/international‐ir‐framework/. International Integrated Reporting Council (IIRC). (2013b).
Capi-tals. Background paper for <IR>. Retrieved December 20, 2016, from http://integratedreporting.org/wp‐content/uploads/ 2013/03/IR‐Background‐Paper‐Capitals.pdf.
Kaplan, R. S. (2012). The balanced scorecard: comments on bal-anced scorecard commentaries. Journal of Accounting and
Organizational Change, 8(4), 539–545. https://doi.org/10.1108/ 18325911211273527
Kazakov, R., & Kunc, M. (2016). Foreseeing the dynamics of strategy: An anticipatory systems perspective. Systemic Practice
and Action Research, 29(1), 1–25.
Kim, D. H. (2001). Organizing for learning strategies for knowledge creation and enduring change. Waltham: Pegasus Communications.
Kim, H., & Andersen, D. F. (2012). Building confidence in causal maps generated from purposive text data: Mapping transcripts of the federal reserve. System Dynamics Review, 28(4), 311–328. https://doi.org/10.1002/sdr.1480
Kopainsky, B., & Luna‐Reyes, L. F. (2008). Closing the loop: Pro-moting synergies with other theory building approaches to improve system dynamics practice. Systems Research and
Behav-ioral Science, 25(4), 471–486. https://doi.org/10.1002/sres.913 Kunc, M. (2007). Portraying managerial dynamic capabilities: A
case study in the fast‐moving consumer goods industry.
Interna-tional Journal of Learning and Intellectual Capital, 4(1–2), 92–110. https://doi.org/10.1504/IJLIC.2007.013825
Kunc, M., & Morecroft, J. D. W. (2007). System dynamics modelling for strategic development. In R. Dyson, & F. O'Brien (Eds.),
Supporting strategy: Frameworks, methods and models (pp. 157–190). Chichester: John Wiley.
Kunc, M., & Morecroft, J. D. W. (2009). Resource‐based strategies and problem structuring: Using resource maps to manage resource systems. Journal of the Operational Research Society,
60(2), 191–199. https://doi.org/10.1057/palgrave.jors.2602551 Kunc, M., & Morecroft, J. D. W. (2010). Managerial decision‐
making and firm performance under a resource‐based para-digm. Strategic Management Journal, 31(11), 1164–1182. https://doi.org/10.1002/smj.858
Kunc, M., & O'Brien, F. A. (2017). Exploring the development of a methodology for scenario use: Combining scenario and resource mapping approaches. Technological Forecasting and Social
Change, 124, 150–159. https://doi.org/10.1016/j.techfore.2017. 03.018
Lacagnina, V., & Provenzano, D. (2009). In Á. Matias, P. Nijkamp, & M. Sarmento (Eds.), An optimized system dynamics approach
for a hotel chain management(pp. 35–49). HD: Physica‐Verlag. Lacagnina, V., & Provenzano, D. (2011). Hotel chain performance: A gravity‐DEA approach. In Á. Matias, P. Nijkamp, & M. Sarmento (Eds.), Tourism economics: Impact analysis (pp. 171–181). HD: Physica‐Verlag.
Lane, D. C. (2008). The emergence and use of diagramming in system dynamics: A critical account. Systems Research and
Behavioral Science, 25(1), 3–23. https://doi.org/10.1002/sres.826 Lane, D. C. (2012). What is a“policy insight”? Systems Research and
Behavioral Science, 29(6), 590–595. https://doi.org/10.1002/sres.
2148
Luna‐Reyes, L. F., & Andersen, D. L. (2003). Collecting and analyz-ing qualitative data for system dynamics: Methods and models.
System Dynamics Review, 19(4), 271–296. https://doi.org/10. 1002/sdr.280
Martinez‐Moyano, I. J. (2012). Documentation for model transpar-ency. System Dynamics Review, 28(2), 199–208. https://doi.org/ 10.1002/sdr.1471
Miles, M. B., Huberman, A. M., & Saldana, J. (2013). Qualitative data analysis. In A methods sourcebook. London: Sage Publications.
Morecroft, J. D. W. (2007). Strategic modelling and business
dynam-ics. Chichester: Wiley.
Pala, Ö., Vennix, J. A. M., & Van Mullekom, T. (2003). Validity in SSM: neglected areas. Journal of the Operational Research
Society, 54(7), 706–712. https://doi.org/10.1057/palgrave.jors. 2601577
Richardson, G. P., & Pugh, A. (1981). Introduction to system
dynam-ics modeling with dynamo. Waltham: Pegasus Communications. Roca, L. C., & Searcy, C. (2012). An analysis of indicators disclosed in corporate sustainability reports. Journal of Cleaner Production, 20(1), 103–118. https://doi.org/10.1016/j.jclepro. 2011.08.002
Ryan, B., Scapens, R. W., & Theobald, M. (2002). Research method &
methodology in finance and accounting (2nd ed.). London: Thomson.
Schaffernicht, M. (2010). Causal loop diagrams between structure and behaviour: A critical analysis of the relationship between polarity, behaviour and events. Systems Research and Behavioral
Science, 27(6), 653–666. https://doi.org/10.1002/sres.1018 Schaffernicht, M., & Groesser, S. N. (2011). A comprehensive
European Journal of Operational Research, 210(1), 57–67. https://doi.org/10.1016/j.ejor.2010.09.003
Schaffernicht, M., & Groesser, S. N. (2014). The SEXTANT software: A tool for automating the comparative analysis of mental models of dynamic systems. European Journal of Operational
Research, 238(2), 566–678. https://doi.org/10.1016/j.ejor.2014. 04.002
Senge, P. M. (1990).“The fifth discipline,” the art and practice of the
learning organization. NY: Doubleday‐Currency.
Snabe, B., & Größler, A. (2006). System dynamics modelling for strategy implementation—case study and issues. Systems
Research and Behavioral Science, 23(4), 467–481. https://doi. org/10.1002/sres.773
Spector, J. M., Christensen, D. L., Sioutine, A. V., & McCormack, D. (2001). Models and simulations for learning in complex domains: Using causal loop diagrams for assessment and evalu-ation. Computers in Human Behavior, 17(5), 517–545. https:// doi.org/10.1016/S0747‐5632(01)00025‐5
Stave, K. A. (2002). Using system dynamics to improve public par-ticipation in environmental decisions. System Dynamics Review, 18(2), 139–167. https://doi.org/10.1002/sdr.237 Sterman, J. D. (2000). Business dynamics. In System thinking and
modeling for a complex world. Boston: McGraw‐Hill.
Torres, J. P., Kunc, M., & O'Brien, F. (2017). Supporting strategy using system dynamics. European Journal of Operational
Research, 260(3), 1081–1094. https://doi.org/10.1016/j.ejor.2017. 01.018
Vennix, J. A. M. (1996). Group model building, facilitating team
learning using system dynamics. Chichester: Wiley.
Verburgh, L. (1994). Participative policy modeling applied to the
health care insurance industry. Netherlands: PhD thesis, Univer-sity of Nijmegen.
de Villiers, C., Rinaldi, L., & Unerman, J. (2014). Integrated Reporting: Insights, gaps and an agenda for future research.
Accounting, Auditing & Accountability Journal, 27(7), 1042–1067. https://doi.org/10.1108/AAAJ‐06‐2014‐1736 Warren, K. (2008). Strategic management dynamics. Chichester:
Wiley.
Wolstenholme, E. F. (1999). Qualitative vs quantitative modelling: The evolving balance. The Journal of Operational Research
Society, 50(4), 422–428. https://doi.org/10.1057/palgrave.jors. 2600700
Wolstenholme, E. F., & Coyle, R. G. (1983). The development of sys-tem dynamics as a methodology for syssys-tem description and qualitative analysis. Journal of the Operational Research Society,
34(7), 569–581. https://doi.org/10.1057/jors.1983.137
Yin, R. K. (1994). Case study research: Design and methods (2nd ed.). Sage: Newbury Park, CA.
How to cite this article: Giorgino MC, Barnabè
F, Kunc M. Integrating qualitative system dynamics with accounting practices: The case of integrated reporting and resource mapping. Syst Res Behav Sci. 2020;37:97–118.https://doi.org/10.1002/sres.2602
A P P E N D I X A .
TABLE A.1 Positive linkages in ENI's resource map
Cause Effect Polarity
Financial Capital
Bank loans + bonds + hedging Financial structure +
Cash flow from operations Liquidity reserves +
Dividends Share price appreciation +
Financial structure Share price appreciation +
Financial structure Yields +
Investments Bank loans + bonds + hedging +
Oil/gas delivered to market Cash flow from operations +
Share Price appreciation Bank loans + bonds + hedging +
Yields Bank loans + bonds + Hedging +
Productive Capital
Building and other equipment Employment and job enhancement +
Building and other equipment Oil/gas extracted +
Building and other equipment Oil/gas extraction process +
Distribution networks Employment and job enhancement +
TABLE A.1 (Continued)
Cause Effect Polarity
Exploration Hydrocarbon (oil and gas) reserves +
Fuel/gas for consumption Distribution networks +
Investments Exploration +
Liquefaction plants Employment and job enhancement +
Maintenance & development activities New buildings and equipment +
Maintenance & development activities New power plants +
Maintenance & development activities Oil/gas extracted +
Maintenance & development activities Oil/gas extraction process + Maintenance & development activities Oil/gas process for transportation + Maintenance & development activities Oil/gas transported to refineries +
New buildings and equipment Buildings and other equipment +
New power plants Power plants +
Oil/Gas extraction process Onshore and offshore plants +
Oil/Gas extracted Pipelines and storage plants +
Oil/Gas process for transportation Liquefaction plants +
Oil/Gas transported to refineries Refineries +
Onshore and offshore plants Employment and job enhancement +
Pipelines and storage plants Employment and job enhancement +
Power Plants Employment and job enhancement +
Power Plants Fuel/gas for consumption +
Power Plants Oil/gas process for transportation +
Power Plants Oil/gas transported to refineries +
Process upgrade Oil/gas process for transportation +
Process upgrade Oil/gas transported to refineries +
Refineries Employment and job enhancement +
Technological upgrade Oil/gas extracted +
Technological upgrade Oil/gas extraction process +
Technological upgrade Oil/gas process for transportation +
Intellectual Capital
Application of procedures and systems Corporate internal procedures/management and control systems
+
Audit Application of procedures and systems +
Audit CG and RM procedures and systems +
CG and RM procedures and systems Corporate governance + integrated risk management + Corporate internal procedures/management and control systems Process upgrade +
Investments Research and development expenditures +
Research and development expenditures Technologies, ICT, and intellectual property + Technologies, ICT and intellectual property Availability of energy sources and green products +
Technologies, ICT and intellectual property Technological upgrade +
Technologies, ICT and intellectual property Transfer of best available technologies and know how to host countries
+
TABLE A.1 (Continued)
Cause Effect Polarity
Human Capital
Actions for ENI's people engagement People engagement +
Actions for health & safety at work Health & safety of people + Actions for promotion of human rights and leverage on diversity Diversity +
Diversity stakeholders engagement + projects for local
development + strategic partnership
+
Employment and job enhancement Actions for health & safety at work + Employment and job enhancement Actions for promotion of human rights and leverage on
diversity
+ Employment and job enhancement Recruiting + education + knowledge management +
Health & safety of people Actions for ENI's people engagement +
Health & safety of people Employment and job enhancement +
Maintenance & development activities Actions for health & safety at work +
Process upgrade Actions for health & safety at work +
Recruiting + education + knowledge management Actions for ENI's people engagement + Recruiting + education + knowledge management Know‐how and skills/experience +
People engagement Brand management +
People engagement stakeholders engagement + projects for local development + strategic partnership
+
Diversity Actions for ENI's people engagement +
Know‐how and skills/experience Actions for ENI's people engagement + Know‐how and skills/experience Application of procedures and systems +
Know‐how and skills/experience CG and RM procedures and systems +
Know‐how and skills/experience Employment and job enhancement +
Know‐how and skills/experience Research and development expenditures + Know‐how and skills/experience stakeholders engagement + projects for local
development + strategic partnership
+
Know‐how and skills/experience Technological upgrade +
Know‐how and skills/experience Transfer of best available technologies and know how to host countries
+
Technological upgrade Actions for health & safety at work +
Social and relationship capital
Availability of energy sources and green products stakeholders engagement + projects for local development + strategic partnership
+
Brand management ENI brand + reputation +
Customers and suppliers satisfaction Brand management +
Employment and job enhancement stakeholders engagement + projects for local development + strategic partnership
+
ENI brand + Reputation Actions for ENI's people engagement +
ENI brand + reputation Customers and suppliers satisfaction +
ENI brand + reputation stakeholders engagement + projects for local development + strategic partnership
+
TABLE A.1 (Continued)
Cause Effect Polarity
Environmental and social impacts stakeholders engagement + projects for local development + strategic partnership
+
MoU actions Customers and suppliers satisfaction +
MoU actions stakeholders engagement + projects for local
development + strategic partnership
+
Relationship with stakeholders Brand management +
Relationship with stakeholders Customers and suppliers satisfaction + Stakeholders engagement + projects for local development +
strategic partnership
Relationship with stakeholders + Transfer of best available technologies and know how to host
countries
stakeholders engagement + projects for local development + strategic partnership
+
Natural capital
Biorefinery and alternative energy sources Availability of energy sources and green products + Biorefinery and alternative energy sources Employment and job enhancement + Investments Investment in biorefinery and alternative energy sources + Investment in biorefinery and alternative energy sources Biorefinery and alternative energy sources + Oil/gas delivered to market Availability of energy sources and green products + Pollution (gas flared, oil spill, preservation of biodiversity, and
containment of water consumption)
![FIGURE 1 Business model functioning and positioning (IIRC, 2013a, p. 13) [Colour figure can be viewed at wileyonlinelibrary.com]](https://thumb-eu.123doks.com/thumbv2/123dokorg/4671016.43159/3.892.126.774.668.1063/figure-business-functioning-positioning-colour-figure-viewed-wileyonlinelibrary.webp)
![FIGURE 4 ENI's complete resource map [Colour figure can be viewed at wileyonlinelibrary.com]](https://thumb-eu.123doks.com/thumbv2/123dokorg/4671016.43159/11.892.78.818.67.692/figure-eni-complete-resource-colour-figure-viewed-wileyonlinelibrary.webp)