Università degli Studi di Ferrara
DOTTORATO DI RICERCA IN
"SCIENZE BIOMEDICHE, ENDOCRINOLOGICHE E
NEUROFISIOLOGICHE"
CICLO XXII
COORDINATORE Prof. ALESSANDRO MARTINI
Microgravity affects the hair cell ionic currents of the frog semicircular canals
Settore Scientifico Disciplinare BIO/09
Dottorando Tutore
Dott. LEPARULO ALESSANDRO Prof. ROSSI MARIA LISA
________________________ ____________________
(firma) (firma)
SUMMARY
INTRODUCTION………... pag. 3 Morphology………... pag. 3 Semicircular canal biophysics……… pag. 8 Transduction mechanism………. pag. 8 The hair cell ionic currents………. pag. 15
The calcium current………...……….. pag. 15 The potassium currents……… pag. 30 Hair cell passive properties……….. pag. 31 General properties of the currents………... pag. 31 Currents evoked from -40 mV holding potential………. pag. 31 Currents evoked from more negative holding potentials……… pag. 37 The kinetics of fast and slow removal of IA and IKD inactivation………... pag. 40
IA and IKD dissection………...………... pag. 44
IA general properties………. pag. 45
IKD general properties………...……… pag. 48
Isolation and properties of IKCa……… pag. 48
Steady-state inactivation curves for IA and IKD……… pag. 51
Cell subpopulations……….. pag. 51 Currents evoked by sinusoidal voltage commands……….. pag. 51 Comments on voltage-dependent potassium currents………... pag. 55 Afferent synaptic transmission... pag. 59 Quantal analysis………... pag. 61 1) Analytical fit to mEPSP waveform……….... pag. 61 2) Peak vs. area relation for mEPSPs and mEPSP waveform………... pag. 62 3) Wiener filtering………... pag. 62 4) mEPSP size………... pag. 65 Microgravity……….. pag. 68 MATERIAL AND METHODS………..…… pag. 73 Patch clamp experiments………. pag. 73 Intracellular recordings……….. pag. 75 RESULTS………. pag. 75 Hair cell passive properties... pag. 75 Distinctive current properties……….. pag. 76 The calcium current………. pag. 80 Transient and persistent potassium current dissection………... pag. 83
Comparison of IA general properties………... pag. 85
Comparison of IKD general properties……… pag. 87
Isolation and comparison of IKCa amplitudes……….…… pag. 88
Steady-state inactivation and IA inactivation removal……….. pag. 89
Sinusoidal voltage commands mimic the physiological membrane potential shifts... pag. 93 Intracellular recordings in the isolated and intact frog labyrinth………... pag. 97 DISCUSSION………... pag. 100 GENERAL CONCLUSIONS………. pag. 102 REFERENCES………... pag. 103 ACKNOLEDGEMENTS……… pag. 105
INTRODUCTION
Morphology
Vertebrate peripheral vestibular system, also called membranous labyrinth, is an even organ located in the temporal bone. In the frog it comprises: 1) three semicircular canals, that detect head angular accelerations, 2) the utricle and the saccule detecting linear accelerations; 3) amphibian and basilar papillae devoted to a pure auditory function.
The three semicircular canals are positioned orthogonally one to each other and the canal receptors, the hair cells, are located in an enlargement of the canal called ampulla. In the ampulla the hair cells constitute, with supporting and basal cells, the crista ampullaris. The crista is partially embedded in a mucopolisaccaridic structure: the cupula. The labyrinth is filled with endolymph, a fluid having a high potassium concentration. Endolymph bathes the apical membrane of the vestibular receptors, whose basolateral membrane is in contact with perilymph, a fluid whose composition is similar to that of the extracellular fluids. Vestibular receptors are called hair cells owing to the presence of ciliary processes on their apical membrane. Hair cells have two types of cilia: a single kinocilium, located eccentrically, and the stereocilia, whose number largely varies in the different organs and whose height decreases on increasing their distance from the kinocilium. Between kinocilium and stereocilia as well as among adjacent stereocilia are present the so called ‘tip links’ that plays an important role in the mechano-electrical transduction process. The distal portion of the cilia are inserted into the cupula.
First order neurons contacting the hair cells belong to the VIII nerve. In its proximal part the diameter of the VIII nerve increases owing to the presence of the soma of bipolar cells constituting the Scarpa ganglion.
Morphological studies have revealed in the frog only a type of hair cells, called type II and the presence of two types of synapses in the basolateral hair cell membrane: afferent synapses in which the nerve terminals of the VIII nerve afferent fibres represent the post-synaptic elements (post-synaptic vesicles are present in the hair cells near the post-synaptic contacts); efferent synapses (the nerve terminals possess a large number of vesicles and belong to central neurons), in which the postsynaptic element is represented by the hair cells (Mammalian Vestibular Physiology, Eds. VJ Wilson and G Melvill Jones, Plenum Press, NY 1979, pages 5-39). The activation of the efferent pathway exerts either excitation or inhibition of the afferent discharge (Rossi et al., 1980; Rossi and Martini, 1991).
Fig. 1. The frog head and its ear.
Fig. 3. Tridimensional picture of the labyrinth. The plane of the horizontal canal is rotated by 30° with respect to the horizontal plane.
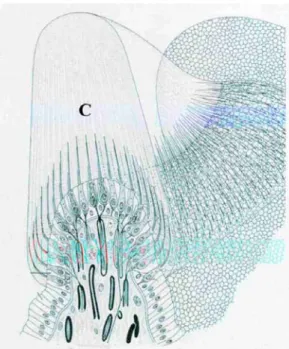
Fig. 4. Hair cells in the crista ampullaris. Note the hair bundles inserted into the cupula (C).
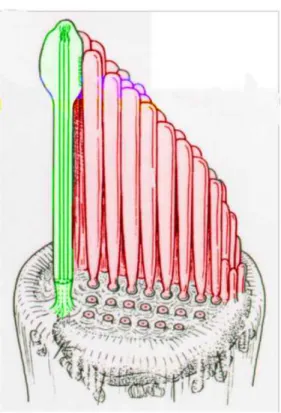
Fig. 5. Kinocilium (green) and stereocilia (red) inserted into the cuticular plate of the hair cell.
Fig. 6. Frog crista ampullaris from a living preparation. PR, peripheral region; IR, intermediate region; CR, central region.
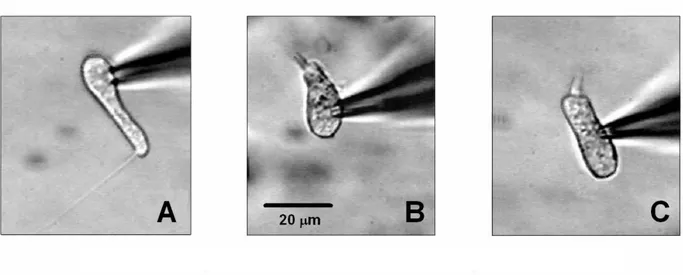
Fig. 7. Video recordings of three different hair cell type: A, club-like; B, pear-like; C, cylinder-like hair cell.
Semicircular canal biophysics
The mechanical events underlying hair cell stimulation have been described by developing a theoretical model called ‘torsion pendulum model’. In this model the semicircular canal is assimilated to a circular torus, having a very small internal radius with respect its curvature radius, and containing a fluid (Mammalian Vestibular Physiology, Eds. VJ Wilson and G Melvill Jones, Plenum Press, NY 1979, pages 41-76). According to the model, following head rotation, and consequently canal rotation, the internal fluid is subjected to a movement, relative to its resting position, owing to the combined action of three forces:
- an inertial force, proportional to the canal angular acceleration and to the endolymph inertial moment;
- a friction force proportional to the endolymph viscosity and to canal angular velocity; - an elastic force, bringing back the cupula, that is proportional to the angular displacement of the cupula itself from its resting position.
The mathematical processing of this model yields to the definition of two time constants: T1 and T2 (with T2 >> T1), whose meaning can be understood by examining the response frequency of the system.
In fact the gain, given as the ratio between the relative displacement of the endolymph and the angular velocity of a sinusoidal stimulus, is constant in a frequency range delimited by the reciprocals of the two time constants (in the frog 1/T2 = 0.6 Hz and 1/T1 = 60 Hz). In this frequency range the system behaves as a faithful transducer of head velocity. For frequencies ranging from 0 and 0.6 Hz, the system transduces acceleration, and for frequencies larger than 60 Hz, the system is a good transductor of the head position. Since most of the normal head movements occur in the frequency range between 0.6 and 60 Hz, it is reasonable to assume that the sensory response of the semicircular canals is normally interpreted by the central nervous system as a measure of head velocity.
Transduction mechanism
Cupula displacement mechanically deflects the kinocilium and the stereocilia inserted into the cupula. Ciliary deflection represents the stimulus for these mechanoreceptors. The asymmetry of the ciliary bundle is correlated with its directional sensitivity, in fact, ciliary deflection towards the kinocilium increases the probability of opening of the transduction channels located in the cilia and increases receptor potential amplitude
Fig. 8. Schematic drawing of the torsion pendulum model for the semicircular canal: R, radius of curvature; r, semicircular canal internal radius; q and η, endolymph density and viscosity. When the head rotates in a direction with an angular acceleration , the canal remains still, so that the inertia of the endolymph produces a cupula deflection in a direction opposite to that of movement. When acceleration ceases, both the endolymph viscous moment and the cupula elastic moment take back the cupula in its resting position.
q
Hyperpolarization Resting Depolarization
Fig. 10. Sites and action of hair cell adaptation. (a) Structural components of the stereocilia associated with transduction and adaptation, showing the electron dense plaques that represent sub-membranous protein complexes. Rotation towards the taller stereocilium exerts force on the tip link and opens MET channels at the stereociliary tip. Tension in the tip link may be adjusted adaptively by myosin arrays (1c, 7a or 15) at either end of the tip link; for example, myosin-1c in the upper plaque tensions the link by climbing up towards the barbed end of the actin filaments. Stereociliary position could also be influenced by the stiffness of the rootlets into the hair cell apex. (b) Hair bundle displacement tensions the tip link (T) which extends the internal and external gating springs causing the channel to go from the closed (C) to the open (O) configuration. Ca2+ entering the stereocilium through the open channel binds at the inner face of the channel and shuts it. This generates force by increasing tension in the gating springs. (c) Following a bundle deflection (top), the channel opens rapidly then recloses adaptively in a high concentration of 2.8 mM Ca2+. Change in Po is plotted against time. When the extracellular Ca2+ concentration is reduced to 0.07 mM Ca2+, a more realistic physiological value closer to that in cochlear endolymph, the adaptation becomes oscillatory at 77 Hz. The resonant frequency of the MET channel varies with hair cell CF.
The receptor response is maximal when acceleration is applied in the canal plane, while a zero response is obtained if acceleration is applied in a plane orthogonal to the plane of the canal itself.
The opening of the transduction channels allows K+ inflow, which generates the receptor potential. The current hypothesis for the explanation of the transduction mechanism considers that stereociliary deflection increases the tip link tension that is translated to the mechano-electrical transduction channels through elastic elements that are called ‘gating springs’; however, up to now the molecular structure of the transduction channels remains unknown. The probability of opening (P0) of the transduction channels is
modulated by the shift of the ciliary tuft up to a maximum value of 100-200 nm,which is less than the diameter of a stereocilia. To maintain the stereociliary movement in this narrow range of operativity and to preserve their high sensitivity to external stimuli, the transduction channels are subjected to many adaptation mechanisms controlled by Ca2+ concentration.
During a maintained displacement of the hair bundle (x), adaptation appears as a decline in the MET channel Po. This decline reflects a translation of the Po-x relationship along
the displacement axis in the direction of the stimulus. At least two adaptation mechanisms can be distinguished on the basis of their different kinetics and mechanical correlates. Fast adaptation in turtle cochlear hair cells has a time constant (τA) of 0.3–
5 ms. Slow adaptation, first reported in frog saccular cells, has a τA of 10–100 ms.
However, both fast and slow mechanisms are now known to coexist in the same hair cell.
The different balance of the two components in turtles and frogs may be due to the fact that turtle hair cells, being auditory in function, are exposed to higher stimulation frequencies than frog vestibular hair cells. The speed of adaptation may therefore be matched to the frequencies to which the cell is exposed. Consistent with this idea, fast adaptation is most conspicuous in mammalian cochlear hair cells with a τA = 4 ms.
Moreover, τA in the turtle varies with hair cell characteristic frequency (CF), and is faster
in the cells tuned to higher frequencies: the corner frequency (1/2πτA) of the high-pass
filter imposed by fast adaptation is approximately two-thirds of the CF. This suggests that fast adaptation may play some role in hair cell frequency selectivity (the ability of the cell to distinguish different frequency components in the stimulus). Further support to this notion arises from the observation that, in physiological Ca2+ concentration, fast
adaptation can display resonance at frequencies in the turtle’s auditory range.
Both types of adaptation are regulated by Ca2+ that enters the stereocilia through highly Ca2+-permeable MET channels. Fast adaptation probably requires a direct interaction of Ca2+ with the MET channels to modulate their probability of opening. On the basis of the effects of intracellular calcium buffers, the distance Ca2+ diffuses to its target is estimated to be short, 15–35 nm from the mouth of the channel. Its resulting action occurs in less than a millisecond. Furthermore, Ca2+ can alter the time constant of channel activation as
well as adaptation, arguing that it is intimately linked with channel gating. In contrast, slow adaptation is considered as an input control, in which a Ca2+–dependent motor controls tension in the elastic elements in series with the channel. There is good evidence to implicate myosin-1c as the motor that drives slow adaptation in vestibular hair cells. One or both phases of adaptation could be mediated through an interaction with calmodulin, which is present at the tips of the stereocilia where it interacts with myosin-1c. Besides the two Ca2+-driven mechanisms, other pathways may modulate the MET channel’s operating range. For example, cyclic adenosine monophosphate (cAMP) shifts the Po-x relation along the displacement axis in the positive direction, with no affect on
fast adaptation. The cAMP effect may be mediated through phosphorylation of the MET channel or the myosin motor by protein kinase A.
A prediction of the gating spring model of transduction is that as the channel opens there is a decrease in hair bundle stiffness, and this is confirmed experimentally. Ca2+ interaction with the channel to modulate its Po will therefore cause the bundle to move,
connecting fast adaptation to bundle motion. In terms of polarity, a positive bundle deflection opens the MET channels and increases Ca2+ concentration, which recloses the channels and causes negative recoil. In contrast, the increase in Ca2+ produced by a positive bundle deflection detaches the myosin from the actin core of the stereocilium. This allows the myosin and its attachment to the tip link to slip down the stereocilium, which leads to further positive displacement of the bundle. Evidence for the range of movement of the tip-link’s upper attachment point comes from the observation that if the tip links are severed with BAPTA (1,2-bis[o-Aminophenoxy]ethane-N,N,N’,N’-tetraacetic acid), the electron dense plaque climbs 50–100 nm closer to the stereociliary tip
A reason for endowing multiple adaptation mechanisms is that the slower mechanism has a wider dynamic range to orient the bundle to a location where fast feedback control of the channels is effective. Thus, fast adaptation may tune the channel for small displacements around a resting position that is continually readjusted by slow adaptation.
Fast adaptation could theoretically participate in auditory frequency selectivity by filtering the MET current or by generating fast hair bundle movements that amplify the mechanical input. Hair bundles in the frog saccule exhibit the ability to mechanically amplify a signal leading to spontaneous oscillations. The oscillations occur at low frequencies (5–50 Hz) and it has been hypothesized that they are driven by the slow myosin motor, biasing the displacement-force relation of the hair bundle into a region of negative slope. In contrast, active bundle movements produced by Ca2+ binding to the
MET channels can in principle occur at kHz frequencies, within the mammalian auditory range. Furthermore, trans-epithelial electrical stimulation of the isolated frog saccule experimentally evokes hair bundle oscillations at frequencies of up to 1 kHz. There is also in vivo evidence for active hair bundle motion at more than 1 kHz in the lizard hearing organ. However, it remains to be verified whether or not active motion of the outer hair-cell bundles can generate sufficient force to produce amplification in the intact mammalian cochlea. Tuning of the MET current in turtle auditory hair cells does not require concomitant active bundle motion because it occurs when the bundle is displaced with a rigid stimulating probe. This suggests that the energy associated with channel gating does not need to move the hair bundle in order to elicit oscillations in the current. The variation in resonant frequency (58–230 Hz), which is within the turtle’s auditory range, may therefore involve differences in the MET channel. Several mechanisms for these differences have been proposed. The adaptation rate or resonant frequency increases with a higher stereociliary Ca2+ concentration, which could be brought about either by increasing the channel’s Ca2+ permeability with CF or by increasing the conductance of the MET channels or their number per stereocilium. The evidence for this mechanism is that the maximum MET current increases with CF, and the rate of adaptation at a given CF varies with the magnitude of the current. It has been recently shown that the channel’s Ca2+ permeability does not change with CF. However, there is evidence for a tonotopic variation in channel kinetics derived from noise analysis of the MET current and from measurements of the time course of current activation. An alternative view of modeling hair bundle amplification, is that both fast and slow adaptation processes combine to produce oscillations at a frequency determined by hair bundle geometry and intracellular Ca2+ dynamics. In the mammalian cochlea, the outer hair cells (OHC) are responsible for generating active mechanical amplification that provides the compressive non-linearity and frequency selectivity of the basilar membrane. The ability of OHCs to elongate and shorten in response to changes in membrane potential is thought to supply the mechanical energy for the process.
Prestin has been identified as the protein responsible for this ‘somatic motility’, concentrated in the lateral wall of the OHC. The voltage sensitivity of prestin is endowed by the intracellular binding of small anions such as Cl−. Targeted deletion of prestin in mice results in an elevated threshold, reduced tuning, and loss of outer hair cell motility; these effects led to conclude that somatic motility alone was responsible for the active process. This conclusion can be criticized on the ground that any feedback process involving multiple elements would be compromised if one element were eliminated. For example, abolition of the endocochlear potential (EP) by treatment with the diuretic furosemide reduces amplification about 30-fold on average, even though the EP is not the source of the active process. Loss of the EP will approximately halve the MET current. Based on the same argument, halving of electromotility in prestin heterozygotes should have produced greater than the twofold elevation in cochlear threshold if somatic motility were the sole source of the active process. Furthermore, although OHC motility may supply the energy for amplification, there is no evidence that it is intrinsically frequency- selective. For cochlear models that reproduce realistically sharp tuning of the basilar membrane, the mechanical feedback from the outer hair cells must occur in a frequency-selective manner to ensure that it will supply force at the appropriate phase of basilar membrane vibration. The required tuning has been ascribed to a mechanical resonance in the tectorial membrane, but it could equally reside in the MET channels. If the channels in mammalian OHCs operate similarly to those in turtle hair cells, the transducer currents and any associated active hair bundle motion will be tuned over a frequency range governed by variations in the speed of fast adaptation. In the past years, evidence has emerged for the existence of at least two distinct Ca2+-mediated mechanisms of hair cell transducer adaptation, which change in speed, range and function. A fast mechanism directly affects MET channel gating, whereas a slower one regulates the mechanical stimulus through the action of one or more unconventional myosins. Further insights into the roles of the different myosins may come from the elucidation of their subcellular localization using post-embedding immunogold techniques, or their modification and deletion in transgenic animals. The fast mechanism confers tuning on the MET channels and may be an important factor in cochlear frequency selectivity. Because adaptation shifts the hair cell’s operating point, it may have an ancillary role in constantly adjusting and optimizing the signal-to-noise ratio of transduction. Cloning the MET channel should shed light as to how the channel interacts with Ca2+ and other subcellular components including myosins. It may also reveal the existence of multiple channel isoforms with Ca2+ affinity or kinetics specialized for operating in different frequency ranges.
Moreover, further electrophysiological studies in the mammalian cochlea will be needed to settle whether or not fast adaptation is present in outer hair cells and whether or not it is sufficiently fast to participate in the active processes. Evidence that this may be the case was recently obtained in rat OHCs, in which transducer currents exhibited fast Ca2+ -dependent adaptation with a τA of less than 0.2 ms, faster than any seen in turtle auditory
hair cells.
The hair cell ionic currents
The calcium current
Ca2+ inflow through basolateral, voltage-gated Ca2+ channels of vestibular hair cells plays a crucial role in signal processing because it sustains transmitter release at the cytoneural junction and regulates membrane excitability (Martini et al., 2000).
The inward current was assessed by stepping the voltage to -20 mV. The current amplitude and waveform did not change if the voltage was stepped from any holding value between -140 and -60 mV: this indicates that, at any voltage below -60 mV, all channels were deactivated and steady-state inactivation was removed. The Ca2+ current had two typical waveforms: one (present in 40% of the cells) was characterized by an initial peak, followed by an exponential decay to a plateau level (current sag component); the other waveform lacked the sag, and the current amplitude was constant throughout the depolarizing step. The sag might have been generated by the opening and the subsequent partial inactivation of a single channel population: however, this view does not explain the absence of the sag in some recordings, nor does it explain the lack of correlation between the sag properties (amplitude and time course) and steady-state current amplitude.
The presence of either of the responses was not correlated with the cell morphology and those cells exhibiting a sag response eventually ended in a plateau-response. Indeed, the mean current amplitude was not stable upon repeating the stimulation protocol (consisting of 20 depolarizing steps, from the holding potential to -70 mV, lasting 40 ms and repeated every 15 s), but it progressively declined to zero (run-down).
The sag component of the current (when present) was lost much earlier than the plateau component. Once the former component had completely disappeared, the latter began a progressive decline towards zero.
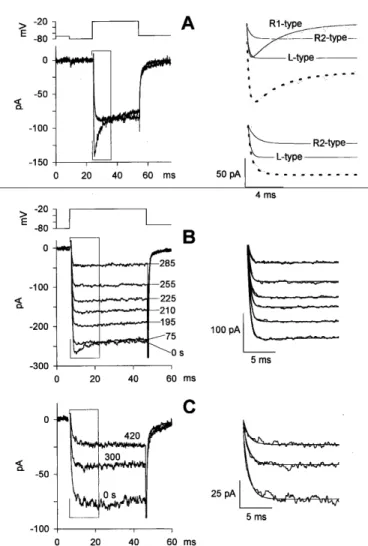
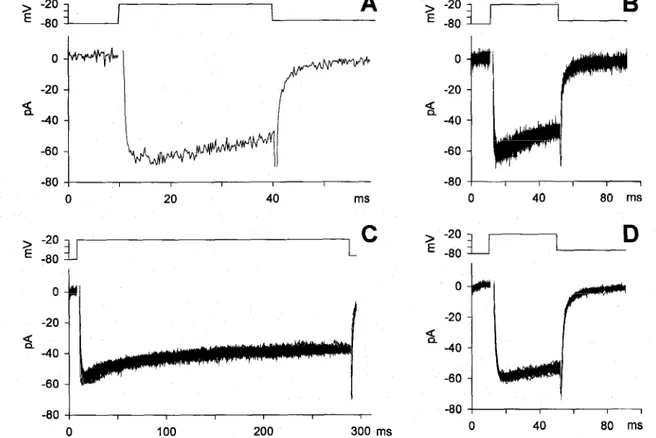
Fig. 11. Ca2+ current waveforms and typical rundown experiments. A, After measuring the leak resistance with a 15-ms hyperpolarization to -80 mV from the holding potential (-70 mV), the Ca2± current was elicited by a 30-ms depolarization to -20 mV. Left, typical Ca2+ current waveform recorded from two cells, one displaying and the other lacking the sag component. Right, activation and inactivation kinetics of the responses. Tracings on the left are fitted by Eq. 1 (dotted traces). The solid thin traces are the contribution of the two R-type and the L-type currents to the total current. The RI -type trace was constructed by fitting the sag component, which was singled out (gray trace), as discussed in the text.
(B) Ca2+ current run-down in response to repetitive 40-ms depolarizations to -20 mV from
a potential of -80 mV, repeated every 15 s; representative traces are shown at seven recording times (indicated in s near each trace). (C) Ca2+ current run-down in response to the same depolarizing test pulses delivered at the indicated times (in s above each trace). Representative traces from B and C are fitted by Eq. 1, as shown on the right.
The sag response can be readily explained by assuming that depolarization opened at least two channel types generating two different calcium currents, both rising exponentially with a common time constant of 0.5 ms: the first exhibiting an inactivating time constant of a few ms, while the second did not inactivate.
The sag response was generated by a Ca2+ channel exhibiting a Ca2+-dependent inactivation. The sag and the plateau amplitudes were reduced, and the sag kinetics slowed down, with a decrease in [Ca2+]
o; the sag disappeared when Ca2+ was substituted
with Ba2+. Consistent with the notion that the Ca2+-dependent inactivation is removed in
Ba2+, the current increase observed upon substituting Ca2+ with Ba2+ was smaller in those cells that lacked the sag component than in those where the sag was present. The effects of both [Ca2+]o reduction and Ba2+ substitution were fully reversible upon returning to
normal [Ca2+]o. To determine whether the Ca2+-dependent inactivation was also
voltage-dependent, recovery from inactivation was investigated using the standard two-pulse protocol. Two depolarizing steps to -20 mV were separated by progressively longer interpulses at two different holding potentials (-70 mV and -120 mV). The time interval between each one of the consecutive double-pulse protocols was 7 s, which allowed full recovery of the test current. Analysis of the fractional amplitude versus interpulse duration indicated that recovery from inactivation required times on the order of 100 ms at -120 mV and 300 ms at -70 mV. Such long recovery time is not consistent with the presence of a voltage-sensitive inactivating gate, which should act much faster; it is, however, compatible with the speed at which [Ca2+]i is restored to its physiological
levels upon returning to the holding potential. In order to better identify the channel types generating the compound Ca2+ current waveform, typical Ca2+ antagonists were used. It was found that 1 M nifedipine reduced the current plateau fraction (leaving the sag component, when present, unaffected) by 57.1 ± 3.6% (n = 5), thus indicating the presence of an L-type channel. Since 5M nifedipine reduced the plateau component by 68.4 6 2.0% (n = 12), and 10 M nifedipine produced nearly the same current reduction (again, either concentration did not affect the sag component), it can be concluded that 70% of the plateau component was carried by an L-type channel. Nifedipine (5 M) had nearly the same effect on the Ba2+ current amplitude (a mean
decrease by 62.2 6.3%; (n= 5) in those cells showing no sag component in the presence of external Ca2+.
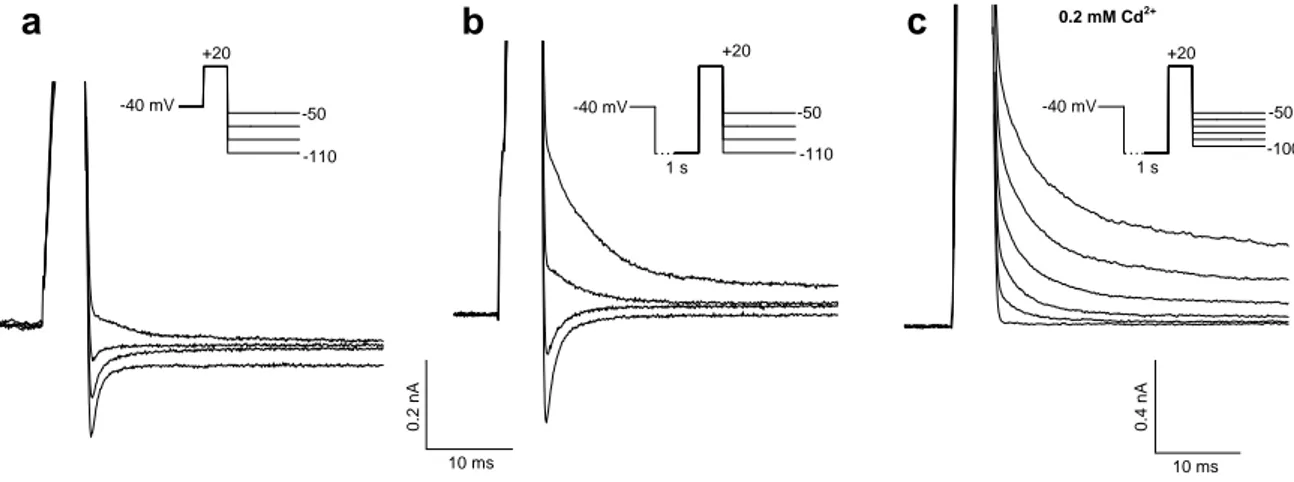
Fig. 12. Ca2+-dependent inactivation of Ca2+ current. Voltage was stepped to -30 mV to maximize the sag component. A, Effect of [Ca2+]o reduction (from 4 mM to 1.5 or 0.75
mM) on the Ca2+ current. Inset: enlargement of the current trace recorded in 0.75 mM Ca2+, as indicated in the box. B, Absence of inactivation when Ca2+ is replaced by an equiosmolar concentration of Ba2+. In A and B the two superimposed traces are the control and recovery in 4 mM [Ca2+]o, before and after the perfusion with 1.5 and 0.75 mM [Ca2+]o (A), or 4 mM
.
Fig. 13. Kinetics of current recovery from inactivation. A, After measuring the leak resistance, two consecutive 40-ms depolarizations to -20 mV were delivered, separated by 20, 100, 180, and 260 ms interpulses to -70 mV (interpulse holding potential). All interpulses were followed by an additional 20-ms step to -80 mV to re-evaluate leak resistance before delivering the second pulse (the time is the interpulse duration). The time interval between each of the consecutive double depolarization protocols was 7 s. The Ca2+ currents elicited by the first depolarization (A, traces a, c, e, and g), and by the test depolarization (A, traces b, d, f, and h) are compared in C and B, respectively, on a faster time scale; the lowercase letters indicate the same traces in A, B, and C. D, Mean values of the ratio between the peak Ca2+ current elicited by the test depolarization and the peak Ca2+ current elicited by the prepulse. Interpulse holding potentials were -70 mV (filled circles, 8 cells) and -120 mV (open triangles, 8 cells)
Fig. 14. Effect of nifedipine on the Ca2+ and Ba2+ currents (in 4 different cells). The recovery following each nifedipine application was complete and was omitted for clarity. Effect of nifedipine on the Ca2+ current in the presence, A, and in the absence, B, of the sag component; the L-type current resulting from the difference between the two traces on the left in A and B is shown in the corresponding inset on the right, C. Effect of nifedipine on the Ba2+ current in a cell presenting the sag component in Ca2+ (inset on the right) and in D in a cell exhibiting only
Fig. 15. Effect of -conotoxin GVIA, -conotoxin MVIIC, and -agatoxin IVA on the peak and the plateau component of the Ca2+ current in three representative cells. A-C, The responses to at least three subsequent depolarizing test pulses to -30 mV in the presence of the antagonist (indicated above each trace family) are compared with the control traces recorded before and after antagonist application. The effect of -conotoxin MVIIC during the nifedipine application is shown in D in a fourth cell.
The total current was unaffected by -conotoxin GVIA (5 M, 7 cells), -conotoxin MVIIC (5 M; 5 cells), and -agatoxin IVA (up to 0.4 M; 5 cells), thus ruling out the presence of N- or P/Q-type Ca2+ channels. These compounds, as expected, did not affect the nifedipine-resistant current (5 M nifedipine; 4 cells), indicating that this current was flowing through R-type channel component (Fig. 15).
When present, the sag component remained unaffected by the application of nifedipine, thus indicating that the sag was generated by the inactivation of the R-type current and not by a partial inactivation of the L-type. The progressive loss of the sag component during the initial phase of rundown occurred without any change in the plateau amplitude. This fact cannot be accounted for by the progressive loss of a Ca2+-dependent, partial inactivation of a single R-type channel. Instead, it could be explained by the presence of a third channel type, which runs down completely before the onset of the plateau component reduction. This channel could be a type channel: however, no T-type channel has been reported to lose inactivation in Ba2+. Thus, it can be concluded that two R-type channels generate the current left after the nifedipine application: one generates the sag and fully inactivates in a Ca2+-dependent manner, the other does not inactivate and accounts for the remaining plateau. Cd2+ and Ni2+ were able to block the inactivating R-type channel; however, high concentrations of these cations were able to suppress the total current consistently with the almost complete suppression of the Ba2+ current induced by 100 M Cd2+.
In conclusion, the activation-inactivation phase Ia(t) of the Ca2+ current waveform can be
reasonably described by the following equation (Eq. 1):
)
e
1
(
A
)
e
1
(
e
A
e
1
)
t
(
I
t/ aR2 2 R ) 1 aR / t ( ) 1 iR / t ( 1 R ) 1 R / t ( a
(
A
L
where AL and aL are the amplitude and the activation time constant of the L-type
current; AR1, aR1, and iR1 are the amplitude, activation, and inactivation time constants
of the transient R-type current; AR2 and aR2 are the activation parameters of the plateau
R-type current. The responses consisting of only the steady-state component were interpolated by Eq. 1 with AR1 = 0. The average amplitude of the plateau component, that
is AL + AR2, was -126 6 8 pA (n= 53 cells); the absolute values of AL and AR2 can be
estimated from the relationship AL 2.3 X AR2, drawn from the nifedipine experiments.
The AR1, R1, and iR1 values were obtained upon fitting the sole experimental sag
component. The sag was singled out by subtracting the current recorded after the full run-down of the sag from the total current recorded at the beginning of an experiment. The results of this procedure were iR1 = 6.7 0.8 ms (n = 22); AR1 = -42 5 pA; R1 =
0.18 0.03 ms (n = 10). The difference between the total current and the current recorded in nifedipine gave the waveform of the L-type current; aL, assessed by fitting
drawn from the fit of the currents lacking the sag component in the presence of nifedipine was 0.68 0.08 ms (n = 6). The above described procedure is presumably correct to calculate aL and aR2, providing that nifedipine does not affect aR2. This
condition is indeed satisfied here since, in all experiments, no significant difference was found between the values of aR2 obtained in 1 M and in 5 M nifedipine. The
responses with or without the sag component had almost identical deactivation kinetics upon returning to the holding potential; in general, it was not possible to record the inward peak tail currents, probably because they were too fast to be resolved by our experimental arrangement. Thus, the deactivation phase Id(t) of the Ca2+ current can only
be interpolated by: ) 2 dR / t ( 2 dR ) dL / t ( dL d
(
t
)
A
e
A
e
I
The parameters AdL and dL are the amplitude and time constant of the deactivation phase
of the L-type current: the fit to these currents gave AdL = AaL and dL = 0.24 0.05 ms (n
= 6). The deactivation phase of the non-inactivating R-type current was calculated by the fit of the current in nifedipine. The resulting values were dR2 = 8.5 0.6 ms (n = 20) and AdR2 = -18.0 2.0 pA (n = 29 cells). To further characterize the three channel types it is necessary to determine their voltage dependence. Given the long recovery time from inactivation, the interpulse duration of the I-V protocols was kept longer than 1 s. Fig. 16 shows the voltage dependence of the Ca2+ current waveform in a typical cell. A peak superimposed on the plateau became appreciable at -40 mV (which is the activation threshold of the R-type channel generating the sag waveform), reaching a maximal value at -30 mV. The peak was progressively reduced by larger depolarizations, and became undetectable for voltages 0 mV. The plateau component, generated by the non-inactivating R-type channel and the L-type channel, was appreciable at -60 mV, peaked at -20 mV, and had a reversal potential of about +50 mV. The I-V relationships for the peak and plateau components are illustrated in panel B (open diamonds and filled circles, respectively). The normalized average I-V of the peak (open diamonds) and plateau (filled circles) components are shown in Fig.17; since no significant changes were found in the I-V relationships recorded using different pipette [Ca2+], the data for these I-V relationships were averaged together. The I-V of the plateau component exhibited a Vrev of +40 mV (Fig. 17 A, filled circles), smaller than would be expected from the Nernstian reversal potential for Ca2+ (200 mV).
Fig. 16. I-V characteristics of the current exhibiting the sag. A, left panel Ca2+ currents were elicited by depolarizing voltage pulses from -60 mV to +50 mV in l0-mV increments, from a potential of -80 mV; right panel, deactivation kinetics upon returning to the holding potential (-70 mV). B, Steady state (filled circles) and peak (open diamonds) current amplitudes from each trace of the cell shown in A are plotted against the test potential.
Fig. 17. Voltage dependence of the R-type and the L-type currents. Ca2+ currents in the
presence of intracellular Cs+ or NMG+ (90 mM). A, Normalized I-V values of the average
sag component in Cs+ (i.e., the inactivating R-type current scaled to the maximal value of ARI, attained at -30 mV, open diamonds, 15 cells); the average plateau component in Cs+
(scaled to the maximal value of the plateau current, attained at -20 mV, filled circles, 15 cells) and in NMG+ (open triangles, 7 cells); the R2-type component (gray noisy trace) and
the L-type component (gray noisy trace matching the open triangles) of the cell in C. In NMG+, voltages are corrected for the junction potential with respect to Cs+ (+9 mV). B, I-V relationships in Cs+, elicited during run-down by voltage ramps of steepness 0.63 mV/ms, from -80 mV to +60 mV, repeated every 15 s. These representative traces were recorded at the beginning of the experiment (0 ms, thin trace) and at three subsequent times (75, 135, and 270 s; thicker traces); the current responses to the ramp for a voltage interval between +20 and +60 mV (box) are enlarged on the right. C, I-V relationships of a cell exhibiting a small Vrev, in response to a ramp of voltage (0.56 mV/ms): I-V of the total current
(unmarked trace), of the current in the presence of nifedipine (R2-type trace) and of the
current resulting from the difference between the two latter currents (L-type trace). (Vrev) of +50 mV. The I-V relationships for the peak and plateau components are illustrated in panel B (open diamonds and filled circles, respectively).
However, the current never reversed for depolarizations up to +60 mV when [Cs+]i was
substituted with an equiosmolar concentration of the large impermeant cation NMG+ (Fig. 17 A, open triangles). Furthermore, as shown in Fig. 17 B, the size of the outward current was progressively reduced as the Ca2+ current declined during the run-down indicating that most of the Cs+ current flowed through the Ca2+ channel itself. The I-V relationships of the two channels generating the plateau component were isolated using a voltage ramp of appropriate steepness (0.56 mV/ms), so that the R-type channel generating the peak was inactivated and did not contaminate the plateau amplitude. The I-V relationship of the noninactivating R-type channel (R2) was obtained in the presence of 5 M nifedipine; subtracting the R2-type channel I-V from the total current I-V (i.e., the current recorded in the absence of nifedipine), gave the I-V of the L-type current (Fig. 17 C). Interestingly, when normalized to the same maximal current amplitude (which was attained at +20 mV for both currents; Fig. 17 A), the R2-type and the L-type channel V values were indistinguishable up to 0 mV; above this voltage, the L-type current I-V was always below that of the R2-type. In fact, at more depolarized voltages, the latter channel carried all the outward current. Accordingly, the normalized L-type current could not be distinguished from the normalized average I-V relationship recorded when the internal Cs+ was substituted with NMG+ (Fig. 17 A).
The run-down occurred in all cells after several minutes of whole-cell recording and was accelerated by the duration of channel activation, as illustrated in the experiment of Fig. 11 C, where the Ca2+ current was probed a few times over a long recording. Indeed, the run-down ensued later than it did during stimulation at higher frequency (Fig. 11 B). It has been shown that the run-down of L-type cardiac Ca2+ currents can be prevented by calpastatin, an inhibitor of the cytoplasmic Ca2+-dependent proteases. To verify whether a similar mechanism operates in semicircular canal hair cells, 2 U/ml of calpastatin were incorporated into the pipette solution. Calpastatin completely prevented the run-down, even in cells where the initial response was not particularly large, and despite the heavily sustained and repetitive activation of the current. Indeed, the size and waveform of the current families illustrated in Fig. 18 remained virtually unchanged, although the cell was stimulated with three sequences of 20 depolarizing steps, delivered at 15-s intervals, and lasting 40 ms (B and D) or 280 ms (C; the whole-cell recording time was 20 min).
Fig. 18. Effect of intracellular perfusion of 2 U/ml calpastatin on the current amplitude and waveform. A, Typical Ca2+ current elicited by a depolarization to -20 mV from a potential of -80 mV. B-D, Responses of the same cell to a sequence of 60 depolarizing voltage pulses delivered every 15 s and lasting 40, 280, and 40 ms, respectively.
Surprisingly, in some cells the amplitude of the plateau component progressively increased upon repeating the depolarizing step (before the onset of the run-down; Fig. 19), even doubling in size when compared to the beginning of the recording. This phenomenon has been described in other systems and it is commonly referred to as current “run-up.” The run-up observed here cannot be ascribed to the facilitation sustained by a kinase-induced phosphorylation of a site exposed by channel opening. Indeed, a 300-ms conditioning depolarization to +40 mV failed to induce any increase in either peak or steady-state amplitude of the current elicited by a test depolarization to +20 mV. The run-up of the plateau component was never accompanied by run-up of the sag component: this means that the inactivating R-type channel did not manifest run-up, but only run-down. Furthermore, the run-down kinetics of the latter channel was always independent of the run-up. To determine whether the run-up of the plateau component was generated by a progressive increase in either the L-type current or the non-inactivating R-type current (or by both events), the effect of nifedipine during the run-up occurrence was measured. Indeed, the non-inactivating R-type current did not appreciably change in amplitude, although the L-type current almost doubled in size (Fig.19 C). In summary: three distinct Ca2+ channel types have been identified in frog canal hair cells according to their biophysical and pharmacological properties. The one carrying most of the current is a non-inactivating L-type channel, the two other channels have been tentatively identified as R-type on the basis of their resistance to dihydropyridines, ω-cono- and aga-toxins. The first channel, termed R1, shows Ca2+ -dependent inactivation; the second, R2, sustains a non-inactivating current. The L and R2 currents, which activate at –60 mV and peak at –20 mV, may sustain the ongoing spontaneous transmitter release at the cytoneural junction, whereas the R1 component, which activates at a more positive membrane potential and peaks at –30 mV, may be functionally important in evoking the fast synchronous transmitter release in response to short, strong stimuli.
Fig. 19. Run-up of the plateau component. Current was tested with 40-ms depolarizing voltage steps to -20 mV, repeated every 15 s; A, Cell displaying a particularly large peak current, where the run-down of the peak component and the run-up of the plateau component were evident. Representative traces were recorded at the beginning of the experiment (0 s) and at five subsequent times indicated near each trace. B, Enlargement of the same traces as in A (box) and fits to Eq. 1 of the data (smooth lines). C, Run-up of a cell lacking the sag component and effect of nifedipine on the current recorded at 0 s
The potassium currents
Major K+ voltage-dependent currents in frog labyrinth have been found to include: 1) a fast transient current, IA; 2) a delayed current, generated by a mix of a non-inactivating
current, IKV, and a Ca-dependent current, IKCa. Previous attempts at dissecting these
individual currents, or at least the fast transient IA from the delayed currents, based on pharmacological treatments or voltage protocols, have been only partially successful (Masetto et al., 1994). In our lab a detailed analysis the kinetic properties of the development and removal (“recovery”) of inactivation of the fast and slow potassium currents has been recently carried out. A straightforward voltage protocol, capable to isolate almost pure current tracings, in each hair cell and over a wide membrane potential range, has been developed. This way, the independent description of activation and inactivation kinetics was derived for both IA and delayed currents. Finally, attention has
been paid to the currents evoked by protocols that reproduce physiological conditions, i.e. depolarisations starting from appropriate membrane potential levels within the voltage range into which the cell is expected to physiologically operate. The role of IA in
hair cell electrogenesis is controversial, since in many cases (e.g., at the presumed resting potential of saccular or cochlear hair cells) IA might hardly be available. We have shown
in our lab that in the frog semicircular canal it is possible to precisely isolate the IA,
reliably define its time course, and describe its inactivation mechanism and its kinetics; the A current so characterised results to dynamically contribute to membrane potential shifts – and sensory signal processing – during the excitatory-inhibitory phases of the normal hair cell activity, and its contribution is likely to become more relevant under conditions of activation of the efferent inhibitory system. These results (Martini et al., 2009) are described here in detail, since they are necessary for a better understanding of the new findings presented below.
Hair cell passive properties
It was obviously impossible to localise the original position of each dissociated hair cell within the crista ampullaris. However, the cell type could be recognised: the cells used in that study were classified, and their passive parameters are listed as follows:
Cell type Cell input Cell input Zero current
resistance capacitance membrane potential GΩ pF mV
Cylinder-like (n = 71) 1.5 ± 0.1 9.5 ± 0.4 -69.8 ± 2.2 Pear-like (n = 27) 1.1 ± 0.1 10.2 ± 0.7 -67.5 ± 3.3 Club-like (n = 7) 1.2 ± 0.6 8.5 ± 0.4 -72.1 ± 3.6 Uncertain (n = 9) 1.4 ± 0.4 10.7 ± 1.4 -66.3 ± 5.3
These data indicate that the basic resting properties of the isolated hair cells that survive the dissociation procedures were relatively homogeneous; it should be noted that the present zero-current membrane potential values are slightly more negative than those previously measured in dissociated cells or in intact hair cells in thin slices of the crista ampullaris of the frog.
General properties of the currents
The profile of the active currents evoked by depolarisation in isolated hair cells strongly depends on the starting membrane potential. The typical behaviour is summarised in the families of currents illustrated in Fig. 20 a-c. Slow, persistent, noisy outward currents characterise the responses to depolarising steps from a holding potential of -40 mV; conversely, a large and partially transient outward current prevails, when starting from a -90 mV holding level. Current inactivation, and its voltage dependence, appears therefore to constitute a critical aspect in dissecting potassium currents.
Currents evoked from -40 mV holding potential
In control hair cells examined at mildly negative holding potential, namely -40 mV, the IA current can be considered to be fully inactivated (see below). The only currents that
can be activated under this condition are the delayed potassium currents, IKD, i.e. a mix of
a non-inactivating current, IKV, and a Ca-dependent fraction, IKCa. From this holding
potential, currents were evoked by voltage commands up to +80 mV. The compound outward current rapidly built-up up to a value proportional to the applied voltage step and thereafter settled, in about 50 ms, to a persistent level.
+70 mV +60 mV +80 mV -20mV 0mV +20mV +40mV +60mV a mV -40 0 40 80 0.0 0.4 0.8 N-type cells (n=12) Non N-type cells (n=8)
d c Membrane potential nA IKD am plitu d e 50 ms 0.2 nA 0.4 nA 50 ms b -40mV +80 mV -40mV +80 mV +70 mV -90mV 100 ms 0.5 nA
Fig. 20. (a) Representative family of currents evoked in the -60/+70 mV voltage range, in 10 mV steps, in an isolated hair cell held at -90 mV. Note the late decay of current flow in the +60/+70 mV tracings. (b-c) Current tracings evoked in the -20/+80 mV voltage range (in 20 mV steps) in typical non-N (b) or N-type (c) hair cells from a -40 mV holding potential. (d) Mean I-V plots for hair cells classified as N-type (open circles; n = 12) or non-N-type (filled circles; n = 8).
Membrane potential mV -40 -20 0 20 40 60 80 S te ady -st at e curr e nt ampl it ude 0.0 0.5 1.0 1.5 Control n=5 Cd2+ 200M n=5 mV -20 0 20 40 60 80 P eak cur rent amp lit ude ( ) 0.0 0.5 1.0 1.5 2.0 mV -40 -20 0 20 40 60 80 Curr en t v a ri a n ce 0 1 2 3 nA2 nA a b c -40 mV 50 ms 200 pA Control Cd2+ 200M +80 mV +60 0 +40 -20 +20 -20 0 +20 +40 +60 +80 mV d e nA +80
Fig. 21. (a-b) Typical current families elicited in the same hair cell in the -40/+80 mV voltage range before (a) and after (b) fast application of 200µM Cd2+. Holding potential was -40 mV throughout. (c-d) Mean I-V plots from 5 cells in the -40/+80 mV voltage range before (filled circles) and after fast perfusion of 200 µM Cd2+ (triangles). Steady-state current amplitude is illustrated in (c), while the amplitude of the early transient peak (arrows) is shown in (d). (e) Noise variance of the steady-state current recorded at different voltage levels in the two cell groups illustrated in (c-d).
This steady level monotonically increased with the command voltage, up to +80 mV, in 8 out of the 20 cells of our sample (Fig. 21 b,d - filled circles), while in the remaining 12 cells its magnitude only increased up to +20 mV, and clearly decreased above +40 mV (Fig. 21 c,d - open circles), giving rise to a prominent local peak in the current profile and to a “N-shaped” steady-state I-V plot (the N shape arises because the steady current increases again, above +60 mV; see also Fig. 21 c). The mean I-V curves of the non-N and N-type cells are shown in Fig. 20 d.
The component of K+ current that rapidly sets off and vanishes at very positive potentials may be related to the kinetics of Ca2+ inflow, which initially is intense but rapidly fades as the command membrane potential approaches the Ca2+ equilibrium potential. The involvement of Ca2+ inflow was confirmed in a group of hair cells, in which the N-type profile of the I-V curves was particularly evident. Rapid perfusion of 200 μM Cd2+ onto the cell (a powerful blocking procedure for any voltage-dependent Ca2+ channel) abolished a major fraction of the outward current and the initial peak at highly positive potentials (Fig. 21 b,d). The current tracings became virtually square at all voltage levels, with an initial peak slightly higher than the steady value (this may constitute either a partial inactivation of IKV or a shift in K+ distribution); a monotonic current-to-voltage
relation was generated and the N-shape behaviour of control cells was completely cancelled (Fig. 21 c). The current noise variance, measured on a 100 ms section of the recording at steady state during the command voltage step, was drastically reduced by Cd2+ (Fig. 21 e), suggesting that a major contribution to the variance arises from Ca-activated channels. Consistently, the fraction of current noise variance abolished by Cd2+ was not the same at all potentials. In general, noise variance should change with p (1 –
p), where p is the open probability of the channel; thus the noise variance abolished by Cd2+ should be minimal when Ca2+-dependent channels are scarcely or strongly activated: experimentally, the effect of Cd2+ on current variance was small at negative membrane potential values, where IKCa is little activated because Ca2+ channels are shut,
was maximal for mildly positive potentials and decreased at highly positive potentials, where the driving force for Ca2+ begins to decrease; however, it was also depressed near 0 mV, where Ca2+ influx should be maximal (and the open probability of IKCa is likely to
approach 1, thereby reducing noise variance). Voltage-dependent calcium currents are well characterised in frog hair cells. The calcium participation in the whole current flow of Figs. 20, 21 is quantitatively limited (a mean amplitude of about -15/-20 pA at +20 mV), as compared with the potassium current amplitudes.
b -40 mV +20 +20 -40 mV a 1 s +20 -50 1 s 10 ms 0 .2 nA -40 mV 10 ms 0.4 nA c -50 -110 -110 -50 -100 0.2 mM Cd2+
Fig. 22. Tail currents recorded in hair cells upon repolarising the membrane in the -50/-110 mV voltage range. Currents were evoked by 5 ms pulses to +20 mV, starting from a holding potential of -40 mV (a), or after 1s preconditioning at -110 mV (b,c); peak amplitudes of the currents during the depolarising pulse (out of scale) were 0.71, 1.82 and 3.94 nA, respectively. (a,b) from the same cell; (c) from a different cell exposed to 200 µM Cd2+. Plots of tail current amplitude vs. membrane potential (not shown) suggest a current equilibrium potential of -61 mV in (a), -81 mV in (b) and -100 mV in (c).
The presence of calcium conductances is more readily evident in observing how much the reversal potential of the tail currents departs from K+ equilibrium potential under different conditions.
With relatively small potassium currents (holding potential -40 mV; Fig. 22 a), the apparent reversal potential of the tail current following a pulse to +20 mV was about -61 mV (peak outward current 0.7 nA and mean reversal potential of the tail current -52.0 ± 5.6 mV, in a 4-cell sample). The application of a preconditioning 1-s pulse at -110 mV recruited further potassium current components and the reversal potential shifted to -81 mV (Fig. 22 b): the peak outward current during the pulse to +20 mV reached 1.8 nA, and the mean reversal potential for the tail currents was –80.0 ± 5.6 mV, in the same 4-cell sample. Independent of the holding potential, almost pure potassium currents were observed after blockade of calcium ion inflow by Cd2+; under these conditions the tail current null point approached the Nernstian equilibrium potential for potassium ion (-96 mV; Fig. 22 c).
The N-shaped profile in the I-V curves, observed with a holding potential of -40 mV, cannot generally be seen with more negative holding potentials, because the recordings, and especially the initial part of the responses, are dominated by large outward currents with a monotonically increasing amplitude. However, in some cells late currents did display a discernible decrease at very positive potentials, also when starting from a –90 mV holding potential (e.g. Fig. 20 a, +60 and +70 mV).
Participation of chloride current in these effects was ruled out by substituting isethionate for chloride ions, or by using specific chloride channel blockers such as 9AC (data not shown). Similarly, any IA component was excluded by considering that the activation of
this current starts at -40 mV membrane potential.
In turtle hair cells with free-standing hair bundles, sensory mechano-transduction channels are opened by depolarisations positive to 0 mV. Though no adaptation or inactivation was reported for this current in other systems, we performed a series of tests to exclude that transducer channels contributed to the transient outward component observed here. No effects on the currents were observed after applying permeating channel blockers such as 1 mM methylene blue (which is expected to block about 90% of the transduction current at +60 mV), or 50 M gadolinium chloride, or after substituting TRIS for external sodium. Thus, calcium involvement remains the most plausible explanation for the appearance of a transient component of IKD and the decrease of late current at highly positive potentials. Calcium ions entering the cell during the early large depolarisation would strongly activate IKCa, which is usually both Ca- and
voltage-dependent. Close to the equilibrium potential, however, calcium inflow would rapidly wane and IKCa would consistently decline, since this current apparently requires
to be continuously fed by a maintained calcium influx. The deactivation time constant of maxi K+ channels in a membrane patch from guinea-pig myocytes after application of a transient calcium pulse was about 18 ms at +50 mV, and about 20 ms for BK channels activated by calcium sparks released from the sarcoplasmic reticulum. A similar observation was obtained in rat chromaffin cells after brief calcium immission. The decay time course of the outward current transients of Fig. 20 c and 21 a are in line with these findings, thus suggesting that this behaviour might actually be related to deactivation of a Ca-dependent current.
Currents evoked from more negative holding potentials
As previously reported, hair cells express a fast transient potassium current, IA, which is
completely inactivated at potentials above -40 mV. Hyperpolarising conditioning pulses remove this inactivation. Following such conditioning, positive voltage pulses evoke a mix of currents in which the delayed current described above summates to the IA. A
simple procedure to isolate the IA component consists in subtracting the tracings without
preconditioning to those obtained after preconditioning at negative potentials. As originally observed in Anisodoris, this manoeuvre can be successfully applied only if the slow outward current is not affected by any voltage-dependent inactivation. In hair cells, difference tracings usually exhibit a persistent current pedestal at times when IA
inactivation should be complete; return to zero level is only observed when the conditioning pulse is to mildly negative membrane potentials (about –70 mV) or particularly brief - see for example Fig. 23 d(a). Under these conditions, the IA current
recovered by the short preconditioning pulse is fully inactivated within about 200-300 ms, and the sole delayed current fraction, unaffected by the brief/mild preconditioning pulse, survives at later times. It appears, therefore, that two distinct mechanisms of inactivation coexist at hair cells: they separately involve IA and delayed currents, and are
removed by conditioning pulses with different time courses and voltage dependencies. To better understand these processes, the development and removal of current inactivation have been separately analysed for the two current types.
a 100 ms 0. 5 nA -40 mV -100 +20 ms 0 100 200 300 400 500 nA 0.0 0.5 1.0 1.5 2.0 IA Control IA Iberiotoxin 200nM IKd Control IKd Iberiotoxin 200nM b -70 +20 -70 -100 c d a b Cd2+ 200M 0.3-30s 10-30s 1s 0.3s 1nA 50 ms 300 ms +20 -70 -40 mV -100 5 s +20 -70 -40 mV -100 100 ms 1 n A
Fig. 23. (a) Time course of fast IA recovery at -100 mV. Starting from a –40 mV holding potential (IA fully inactivated), the currents were elicited at +20 mV following a
conditioning pulse of variable duration at –100 mV. (b) The amplitudes of the transient peak (IA, circles) and the steady-state component (IKD, triangles) of the evoked currents
are plotted vs. the conditioning period duration (filled symbols), and compared with the same measurements after exposure of the same cell to 200nM iberiotoxin (open symbols). Note the time course of IA inactivation removal as opposed to the lack of any significant effect on IKD amplitude. (c) The IA and IKD growth following long-lasting
conditioning pulses of increasing duration (0.3, 1, 10 and 30 s) demonstrates the presence of a slow recovery component in both conductances. Each trial was followed by a 30 s period at -40 mV to allow for complete inactivation. (d) Recordings obtained in the presence of 200µM Cd2+ to show the calcium-independence of the slow conductance modifications. A short preconditioning of 300 ms at -100 mV, insufficient to remove any IKD inactivation, selectively removes inactivation of IA, that can be dissected out as a
current decaying to zero by utilising the subtraction procedure (dotted, a). Recovery of both IA and IKD current fractions from inactivation is revealed in the same cell by a 5 s
sojourn at -100 mV. Eight cycles were subsequently repeated, in which the cell was preconditioned, pulsed to +20 mV, maintained at -40 mV for 30 s and pulsed to +20 mV without preconditioning. The first and last (dotted) cycles are illustrated to demonstrate the lack of memory from previous episodes (b).
IA INACTIVATION REMOVAL Time 0.1 ms 1 ms 10 ms 100 ms 1 s 10 s 100 s IA pe ak a m pl it ud e (n orm al iz ed ) 0.0 0.5 1.0 1.5 2.0 2.5
IKD INACTIVATION REMOVAL
Time 0.1 ms 1 ms 10 ms 100 ms 1 s 10 s 100 s IKD p eak a m pl it ud e (n orm al iz e d) 0.0 0.5 1.0 1.5 2.0 2.5 -40mV -100 0 - 2 min +20 a b
Fig. 24. Time course of IA and IKD fast and slow inactivation removal. (a) Peak IA
amplitudes from experiments similar to those illustrated in Fig. 23 a,c are plotted vs. the duration of the conditioning pulse at -100 mV. Holding potential was – 40 mV throughout. Data were obtained from 6 cells to analyse fast removal (2-300 ms conditioning duration range), or from 10 different cells to analyse slow inactivation removal (300 ms-100 s conditioning duration). In the latter experiments, successive trials were separated by a 30 s period at -40 mV to avoid any summation in the recovery mechanism. All data are normalised to the responses obtained from each cell following a 300 ms conditioning period. (b) Plot of IKD steady-state amplitude vs. duration of the
conditioning period at -100 mV. The plot demonstrates the absence of fast recovery and the presence of slow inactivation removal. Data from 8 cells for 2-300 ms conditioning at -100 mV; data from 10 different cells for the long-lasting conditioning. All data normalised as in (a). Open circles illustrate data from a cell conditioned at -70 mV.
The kinetics of fast and slow removal of IA and IKD inactivation
Fast inactivation removal at -100 mV was studied in double-pulse experiments. IA
recovery was evaluated by holding the cells at –40 mV (IA fully inactivated) and stepping
to +20 mV after a conditioning pulse (–100 mV) of variable duration. Peak IA was
computed by subtracting to such current recordings the current measured with no pre-pulse. IKD recovery was evaluated in the same current difference tracings after 400 ms at
+20 mV, when IA is completely inactivated. The cumulative results are shown in Fig. 24,
left part of the graphs (conditioning pre-pulse durations in the 2-300 ms range). The behaviours of both IA and delayed currents are illustrated in Fig. 23 a,b. As concerns the
transient component, it is evident that a fast process of IA recovery (inactivation removal)
operated, and displayed a single exponential time course (see Fig. 24 a). The mean value of its time constant, τhA , was 18.2±1.6 ms at -100 mV; fast recovery was complete within
about 80 ms in all the hair cells of the sample, and was stable for an additional 100 ms period thereafter. In this same range of preconditioning pulse durations, no changes were observed in IKD amplitude (see Fig 24 b), thereby indicating that possible inactivation of
delayed K+ currents was not removed by brief preconditioning pulses (IKD amplitude at
+20 mV = 844±139 pA without preconditioning vs. 870±172 pA after 300 ms preconditioning at -100 mV).
In 6 different cells, fast IA recovery was studied at -70 mV, a membrane potential close to
the zero-current level of the isolated cells. Again, inactivation removal ensued with a single-exponential time course; the mean value of τhA = 18.3±4.6 ms was virtually
identical to the value observed with pre-pulses at -100 mV. A 5-ms sojourn at -70 mV was thus sufficient for the cell to recover 2 nS A-conductance. In the same experiments, inactivation removal of the delayed current component was negligible during the first 200 ms of the conditioning step.
In addition to fast inactivation processes, slow voltage-dependent recovery mechanisms are present in the frog hair cells, and their characterisation is illustrated in the right part of the graphs in Fig. 24. A typical experiment is shown in Fig. 23 c: the cell was clamped at -100 mV for a time period of 300 ms to 30 s, and a final test depolarisation to +20 mV was then applied. Both IA and delayed current fractions increased in amplitude as the
long-lasting conditioning pulse was prolonged. The maintained current fraction markedly increased, whereas there was no apparent change in the time course of the IA currents.
The kinetics of inactivation removal of the slow components was studied in a group of 10 cells, in experiments similar to those used to describe fast recovery; the results are illustrated in Fig. 24 ab, over the time scale range to the right of 300 ms pre-conditioning
duration. All data from each cell are normalised to the corresponding measurement for 300 ms conditioning pulse duration, to make data from different cells readily comparable. Fast recovery was only observed for the IA component and was complete
within 300 ms (previous observations, Fig. 24 a, left part). A second slow phase of inactivation removal ensued after this time (these new experiments). Single cells were maintained at a holding potential of -40 mV, and held at this potential for at least 30 s between successive conditioning episodes, thus ensuring that slow inactivation processes had fully developed before starting with a new conditioning period.
The slow removal of IA inactivation at -100 mV consistently increased the peak IA
evoked at +20 mV. After 10 s preconditioning (n = 4) peak IA reached a value 1.6 times
larger than after completion of fast recovery (300 ms). Slow IA recovery did not display
consistent, well defined kinetics, and occasionally proceeded for even more than 1 min during preconditioning. It is worth noting that although recovery took tens of seconds, the onset of IA inactivation was always fast, and was generally complete within a 1-s sojourn at -40 mV.
The delayed current, which was originally thought to be exempt of inactivation, did not display any fast recovery but exhibited a well detectable process of slow inactivation recovery from inactivation, which only ensued after a delay of about 300 ms. Data from 10 cells are presented in Fig. 24 b. Full recovery produced a consistent amplitude increase for the delayed current: the increase factor averaged 1.4 after 5 s preconditioning (n = 5) and 1.8 after 100 s preconditioning (n = 4; Fig. 24 b). Even larger effects were noticed in single sets of experiments (see, for example, Fig. 25 b and Fig. 28). The kinetics of inactivation removal followed a single exponential time course in these experiments; typically, in a cell maintained at -70 mV (Fig. 24 b, open circles) a time constant of 3.3 s was estimated.
Contrary to IA, whose fast and slowly recovering components both fully inactivated
within 1 s, the delayed current inactivation developed over a more complicated time course. To study the kinetics of this process, the hair cell was held at –70 mV; pre-conditioning was performed by applying a 2-s step at -100 mV (inactivation removal), followed by a 400 ms depolarisation at +20 mV (IA inactivation); after a variable interval
at –40 mV, during which IKD inactivation developed, a test pulse to +20 mV was applied
to fully activate any available IKD: the sequence was repeated several times, and the
kinetics of inactivation development were deduced from the decline of the response as a function of the time interval between conditioning and test pulse.