1
Università di Pisa
Engineering PhD School “Leonardo da Vinci”
Corso di Dottorato di Ricerca in
VEICOLI TERRESTRI E SISTEMI DI TRASPORTO
SSD ING/08
Tesi di Dottorato di Ricerca
An Innovative combustion system for
Diesel engines
Author
Tutor
Riccardo Rossi
Prof. Roberto Gentili
3
SOMMARIO
La crescente attenzione alle emissioni di gas-serra e le sempre più stringenti limitazioni delle emissioni inquinanti hanno spinto la ricerca nell’ambito dei motori a combustione interna verso una combustione che consenta simultaneamente un incremento sostanziale dell’efficienza e una forte riduzione delle emissioni.
La presente attività di ricerca si è incentrata sullo studio e lo sviluppo di un nuovo concetto di combustione Diesel ad alta efficienza e basse emissioni. Il concetto consiste nel formare una carica omogenea precompressa all’esterno del cilindro combustore e nel farvela affluire gradualmente nella fase di combustione. In questo modo il controllo della combustione è affidato, anziché all’EGR, all’andamento del trasferimento della carica. Questa nuova tipologia di combustione è stata definita HCPC (Homogeneus Charge Progressive Combustion).
Per realizzare la combustione HCPC si utilizza lo “split-cycle”, nel quale le fasi di aspirazione e di compressione vengono effettuate in un cilindro compressore, dal quale l’aria precompressa viene trasferita nel cilindro combustore attraverso un condotto di trasferimento. Una valvola di trasferimento è posizionata tra il cilindro compressore e il condotto di trasferimento. Durante la fase di trasferimento, nel condotto omonimo viene iniettato il combustibile, che evapora rapidamente e si miscela pressoché omogeneamente con l’aria, per poi bruciare appena giunge in camera di combustione
L’attività svolta durante il Dottorato di Ricerca ha riguardato studio del motore HCPC, sia per applicazioni leggere che pesanti, tramite tecniche di fluidodinamica computazionale (CFD). Nella prima fase dell’attività di ricerca è stata testata la validità del concetto, seguita da studi e sviluppi della geometria del motore. In seguito è stata studiata una versione per applicazioni leggere del motore, che consente di far funzionare il motore stesso con consumi specifici tipici dei motori ad accensione spontanea, a velocità di rotazione tipiche dei motori ad accensione comandata, mantenendo una combustione con basse emissioni di particolato in ogni condizione. È stata poi condotta un’attività di validazione su motori per applicazione pesante, che è consistita nel confronto dei risultati CFD con quelli sperimentali in termini di prestazioni ed emissioni inquinanti. Infine sono state studiate due versioni del motore HCPC per applicazioni pesanti, la seconda delle quali garantisce un’efficienza termica paragonabile a quella dei motori Diesel convenzionali, con bassissime emissioni inquinanti. In effetti il motore HCPC per applicazioni pesanti rispetta la normativa EURO 6 senza bisogno di complicati e costosi sistemi di post-trattamento dei gas di scarico (ad. es. SCR, LNT e/o DPF).
5
ABSTRACT
Due to concerns regarding the greenhouse effect and limitations on carbon dioxide emissions, the possibility of a next-generation combustion mode for internal combustion engines that can simultaneously reduce exhaust emissions and substantially improve thermal efficiency has drawn increasing attention.
The presented research activity was focused on the design and development of an innovative combustion system for Diesel engines. A new approach for a low emission – high efficiency Diesel combustion was conceived: the basic idea is to control the heat release rate by a gradual supply of an almost homogeneous charge in the combustion chamber, without relying on exhaust gas recirculation or extremely diluted mixtures to moderate the combustion reactions. This new approach was defined Homogenous Charge Progressive Combustion (HCPC).
HCPC is based on the split-cycle principle. The intake and compression phases are performed in a reciprocating external compressor, which drives the air into the combustor cylinder during the combustion process, through a transfer duct. A transfer valve is placed between the compressor cylinder and the transfer duct. The compressor piston has a fixed delay, in terms of crank-angle degrees, with respect to the combustor piston. The combustion takes place after combustor TDC, thus, during the combustion process, the combustor piston moves downwards whereas the compressor piston moves upwards. As a consequence, the air moves from the compressor cylinder to the combustor cylinder. Contemporary with the air transfer, fuel is injected into the transfer duct, evaporates and mixes with the air, bringing about the conditions needed for a nearly homogeneous combustion.
The research activity carried out during the PhD course was focused on the CFD study of the HCPC engine, both for Light-Duty and Heavy-Duty applications. Preliminary results were the concept validity was tested are presented, followed by further studies and development of the engine geometry. A light duty version of the engine is firstly presented, which can run at the even better ISFC of Diesel engines at speeds that are typical of SI engines for passenger cars, maintaining a low soot emission combustion. Next a validation activity on Heavy-Duty engines is presented, where the CFD model was tested, both for performance and emission behavior. Finally two versions of an Heavy-Duty HCPC engine are presented, the latter delivering a Diesel-like indicated thermal efficiency, with ultra-clean combustion. As a matter of fact the HCPC Heavy-Duty engine can comply with EURO 6 regulations, without needing complicated and expensive aftertreatment system (i.e. SCR, LNT and/or DPF).
7
ACKNOWLEDGEMENTS
I first of all would like to thanks my advisor Prof. Roberto Gentili, for giving me the chance to follow this amazing path and for his guidance during this years of staying at the University of Pisa. His deep knowledge of the subject gave me insight on the internal combustion engine universe, which I only marginally have begun to explore.
I would also like to thank my colleague Dr. Ettore Musu (Beppe), who taught me more or less everything I know about internal combustion engine numerical simulation, and especially for all the days spent together in the "Labgentili", and all the experiences we had when travelling the world to attend to symposia and conferences.
Dr. Stefano Frigo deserves a mention too, for all the fruitful conversation and the funny moments we had in these years. I will always remember all the pasta "with rinforzino" he cooked for us in the lab.
I also thank all the students I had the chance to work with as an advisor for their bachelor/master thesis work, for all the fun we had toghether.
I also want to thank all my friends in Pisa and at home, for all the fun and support they gave me throughout the years.
Being a PhD student gave me also the opportunity to live one of the most incredible experiences of my life: living and working in Madison, WI.
I had the unique chance to work with Prof. Rolf D. Reitz, who I thank for giving me the opportunity to work at the Engine Research Center, and for his guidance and all the suggestions he gave me during the research meetings.
I would like to thank also all the students, staff and faculties I had the chance to meet and work with at the ERC. A special mention goes to my friend and colleague Dr. Federico Perini (Piero), for the major help he gave me when at work, and especially for sharing with me the experience of living in Madison.
In Madison I gladly happened to be also part of another great "organization", the Madfamily. I will never forget all the family lunches and dinners we had together and I thank all the members of the family for the amazing time we spent together: Alex (Sbatta), Andres, Benè, Diogo (Cugino), Cris, Juliana, Giuseppe, Glaucio, Leandro, Leane, Luis (Palillo), Michele, Simone, Yina (Gina). Finally a special thank goes to my friend, brother, uncle Fays, for feeding me, as he would like to say, and for teaching me all those amazing recipes. I'll never forget that Saturday morning cooking together in the Med Café kitchen.
I would like to thank my parents Battista and Gabriella, who made it possible for me to reach this target, and the ones before this. Without them I won't be the person I am today.
Finally I thank Caterina, for always being at my side, even when there was an Ocean between us.
9
NOMENCLATURE
ATDC = After Top Dead Center BDC = Bottom Dead Center
BMEP = Break Mean Effective Pressure BSFC = Brake Specific Fuel Consumption BTDC = Before Top Dead Center
CA = Crank Angle
CAD = Crank Angle Degree CB = Combustor
CFD = Computational Fluid Dynamics CI = Compression Ignition
CNG = Compressed Natural Gas CO = Carbon Mono-Oxide CP = Compressor
DDM = Discrete Droplet Model DI = Direct Injection
DOC = Diesel Oxidation Catalyst DPF = Diesel Particulate Filter
ECFM-3Z = Extended Coherent Flamelet Model – 3 Zone EGR = Exhaust Gas Recirculation
EOI = End Of Injection
E-S 1, E-S 2 = Engine Sizing 1, Engine Sizing 2 ETVC = Effective Transfer Valve Closure ETVO = Effective Transfer Valve Opening EVC = Exhaust Valve Closure
EVO = Exhaust Valve Opening HC = Unburned Hydrocarbons
HCCI = Homogeneous Charge Compression Ignition HCPC = Homogeneous Charge Progressive Combustion HD = Heavy Duty
HRR = Heat Release Rate
IMEP = Indicated Mean Effective Pressure IVC = Intake Valve Closure
IVO = Intake Valve Opening Kgf = Kilograms Of Fuel
KH-RT = Kelvin-Helmholtz Rayleigh-Taylor LNT = Lean NOX Trap
LPG = Liquefied Petroleum Gas LTC = Low Temperature Combustion NOX = Oxides of Nitrogen
PCCI = Partially Premixed Charge Compression Ignition PM = Particulate Matter
PPRR = Peak Pressure Rise Rate
RANS = Reynolds Averaged Navier Stokes
RCCI = Reactivity Controlled Compression Ignition ROHR = Rate Of Heat Release
RPM = Revolutions Per Minute
SCOTE = Single Cylinder Oil Test Engine SCR = Selective Catalytic Reduction SI = Spark Ignition
SMD = Sauter Mean Diameter SOI = Start Of Injection
TAB = Taylor Analogy Breakup TDC = Top Dead Center TSC = Two-Stage Combustion TVC = Transfer Valve Closure TVO = Transfer Valve Opening
11
TABLE OF CONTENTS
SOMMARIO ... 3 ABSTRACT ... 5 ACKNOWLEDGEMENTS ... 7 NOMENCLATURE ... 9 TABLE OF CONTENTS ... 11 LIST OF FIGURES ... 13 LIST OF TABLES ... 19 CHAPTER 1 ... 21 INTRODUCTION ... 21 CHAPTER 2 ... 29HOMOGENEOUS CHARGE PROGRESSIVE COMBUSTION CONCEPT BACKGROUND ... 29
2.1 INTRODUCTION ... 29
2.2 CONCEPT VALIDATION ... 29
2.3 PROPOSED SOLUTIONS ... 35
2.4 PROPOSED SOLUTIONS CFD ANALYSIS ... 37
2.5 COMBUSTION MODEL ... 49
2.6 RESULTS AND DISCUSSION ... 50
2.6.1 PERFORMANCE RESULTS ... 50
2.6.2 PRESSURE AND HEAT RELEASE RESULTS ... 52
2.6.3 EMISSIONS RESULTS ... 55
2.6.4 Φ-T ANALYSIS ... 57
CHAPTER 3 ... 63
LIGHT DUTY HCPC ENGINE ... 63
3.1 A NEW SPLIT-CYCLE ARCHITECTURE ... 63
3.2 BASELINE ENGINE ... 67
3.2.1 GEOMETRY ... 67
3.2.2 CFD SIMULATION SETUP ... 69
3.2.3RESULTS AND DISCUSSION ... 72
3.3 IMPROVED GEOMETRY ... 77
3.3.1 TRANSFER DUCT GEOMETRY STUDY ... 77
3.3.1 RESULTS AT 2000 RPM ... 82
3.3.2 ENGINE SPEED... 88
3.3.3 EGR STUDY ... 90
3.3.4 WALL HEAT LOSSES ... 94
3.4 LIGHT DUTY HCPC ENGINE WITH A SMALLER COMPRESSOR ... 96
3.4.1 CFD RESULTS ... 97
3.5 HCPC VS CONVENTIONAL DIESEL COMBUSTION: CONCEPTUAL DIFFERENCES .... 103
CHAPTER 4 ... 107
HEAVY DUTY HCPC ENGINE... 107
4.1 MOTIVATION ... 107
4.2 13 LITER ENGINE ... 107
4.2.2 HCPC HEAVY DUTY ENGINE ... 119
4.2.3 RESULTS AND DISCUSSION ... 122
4.2.4 ADIABATIC CASE RESULTS ... 125
4.3 9 LITER ENGINE ... 126 4.3.1 MODEL VALIDATION ... 127 4.3.3 Φ-T ANALYSIS ... 133 CHAPTER 5 ... 137 CONCLUSIONS ... 137 5.1 LIGHT-DUTY HCPC ENGINE ... 137 5.2 HEAVY-DUTY HCPC ENGINE ... 138 BIBLIOGRAPHY ... 141
13
LIST OF FIGURES
FIG 1.1 CONCEPTUAL SCHEMATIC OF CONVENTIONAL DIESEL COMBUSTION ... 22
FIG. 1.2. EQUIVALENCE RATIO-TEMPERATURE MAP FOR SOOT AND NOX FORMATION AND REGIONS FOR CONVENTIONAL DIESEL, SI, HCCI, AND DIESEL LTC ENGINES. ... 24
FIG 1.3 HCCI RESEARCH ACTIVITY OVERVIEW FROM 2001 TO 2010 ... 25
FIG. 2.1. CONCEPTUAL HCPC CONCEPT SCHEME ... 30
FIG. 2.2. COMPUTATIONAL GRID WITH AROUND 20000 CELLS AT TDC. ... 31
FIG. 2.3. PRESSURE PROFILE FOR THE DIFFERENT LOAD CONDITIONS... 31
FIG. 2.4. MEAN TEMPERATURE PROFILE. ... 32
FIG. 2.5. NOX AND SOOT RESULTS FOR CONCEPT VALIDATION SIMULATION. ... 33
FIG. 2.6. TEMPERATURE DISTRIBUTION IN FULL LOAD CONDITION. ... 34
FIG. 2.7. TEMPERATURE DISTRIBUTION IN PARTIAL LOAD CONDITION. ... 35
FIG. 2.8. SCHEMATIC OF THE TWO STROKE SOLUTION. ... 36
FIG. 2.9. SCHEMATIC OF THE FOUR STROKE SOLUTION. ... 37
FIG. 2.10. COMPUTATIONAL GRIDS OF THE TWO-STROKE SOLUTION ... 38
FIG. 2.11. COMPUTATIONAL GRIDS OF THE FOUR-STROKE SOLUTION ... 38
FIG. 2.12. FUEL INJECTION PROFILE. ... 39
FIG. 2.13. PRESSURE AND HRR FOR THE TWO STROKE SOLUTION. ... 41
FIG. 2.14. MEAN TEMPERATURE PROFILE FOR THE TWO STROKE SOLUTION... 41
FIG. 2.15. PRESSURE AND HRR FOR THE FOUR STROKE SOLUTION. ... 42
FIG. 2.16. MEAN TEMPERATURE PROFILE FOR THE FOUR STROKE SOLUTION. ... 42
FIG. 2.17. TEMPERATURE DISTRIBUTION FOR THE TWO-STROKE SOLUTION IN PARTIAL LOAD CONDITION . ... 43
FIG. 2.18. TEMPERATURE DISTRIBUTION FOR THE FOUR-STROKE SOLUTION IN PARTIAL LOAD CONDITION... 44
FIG. 2.19 FLUID DOMAIN AT TDC ... 45
FIG. 2.20 FLUID DOMAIN DURING THE EXHAUST STROKE ... 45
FIG. 2.21 ADDITIONAL CYLINDRICAL SEAL IN THE TRANSFER VALVE... 46
FIG.2.22 TRANSFER VALVE LIFTS ... 46
FIG. 2.23. TRANSFER VALVE LIFT CURVES . ... 47
FIG. 2.24 NORMALIZED INJECTION RATE ... 47
FIG. 2.25 FUEL MASS INJECTED ... 48
FIG. 2.26 SPRAY POSITION IN THE INTAKE DUCT ... 48
FIG. 2.27 IN-CYLINDER PRESSURE WITH DIFFERENT COMBUSTION MODELS (CASE ALFA 28 LINEAR INJ) ... 49
FIG. 2.28 PREDICTED INDICATED POWER ... 51
FIG. 2.29 PREDICTED INDICATED EFFICIENCY ... 51
FIG.2. 30 PREDICTED ISFC ... 52
FIG. 2.31 PRESSURE AND HRR WITH DIFFERENT A/F RATIOS (CASE: CAM 40 SQUARE INJ) 53 FIG. 2.32 PRESSURE AND HRR COMPARISON BETWEEN SQUARE AND LINEAR INJECTION PROFILES ... 53
FIG. 2.33 PRESSURE AND HRR WITH THE TWO INTAKE VALVE LIFTS CONSIDERED (CASE: ALFA 24 LINEAR INJ) ... 53
FIG. 2.34 TEMPERATURE IN A CROSS-SECTION PLANE THROUGH THE VALVE AXIS AND IN THE COMBUSTION CHABER FOR THE TWO INJECTION PROFILES CONSIDERED AT
12°ATDC (CASE: CAM 40 ALFA 24) ... 54
FIG. 2.35 VELOCITY MAGNITUDE AT 3° BTVC WITH THE TWO VALVE LIFTS CONSIDERED (CASE: ALFA 24 LINEAR INJ) ... 54
FIG. 2.36 HC EMISSIONS FOR ALL CASES CONSIDERED... 55
FIG. 2.37 NOX EMISSIONS FOR ALL CASES CONSIDERED ... 56
FIG. 2.38 CO EMISSIONS FOR ALL CASES CONSIDERED ... 56
FIG. 2.39 SOOT EMISSIONS FOR THE CAM 40 CASES ... 57
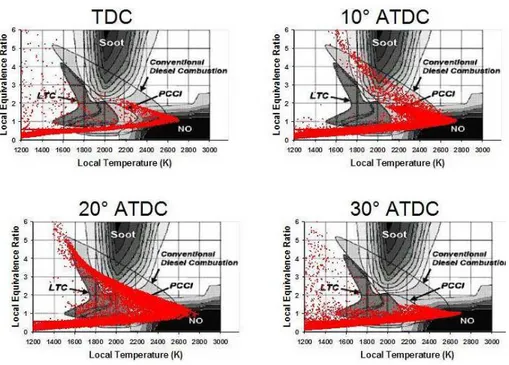
FIG. 2.40 Φ-T MAPS OF THE CASE CAM 40 SQUARE INJECTION ALFA 17 ... 58
FIG. 2.41 Φ-T MAPS OF THE CASE CAM 40 SQUARE INJECTION ALFA 45 ... 59
FIG. 2.42 EQUIVALENCE RATIO IN THE COMBUSTION CHAMBER FOR THE CASE CAM 40 SQUARE INJECTION ALFA 17 ... 59
FIG. 2.43 TEMPERATURE IN THE COMBUSTION CHAMBER FOR THE CASE CAM 40 SQUARE INJECTION ALFA 17 ... 60
FIG. 2.44 EQUIVALENCE RATIO IN THE COMBUSTION CHAMBER FOR THE CASE CAM 40 SQUARE INJECTION ALFA 45 ... 60
FIG. 2.45 TEMPERATURE IN THE COMBUSTION CHAMBER FOR THE CASE CAM 40 SQUARE INJECTION ALFA 45 ... 61
FIG. 3.1 FIRST SCHEME OF THE SPLIT-CYCLE SOLUTION ... 63
FIG. 3.2 PRESSURE TRACES DURING COMBUSTION... 64
FIG. 3.3 SINGLE TRANSFER VALVE SOLUTION WITH THE VALVE ON THE COMBUSTOR SIDE 30°ATDC ... 65
FIG. 3.4 SINGLE TRANSFER VALVE SOLUTION WITH THE VALVE ON THE COMPRESSOR SIDE 30°ATDC ... 65
FIG. 3.5 NEW SPLIT-CYCLE ARCHITECTURE ... 66
FIG. 3.6 FINAL HCPC ENGINE SCHEME ... 66
FIG. 3.7 BASELINE ENGINE COMPUTATIONAL GRID(85000 CELLS AT TDC, HALF-MODEL) .. 67
FIG. 3.8 TRANSFER DUCT GEOMETRY DETAIL ... 68
FIG. 3.9 ONE DIMENSIONAL MODEL ... 70
FIG. 3.10 VALVE LIFT CURVES ... 70
FIG. 3.11 NORMALIZED INJECTION RATE ... 71
FIG. 3.12 SPRAY POSITION IN THE TRANSFER DUCT ... 71
FIG. 3.13 COMBUSTOR AND COMPRESSOR PRESSURE TRACES: EFFECT OF THE INITIAL CONDITIONS ... 72
FIG. 3.14 COMPARISON BETWEEN 1D AND 3D SIMULATION ... 72
FIG. 3.15 COMPRESSOR AND COMBUSTOR INDICATED WORK ... 73
FIG. 3.16 PERFORMANCE INDICATED RESULTS: EFFICIENCY AND POWER ... 73
FIG. 3.17 PRESSURE AND HRR FOR THE TWO EXTREME CASES (A/F 23, 28) ... 74
FIG. 3.18 EMISSION PRODUCTION OF THE HCPC ENGINE ... 74
FIG. 3.19 NORMALIZED HRR FOR THE HCPC AND DIESEL COMBUSTION ... 75
FIG. 3.20 EQUIVALENCE RATIO AND TEMPERATURE MAPS FOR THE HCPC ... 76
FIG. 3.21 TRANSFER DUCT GEOMETRIES CONSIDERED IN THE STUDY ... 78
FIG. 3.22 COMPRESSOR PISTON OF GEOMETRY 3 ... 78
15 FIG. 3.25 TEMPERATURE MAPS DURING COMBUSTION FOR GEOM. 1 (LEFT), GEOM. 2
(MIDDLE) GEOM. 3 (RIGHT) ... 80
FIG. 3.26 OXYGEN CONCENTRATION MAPS DURING COMBUSTION FOR GEOM. 1 (LEFT), GEOM. 2 (MIDDLE) GEOM. 3 (RIGHT) ... 81
FIG. 3.27 HCPC FLUID DOMAIN AT TVO (85000 CELLS AT TDC) ... 82
FIG. 3.28 VALVE LIFT CURVES ... 83
FIG. 3.29 INJECTOR POSITION ... 84
FIG. 3.30 INDICATED POWER AND ISFC VS. EQUIVALENCE RATIO ... 85
FIG. 3.31 SOOT AND NOX EMISSIONS VS. EQUIVALENCE RATIO ... 85
FIG. 3.32 HC AND CO EMISSIONS VS. EQUIVALENCE RATIO ... 86
FIG. 3.33 PRESSURE AND HRR FOR DIFFERENT FUEL AMOUNTS INJECTED ... 86
FIG. 3.34 TEMPERATURE, EQUIVALENCE RATIO, OXYGEN AND SOOT MASS FRACTIONS MAPS FROM TDC TO 60°ATDC FOR THE CASE 22 MG ... 87
FIG. 3.35 ISFC AND INDICATED POWER VS. ENGINE SPEED ... 88
FIG. 3.36 COMPRESSOR AND COMBUSTOR PRESSURES AND HRR DURING COMBUSTION AT 2000 AND 4000 RPM... 89
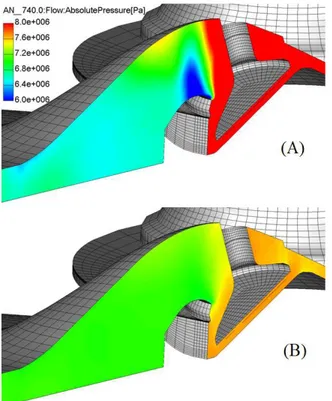
FIG. 3.37PRESSURE IN THE SYMMETRY PLANE AT 4000 RPM (A) AND 2000 RPM (B) 20 CAD ATDC... 89
FIG. 3.38 TEMPERATURE, EQUIVALENCE RATIO AND SOOT MASS FRACTION MASS MAPS DURING COMBUSTION OF THE CASE 16 MG WITHOUT EGR ... 91
FIG. 3.39TEMPERATURE, EQUIVALENCE RATIO AND SOOT MASS FRACTION MASS MAPS DURING COMBUSTION OF THE CASE 16 MG WITH 30% EGR ... 92
FIG. 3.40 PRESSURE AND HRR TRACES WITH DIFFERENT EGR LEVELS ... 93
FIG. 3.41 ISFC AND INDICATED POWER WITH DIFFERENT EGR LEVELS ... 93
FIG. 3.42 SOOT CONCENTRATION DURING COMBUSTION WITH DIFFERENT EGR LEVELS .. 94
FIG. 3.43 SOOT AND NOX EMISSION AND GLOBAL EQUIVALENCE RATIO WITH DIFFERENT EGR LEVELS ... 94
FIG. 3.44 ISFC AND NOX EMISSION INSULATING DIFFERENT ENGINE WALLS ... 95
FIG. 3.45 TURBOCHARGED HCPC FLUID DOMAIN AT TVO (85000 CELLS AT TDC) ... 96
FIG. 3.46 INDICATED POWER AND ISFC VS IMEP AT 2000 RPM (PIN: 100KPA, 200KPA, 300KPA, PEX 100KPA, 190, 270KPA RESPECTIVELY) ... 98
FIG. 3.47 COMBUSTOR (CB) AND COMPRESSOR (CP) PRESSURE TRACES WITH DIFFERENT TURBOCHARGING LEVELS ... 98
FIG. 3.48 INDICATED POWER AND ISFC (Φ=0.75, PIN: 100KPA, 300KPA, PEX 100KPA, 270KPA RESPECTIVELY) ... 99
FIG. 3.49 CB AND CP PRESSURE TRACES AT DIFFERENT ENGINE SPEEDS (PIN=300 KPA, PEX=270 KPA). ... 100
FIG. 3.50 CB AND CP PRESSURE TRACES AT DIFFERENT ENGINE SPEEDS (PIN=100 KPA, PEX=100 KPA). ... 100
FIG. 3.51 FLOW FIELD IN THE SYMMETRY PLANE 20°ATDC AT 2000 RPM (A), 4000 RPM (B), 5000 RPM (C) AND 6000 RPM (D) (PIN=300 KPA, PEX=270 KPA). ... 101
FIG. 3.52 AVERAGE VELOCITY IN THE THROAT SECTION (PIN: 100KPA, 300KPA, PEX 100KPA, 270KPA RESPECTIVELY) ... 101
FIG. 3.53 FROM LEFT TO RIGHT: TEMPERATURE, EQUIVALENCE RATIO AND SOOT MASS FRACTION MASS MAPS DURING COMBUSTION AT 5°, 20°AND 35° ATDC AT 2000 RPM (LEFT) AT 6000 (RIGHT) WITH PIN=300 KPA AND PEX=270 KPA ... 102
FIG. 3.54 POLLUTANT EMISSIONS VS. ENGINE SPEED (Φ=0.75, PIN=300, PEX=270 KPA). ... 103
FIG. 3.55 CONVENTIONAL DIESEL MIXTURE GENERATION ... 104
FIG. 3.56 HCPC MIXTURE GENERATION AND AIR TRANSFER ... 104
FIG. 3.57 CONVENTIONAL DIESEL IN-CYLINDER FLOW FIELD ... 105
FIG. 3.58 HCPC TRANSFER DUCT FLOW FIELD ... 105
FIG. 4.1 DIAGRAM OF EXPERIMENTAL ENGINE SETUP FOR CATERPILLAR SCOTE 3401E .. 108
FIG. 4.2 COMPUTATIONAL GRID OF CATERPILLAR SCOTE 3401E (6700 CELLS AT BDC) .... 110
FIG. 4.3 PRESSURE AND HEAT RELEASE RATE MAIN SOI -5° ATDC ... 110
FIG. 4.4 PRESSURE AND HEAT RELEASE RATE MAIN SOI 20° ATDC ... 111
FIG. 4.5 PRESSURE AND HEAT RELEASE RATE EGR 0% ... 111
FIG. 4.6 PRESSURE AND HEAT RELEASE RATE EGR 30% ... 111
FIG. 4.7 PRESSURE AND HEAT RELEASE RATE INTAKE PRESSURE 0.26 MPA ... 112
FIG. 4.8 PRESSURE AND HEAT RELEASE RATE INTAKE PRESSURE 0.21 MPA ... 112
FIG. 4.9 NOX EMISSION COMPARISON BETWEEN CFD AND EXPERIMENTAL RESULTS WITH DIFFERENT MAIN SOI ... 113
FIG. 4.10 NOX EMISSION COMPARISON BETWEEN CFD AND EXPERIMENTAL RESULTS WITH DIFFERENT EGR % ... 113
FIG. 4.11 NOX EMISSION COMPARISON BETWEEN CFD AND EXPERIMENTAL RESULTS WITH DIFFERENT INTAKE PRESSURES ... 114
FIG. 4.12 SOOT EMISSION COMPARISON BETWEEN CFD AND EXPERIMENTAL RESULTS WITH DIFFERENT MAIN SOI ... 114
FIG. 4.13 SOOT EMISSION COMPARISON BETWEEN CFD AND EXPERIMENTAL RESULTS WITH DIFFERENT EGR % ... 115
FIG. 4.14 SOOT EMISSION COMPARISON BETWEEN CFD AND EXPERIMENTAL RESULTS WITH DIFFERENT INTAKE PRESSURES ... 115
FIG. 4.15 CO EMISSION COMPARISON BETWEEN CFD AND EXPERIMENTAL RESULTS WITH DIFFERENT MAIN SOI ... 116
FIG. 4.16 CO EMISSION COMPARISON BETWEEN CFD AND EXPERIMENTAL RESULTS WITH DIFFERENT EGR % ... 116
FIG. 4.17 CO EMISSION COMPARISON BETWEEN CFD AND EXPERIMENTAL RESULTS WITH DIFFERENT INTAKE PRESSURES ... 117
FIG. 4.18 HC EMISSION COMPARISON BETWEEN CFD AND EXPERIMENTAL RESULTS WITH DIFFERENT MAIN SOI SWEEP ... 117
FIG. 4.19 HC EMISSION COMPARISON BETWEEN CFD AND EXPERIMENTAL RESULTS WITH DIFFERENT EGR % ... 118
FIG. 4.20 HC EMISSION COMPARISON BETWEEN CFD AND EXPERIMENTAL RESULTS WITH DIFFERENT INTAKE PRESSURES ... 118
FIG. 4.21 INDICATED POWER AND TORQUE VS. ENGINE SPEED... 122
FIG. 4.22 COMBUSTOR AND COMPRESSOR MASS VS. CRANK ANGLE FOR E-S 1 AND E-S 2 DURING THE TRANSFER PROCESS BETWEEN THE TWO CYLINDERS. ... 123
FIG. 4.23 INDICATED SPECIFIC FUEL CONSUMPTION VS. ENGINE SPEED ... 123
FIG. 4.24 PRESSURE TRACES VS. CRANK ANGLE AT 2200 RPM ... 124
FIG. 4.25 PEAK PRESSURE RISE RATE ... 124
FIG. 4.26 SOOT AND HC EMISSIONS VS. ENGINE SPEED ... 125
17 FIG. 4.28 COMPUTATIONAL GRID OF THE BENCHMARK-EURO 6 ENGINE. BORE X STROKE:
117X135 MM, DISPLACEMENT (6 CYLINDERS): 8710 CM3 ... 128 FIG. 4.29: PRESSURE AND HRR TRACES FOR THE FULL LOAD CONDITION ... 129 FIG. 4.30: PRESSURE AND HRR TRACES FOR THE FULL PARTIAL CONDITION ... 130 FIG. 4.31: PRESSURE AND HRR TRACES IN HCPC AND CONVENTIONAL DIESEL ENGINE, FOR THE FULL LOAD CONDITION ... 131 FIG. 4.32: PRESSURE AND HRR TRACES IN HCPC AND CONVENTIONAL DIESEL ENGINE, FOR THE PARTIAL LOAD CONDITION ... 132
19
LIST OF TABLES
TAB. 2.1. SIMULATION SETTINGS FOR THE CONCEPT VALIDATION. ... 30
TAB. 2.2. SIMULATION SETTINGS FOR THE PROPOSED SOLUTIONS ... 40
TAB. 2.3 SPECIFICATIONS OF THE HCPC COMBUSTOR ... 45
TAB. 2.4 BOUNDARY CONDITION OF THE FLUID DOMAIN CONSIDERED ... 46
TAB. 2.5 SPRAY BOUNDARY CONDITIONS ... 48
TAB. 2.6 EMISSIONS RESULTS WITH DIFFERENT COMBUSTION MODELS ... 50
TAB. 3.1 COMPRESSOR AND COMBUSTOR SPECIFICATION ... 68
TAB. 3.2 VALVE TIMINGS ... 68
TAB. 3.3 INITIAL AND BOUNDARY CONDITION ... 70
TAB. 3.4 INJECTION BOUNDARY CONDITION ... 71
TAB. 3.5 HCPC-DIESEL EMISSION COMPARISON ... 77
TAB. 3.6 SIMULATION PARAMETERS ... 79
TAB. 3.7 INJECTION BOUNDARY CONDITION ... 80
TAB. 3.8 COMPRESSOR AND COMBUSTOR SPECIFICATION ... 82
TAB. 3.9 VALVE TIMINGS ... 83
TAB. 3.10 INITIAL AND BOUNDARY CONDITION ... 83
TAB. 3.11 INJECTION BOUNDARY CONDITION ... 84
TAB. 3.12 CASES CONSIDERED FOR THE WALL HEAT LOSSES STUDY ... 95
TAB. 3.13 COMPRESSOR AND COMBUSTOR SPECIFICATION ... 96
TAB. 3.14 INITIAL AND BOUNDARY CONDITION ... 97
TAB. 3.15 INJECTION BOUNDARY CONDITION ... 97
TAB. 4.1 SCOTE 3401 E ENGINE SPECIFICATIONS ... 109
TAB. 4.2 OPERATING CONDITIONS ... 109
TAB. 4.3 ENGINE SIZING 1 SPECIFICATIONS ... 119
TAB. 4.4 ENGINE SIZING 2 SPECIFICATIONS ... 120
TAB. 4.5 INITIAL AND BOUNDARY CONDITION ... 121
TAB. 4.6 INJECTION BOUNDARY CONDITION ... 121
TAB.4.7 BOUNDARY CONDITION: WALL TEMPERATURES ... 122
TAB. 4.8 WALL INSULATION EFFECT (1900 RPM, PHI 0.8) ... 126
TAB. 4.9 9L HCPC ENGINE SPECIFICATIONS ... 127
TAB. 4.10 SOOT EMISSIONS KINETIC MODEL FOR TETRADECANE ... 128
TAB 4.11 FULL LOAD CONDITION BOUNDARY CONDITION ... 131
TAB 4.12 PARTIAL LOAD CONDITION BOUNDARY CONDITION ... 131
TAB 4.13 EFFICIENCY AND EMISSIONS RESULTS FOR THE FULL LOAD CONDITION ... 133
21
Chapter 1
INTRODUCTION
Internal combustion engines have played a fundamental role in the power generation and transportation fields for over a century. However, due to concerns regarding the greenhouse effect and limitations on carbon dioxide emissions, as well as limited petroleum supplies, the possibility of a next-generation combustion mode for internal combustion engines that can simultaneously reduce exhaust emissions and substantially improve thermal efficiency has drawn increasing attention.
Therefore, interest in compression-ignition engines has increased both for Light-Duty and Heavy-Duty applications, being CI engines the most fuel-efficient engines developed for transportation purposes, due largely to their relatively high compression ratios and lack of throttling losses.
However, conventional Diesel engines have relatively high emissions of nitric oxides (NOX) and soot, which represent the biggest challenge for
engine design and development engineers. Although these emissions have been significantly reduced in recent years, further reductions are required to meet the increasingly stringent regulations for nowadays and beyond. EURO regulations, for instance, require a drop of 80% for NOX emissions
and 50% for soot emissions when moving from EURO 5 to EURO 6 for Heavy-Duty Diesel engines applications. Similar requirements are also determined by the United States or Japanese regulations [1]. Meeting the current emission regulations for Diesel engines has required the development of a thorough understanding of the in-cylinder processes, to try to reduce to as low as possible values in-cylinder pollutant generation. Thanks to numerous investigations, conducted mostly using advanced laser-imaging diagnostics, a greatly improved understanding of Diesel combustion was achieved, summarized by the schematic in Fig. 1.1 [2, 3]. This understanding, has been guiding engineers in substantially reducing Diesel emissions over the past fifteen years. Solutions to improve Diesel combustion were developed, like increased injection pressure, common rail systems, EGR, improved piston-bowl geometries, improved in-cylinder flows, and so on. However, Fig. 1.1 also shows the factors that limit the reduction of emissions with traditional Diesel combustion. The fuel and air first react in a fuel-rich mixture, leading to soot formation, then this rich mixture burns out in a high-temperature diffusion flame at the jet periphery, leading to NOX formation [4]. Therefore, it appears unlikely that
future emission requirements without complicated and expensive aftertreatment systems, like Diesel Particulate Filter (DPF) for soot emission, and Selective Catalytic Reduction (SCR) or Lean NOX Trap (LNT)
for NOX emissions. These systems have a number of drawbacks, besides
their cost. DPF and LNT work as traps, therefore they need to be periodically regenerated, by injecting additional amounts of fuel either in the cylinder during the exhaust phase or in the exhaust line, worsening fuel consumption. SCR, instead, needs to be supplied with ammonia to complete the reduction reactions needed to lower tailpipe NOX emissions,
thus requiring an additional tank for ammonia storage.
Fig 1.1 Conceptual schematic of conventional Diesel combustion
Due to the conventional Diesel combustion limits, researchers and development engineers have been turning to alternative forms of CI combustion, which mostly rely on the principle of dilute premixed or partially premixed combustion to reduce emissions. This approach is exemplified by a technique commonly known as homogeneous charge compression-ignition (HCCI) [5]. In this combustion strategy, fuel is injected and well premixed with air before ignition, thus avoiding fuel-rich regions leading to reduction of soot emissions. Combustion takes place at the same time in the whole combustion chamber, since lean mixture is used and charge is diluted with exhaust products. Because of the high dilution, combustion temperatures are low, resulting in low NOX emissions. Because of these
23 underway using a variety of fuels, including gasoline, Diesel fuel, ethanol, natural gas, and so on.
On the other hand, since HCCI is triggered by homogenous charge spontaneous ignition during compression, combustion timing and control are not easily manageable (in conventional S.I and C.I engines the control is achieved by spark timing and injection timing, respectively), thus high peaks in the heat release profile can be observed, leading to high pressure gradients, causing intolerable combustion noise, and mechanical stress. These drawbacks are seen in particular when using Diesel fuel, due to its low volatility and the ease with which it autoignites (high cetane number). Therefore, researchers are pursuing alternative approaches to achieve HCCI-like combustion, commonly referred to as Diesel Low-Temperature combustion (LTC). With Diesel LTC, various techniques are applied to obtain sufficient premixing so that combustion temperature and equivalence ratio combinations that lead to soot and NOX formation are avoided.
A better understanding of benefits coming from HCCI and LTC can be achieved through the equivalence ratio (Φ)-temperature diagram in Fig. 2.1. The diagram shows contour plots of the Φ-temperature combinations at which soot and NOX formation occur.
In conventional Diesel combustion, the fuel and air first react in a rich mixture at about Φ = 4, and then combustion goes to completion in a stoichiometric (Φ = 1) diffusion flame. Assuming that the combustion is nearly adiabatic, Fig. 2.1 shows that these combustion zones fall in the soot and NOX regions, respectively, leading to high levels of emissions. Also
shown in Fig. 2 is the HCCI combustion region, which falls outside the soot– and NOX –formation regions.
However, not only HCCI can avoid both pollutant generation zones; Diesel LTC, for instance, allows combustion to occur anywhere in the gray-shaded region, while trying to insure that most of the fuel is mixed and burned at Φ ≤ 1, like in HCCI combustion. Thus, although Diesel LTC combustion is not fully premixed, it uses essentially the same principles as HCCI to obtain low emissions. Current research and development efforts for advanced CI engines are directed at overcoming the difficulties of implementing HCCI and Diesel LTC in practical engines.
Fig. 1.2. Equivalence Ratio-temperature map for soot and NOX formation and regions for conventional Diesel, SI, HCCI, and Diesel LTC engines.
Fig. 1.3 shows the huge amount of work that was put into HCCI combustion research during the last decade [6]. The subject of the different research activity span from fuels to mode switching (from conventional to HCCI operation and vice versa), from mixture preparation to boosting, from experimental optical analysis to numerical simulation, and so on.
As of today, HCCI applications remain mostly limited to research labs, except from a few production models, which run in HCCI operation only for a limited range of BMEP and engine speed.
LTC shows similar drawbacks with respect to HCCI, if particular charge stratification techniques or high level of dilution/EGR are not employed. Charge stratification primarily includes stratification of concentration, composition, and temperature, all of which have important influences on ignition, combustion rate, emissions, and load extension.
Fuel design and management can be used to optimize LTC combustion within the full load range and have the potential to control ignition timing and combustion rate, eliminate misfire at light loads and knock problems at heavy loads, and maintain Diesel-like thermal efficiency throughout the full engine operational range. Strategies based on the combination of port injection and in-cylinder direct injection of fuels with different physico-chemical properties can produce in-cylinder mixture stratification, composition stratification, and temperature stratification.
25
Therefore, the ignition timing, combustion phasing, and heat release characteristics of the full engine operational range can be adjusted for engine performance and emission optimization.
This strategy is employed in the Reactivity Controlled Compression Ignition system (RCCI). The concept consist in performing in-cylinder fuel blending of two fuels with different reactivity. By using in-cylinder fuel blending, the fuel reactivity can be adjusted on a cycle-to-cycle basis by changing the injected quantities of, for instance, gasoline and Diesel fuel to optimally accommodate engine load and speed changes. Furthermore, reactivity stratification may be beneficial in reducing combustion noise.
Fuel stratification addresses several issues associated with kinetic control of the combustion event, such as lack of combustion phasing control at high engine loads and excessive rates of pressure rise.
Kokjohn et al. [7] proved the RCCI engine to achieve NOX and soot
emissions below latest emissions regulations limits (EURO 6, EPA 2010) for both Light-Duty and Heavy-Duty applications, with gross indicated efficiencies above 50 per cent.
The research activity presented in this thesis, aims at a similar result as the one achieved by the RCCI combustion: developing a EURO 6/EPA 2010 compliant engine, with no need of latest-technology aftertreatment systems. A new approach for a low emission – high efficiency Diesel combustion was conceived: the basic idea is to control the heat release rate by a gradual supply of an almost homogeneous charge in the combustion chamber, without relying on exhaust gas recirculation or extremely diluted mixtures to moderate the combustion reactions. This new approach was defined Homogenous Charge Progressive Combustion (HCPC).
HCPC is based on the split-cycle principle. The intake and compression phases are performed in a reciprocating external compressor, which drives the air into the combustor cylinder during the combustion process, through a transfer duct. A transfer valve is placed between the compressor cylinder and the transfer duct. The compressor piston has a fixed delay, in terms of crank-angle degrees, with respect to the combustor piston. The combustion takes place after combustor TDC, thus, during the combustion process, the combustor piston moves downwards whereas the compressor piston moves upwards. As a consequence, the air moves from the compressor cylinder to the combustor cylinder. Contemporary with the air transfer, fuel is injected into the transfer duct, evaporates and mixes with the air, bringing about the conditions needed for a nearly homogeneous combustion.
In the next chapters the HCPC concept will be described and validated, both for Light-Duty and Heavy-Duty applications.
29
Chapter 2
HOMOGENEOUS
CHARGE
PROGRESSIVE
COMBUSTION CONCEPT BACKGROUND
2.1 INTRODUCTION
The HCPC concept consists in forming a pre-compressed homogenous charge outside the cylinder and in gradually admitting the charge into the cylinder during the engine combustion phase, so that combustion control is delegated to the charge transfer process.
In the original concept, the charge was formed during the air transfer to the cylinder from a constant-pressure tank. Thus combustion takes place at virtually constant pressure during the first part of the downward stroke of the piston. Combustion behavior is controlled by the transfer rate and soot emissions can be extremely contained in every operating condition. Therefore it is possible to use EGR only to limit NOX emissions, which can
be reduced to the level typical of the Low-Temperature combustions.
In the first part of the research activity a first analysis was addressed to the feasibility of the concept and subsequently two different realizations were considered. Both these proposed solutions were then compared with a Diesel combustion case in terms of pressure, heat release rate, temperature and emissions production.
2.2 CONCEPT VALIDATION
A first CFD analysis was performed to test the validity of the concept, regardless of which effective solution would be adopted. A single cylinder filled with a perfectly stirred mixture of air and Diesel fuel was considered in the simulation. A constant pressure inlet surface connecting the cylinder with a transfer duct is also modeled. Figure 2.1 shows a conceptual scheme of the HCPC concept [8].
Fig. 2.1. Conceptual HCPC concept scheme
The simulation starts at TDC with initial conditions reported in Tab. 2.1. Transfer and combustion phase occur at the beginning of the downward piston stroke. Cylinder pressure is kept constant thanks to proper transfer flow rate.
Displacement (cm3) 1932
Bore (mm) 135
Stroke (mm) 135
Engine speed (rev/min) 2400
Global equivalence ratio
(Full load /1/3 of Max. load) 0.588 / 0.196
Initial P (MPa) 6.8
Initial T (K) 1150
Tab. 2.1. Simulation settings for the concept validation.
In Fig. 2.2 the computational grid of about 20000 cells at TDC is reported. The simulations were performed using AVL FIRE release 8.5 [9]. The turbulence model based on the RANS method is the two-equation K-ε model, very common in computational fluid dynamics, which takes into account the effects of turbulence in the mean flow. Ignition and combustion
31 were simulated using the AVL DIESEL [10] autoignition model coupled with the Eddy Breakup Model.
Only the combustion phase was simulated, starting from TDC while the charge begins entering the cylinder. Initial conditions for pressure and temperature were calculated by a zero-dimensional code.
Two different load conditions (full load and 30% of maximum load) were considered. In Fig. 2.3 pressure profile and heat release rate are given for full and partial load conditions. These plots show that combustion occurs with almost constant pressure. The heat is released in a gradual way as
Fig. 2.2. Computational grid with around 20000 cells at TDC.
0 1 2 3 4 5 6 7 8 360.0 380.0 400.0 420.0 440.0
Crank Angle (°ATDC)
P re s s u re ( M P a ) 0 20 40 60 80 100 120 140 160 180 200 Full Load Partial Load H R R ( J /d e g )
Fig. 2.3. Pressure profile for the different load conditions. Inlet Head
well, as it was expected. The obtaining of almost constant pressure combustion allows using high engine compression ratio and consequent high initial pressure and temperature conditions, satisfying the basic idea of Diesel cycle of obtaining the highest efficiency for a given maximum admissible pressure, as well as noiseless and smooth engine operation. As in the Diesel ideal cycle, the maximum (constant) pressure part of the thermodynamic cycle, depends on the engine load. In Fig. 2.4 mean temperature distributions are given for full and partial load condition. In Fig. 2.5 NOX and soot emission results are given. In Figs. 2.6 and 2.7
temperature distributions are reported for the two considered load conditions at two fixed crank angles. It can be observed that local temperatures are fairly low, thanks to homogeneous charge burning in the cylinder. 0 500 1000 1500 2000 2500 360 390 420 450 480
Crank Angle (°ATDC)
T e m p e ra tu re ( K ) Full Load Partial Load
33 0 0.01 0.02 0.03 0.04 0.05 0.06 0.07 0.08 350 380 410 440 470 500
Crank Angle (°ATDC)
N O x ( g /k g f) 0.0E+00 5.0E-06 1.0E-05 1.5E-05 2.0E-05 2.5E-05 3.0E-05 3.5E-05 S o o t ( g /k g f)
NOx Full Load NOx Partial Load Soot Full Load Soot Partial Load
Fig. 2.5. NOX and soot results for concept validation simulation.
Fig. 2.6. Temperature distribution in full load condition. 20 deg ATDC
35
Fig. 2.7. Temperature distribution in partial load condition.
2.3 PROPOSED SOLUTIONS
As previously mentioned, in this preliminary study two different solutions are proposed to achieve the gradual admission of a pre-compressed homogenous charge during combustion in the cylinder. The first one involves the two-stroke cycle, the other the four-stroke one, as the sketches reported on Figs. 2.8 and 2.9 show.
The first solution (Fig. 2.8) is based on the split cycle concept, with intake and compression phases performed outside the cylinder. Compression is realized by an external volumetric compressor which drives the air into a tank, sized to keep pressure nearly constant. The external compressor performs the same compression work, which would be accomplished by a four stroke conventional cylinder, during the compression phase. The compressor displacement, in a first approximation, is the same of the cylinder. The high-temperature compressed air is transferred to the cylinder through an inlet valve during the combustion phase. Contemporary with the air transfer, fuel is injected into the transfer duct, evaporates and mixes with air, bringing about the conditions for homogeneous combustion. Compressor work recovery takes place during the downward piston stroke, due to engine work produced by the transferred air.
37
Fig. 2.9. Schematic of the four stroke solution.
In the second solution, based on the four-stroke cycle (Fig. 2.9), the air is directly compressed by the piston during the compression stroke. The maximum pressure is reached before the piston arrives to TDC; then compressed air begins entering a secondary chamber which is in constant communication with the cylinder. The volume of this secondary chamber, theoretically starting from zero, varies keeping the pressure constant during the last part of the compression stroke and the combustion, thanks to a moving wall over which a constant pressure acts (the volume must be large enough to minimize pressure oscillations due to wall movement; a small compressor generates the needed pressure and compensates air leakages). When the piston begins its down-stroke, air is transferred back into the cylinder while fuel is injected, evaporates and mixes with air, bringing about the conditions for homogeneous combustion.
Both solutions allow achieving constant combustion pressure, satisfying the basic idea of Diesel cycle. This allows obtaining the highest efficiency for a given maximum admissible pressure, as well as noiseless and smooth engine operation, because peak pressure is gradually reached during the compression stroke. Mechanical efficiency is also improved due both to the absence of pressure peaks and to the consequent reduction of reciprocating masses.
2.4 PROPOSED SOLUTIONS CFD ANALYSIS
CFD simulations were performed to study both the two-stroke and the four-stroke solutions. Pressure, heat release rate and temperature distribution results are shown. The injection process was taken into account in this part of the study, using the Discrete Droplet Model (DDM) [11] together with the Taylor Analogy Breakup (TAB) model and the Dukowicz evaporation model [12] for the spray behavior prediction. Emissions model as Zeldovich and Kennedy-Hiroyasu-Magnussen [10] were used to predict NOX and soot
production respectively. Ignition and combustion models are the same used in the concept validation part.
Two different load conditions were considered taking injection and mixing processes into account. Differently from the previous case, boundary and initial conditions were calculated using the AVL BOOST release 5.0 [13] one-dimensional code. In Figs. 2.10 and 2.11 the computational grids for the two solutions are shown.
Both grids used in the simulations contained around 40000 cells at TDC. In both the two-stroke and the four-stroke solutions of Figs. 2.8 and 2.9 pressure is supposed to be kept nearly constant in the transfer duct thanks to the constant pressure tank and to the moving wall respectively. Therefore the air transfer is influenced only by the pressure in the
combustion chamber, which allows considering only the combustion chamber and the transfer duct in the computational domain. An inlet surface was placed at the boundary of the duct with a static pressure of 2.8 MPa, as obtained from the one-dimensional simulation.
Fig. 2.10. Computational grids of the two-stroke solution
39 Air transfer and combustion phases only were considered in the simulations, therefore in the four-stroke domain the intake and exhaust valves were not represented. In the two-stroke solution only the transfer valve was considered. The fuel is injected by means of an 8-hole Diesel injector located inside the transfer duct, on its symmetry plane (Figs. 2.10 and 2.11: arrows point out the injection direction). In Fig. 2.12 the fuel injection rate is given. A pre-injection, was performed before TDC to reduce the ignition delay, leading to a smoother heat release. Apart from pressure waves, the air mass enters the cylinder according to the piston velocity. For the main injection rate, a triangular shape was assumed, approximating piston velocity behavior soon after TDC. This approximation is reasonable, since main injection covers only a very short part of the piston stroke. The simulation settings are reported in Table 2.2.
-0.2 0 0.2 0.4 0.6 0.8 1 1.2 345 355 365 375 385
Crank Angle (°ATDC)
N o rm a li z e d I n je c ti o n R a te
Fig. 2.12. Fuel Injection profile.
In Figs. from 2.13 to 2.16 pressure, heat release rate and mean temperature profiles are given for both the two-stroke and the four-stroke solutions in the different load conditions.
Likewise in the concept validation results, pressure remains almost constant during the combustion phase and heat is released in a gradual way as well. However, bigger pressure oscillations are present at the beginning of air transfer due to pressure losses in the transfer duct, not considered in the concept validation calculations. Comparing the HRR profiles it appears that the Two-Stroke combustion is longer than the Four Stroke one.
Displacement (cm3) 1932
Bore (mm) 135
Stroke (mm) 135
RPM (rev/min) 2400
Inlet P (MPa) 6.8
Injector Type 8 nozzle equally-spaced
Multihole injector
Injector pressure (MPa) 150
Included angle (deg) 75
Global equivalence ratio
(Full load /1/3 of Max. load) 0.588 / 0.196
Full Load Main Injection duration
(DOI) (ca) 20
Main Injection timing (SOI) (ca) 360
Tab. 2.2. Simulation settings for the proposed solutions
This is probably due to the fact that, the injection profile was the same adopted in the Four Stroke case which does not match with the real air flow in the cylinder during the transfer phase.
Temperature distributions for the two solutions in partial load condition are reported in Figs. 2.17 and 2.18 at two different crank angles. These figures show that low combustion temperatures are kept everywhere in the chamber. However, compared with the concept validation results, temperatures are much less homogeneous, proving that injection and mixing processes were not yet optimized.
Even though the presented early results encouraged to proceed the studies on both solutions, the four stroke solution was abandoned in an early stage mainly because of constructive problems (moving wall design and realization) and only the split-cycle solution was considered in the following of the research.
41 0 1 2 3 4 5 6 7 8 9 10 300 320 340 360 380 400 420
Crank Angle (°ATDC)
P re s u re ( M P a ) 0 50 100 150 200 250 300 350 400 450 500 Full Load Partial Load H R R ( J /d e g )
Fig. 2.13. Pressure and HRR for the two stroke solution.
500 700 900 1100 1300 1500 1700 345 375 405 435 465 495
Crank Angle (°ATDC)
T e m p e ra tu re ( K ) Full Load Partial Load
0 1 2 3 4 5 6 7 8 9 10 300 320 340 360 380 400 420
Crank Angle (°ATDC)
P re s s u re ( M P a ) 0 50 100 150 200 250 300 350 400 450 500 Full Load Partial Load H R R ( J /d e g )
Fig. 2.15. Pressure and HRR for the four stroke solution.
500 700 900 1100 1300 1500 1700 345 375 405 435 465 495
Crank Angle (°ATDC)
T e m p e ra tu re ( K ) Full Load Partial Load
43
Fig. 2.17. Temperature distribution for the two-stroke solution in partial load condition .
10 deg ATDC
Fig. 2.18. Temperature distribution for the four-stroke solution in partial load condition.
10 deg ATDC
45 The studies on the split cycle solution were continued [14] with a new computational grid, reported in Figs 2.19 and 2.20 For a better understanding of this new combustion concept the geometries of the intake duct, intake valve, and the combustion chamber were represented in the simplest possible way. For the same reasons a single-hole fuel injector was adopted. As in the previous part of the work, tank and compressor geometries were not considered in the computational domain, due to the assumption of constant pressure in the tank.
Fig. 2.19 Fluid domain at TDC
Fig. 2.20 Fluid domain during the exhaust stroke
Displacement 441 cm3
Bore 86 mm
Stroke 76 mm
Compression ratio 50:1
IVO (CAM 40, CAM 46) -21°, -23° ATDC
IVO Effective -5°ATDC
IVC (CAM 40, CAM 46) 51°, 57° ATDC
IVC Effective (CAM 40,
CAM 46) 35°, 41° ATDC
EVO 175° ATDC
EVC -74° ATDC
The combustor specifications are summarized in Tab. 2.3. The geometry and the computational grid were generated using the ICEM-CFD software. The grid used in the simulations contained about 40,000 cells at TDC. An inlet surface was positioned at the boundary of the duct with a static pressure of 7 MPa and a temperature of 1020 K (see Tab. 2.4). Pressure and temperature were determined with zero-dimensional calculation for the boundary inlet condition and with the one-dimensional code AVL BOOST for the initial conditions
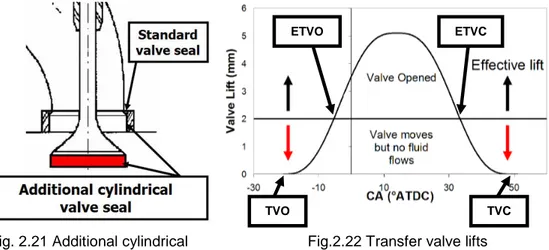
The transfer valve opens and closes in a narrow angular phasing (around 40 CAD). In order to allow wider cam phasing, and therefore feasible valve accelerations, the transfer valve is characterized by an additional cylindrical seal (Figs. 2.21, 2.22). The valve starts moving at TVO and closes at TVC but its effective opening (ETVO) and closing (ETVC) occur when the transfer valve clears and closes the cylindrical seal.
The calculations started at ETVO, when the valve clears its cylindrical seal, and consider the complete cycle of the combustor, namely: intake-combustion, expansion, exhaust, and recompression phases.
Engine Cycle Two-Stroke
Engine speed 2000 rpm
Inlet T, P 1020 K, 7 MPa
Intake Initial T, P 1020 K, 7 MPa
Combustion Chamber Initial P and T
T: 1630 - 1750 K P: 4.8 - 5.5 MPa
Simulation Start -5° ATDC
Simulation End 355° ATDC
Tab. 2.4 Boundary condition of the fluid domain considered Fig. 2.21 Additional cylindrical
seal in the transfer valve
Fig.2.22 Transfer valve lifts
TVO ETVO
TVC ETVC
47
Fig. 2.23. Transfer valve lift curves .
24 cases were considered for the CFD simulations that represent all the combinations of the two valve lift curves considered (CAM 40, 46) (Fig. 2.23), two injection rate profiles (SQUARE, LINEAR) (Fig. 2.24) and six A/F (ALFA 17-45) (Fig. 2.25) for each case. The designation of each case is CAM 40/46, SQUARE/LINEAR INJECTION, ALFA 17–45.
The simulations were performed using AVL FIRE release 8.52. The turbulence model based on the RANS (Reynolds Average Navier Stokes) method is the two-equation K-ζ-f model, which takes into account the effects of turbulence in the mean flow. For the injection process, the Discrete Droplet Model (DDM) was used together with the KH-RT model [15] and the Dukowicz evaporation model. The spray nozzle is located in the intake duct in a vertical orientation, as shown in Fig. 2.26. The spray boundary conditions used in the simulations are summarized in Table 2.5.
0 0.2 0.4 0.6 0.8 1 1.2 -10 0 10 20 30 40 CA (°ATDC) N o rm a li z e d I n je c ti o n R a te CAM 40 SQUARE CAM 46 LINEAR CAM 46 SQUARE CAM 46 LINEAR
14 16 18 20 22 24 26 28 30 32 34 36 15 20 25 30 35 40 45 50 Air/Fuel F u e l In je c te d ( m g ) CAM 40 CAM 46
Fig. 2.25 Fuel mass injected
Injection Type Intake Duct Injection
Fuel C14H30
Fuel Temperature 363 K
SOI (°ATDC) -5
Injector Single-Hole
DOI (CAM 40, CAM 46) 35° CA, 41° CA
Fuel Injected 15-35 mg (see Fig. 15)
Nozzle Diameter 256 µm
Cone Angle 22°
Injection profile Square, Linear (see
Fig.14) Tab. 2.5 Spray Boundary conditions
49
2.5 COMBUSTION MODEL
Being HCPC combustion process different both from HCCI/LTC and conventional Diesel, a simulation activity on a test case was performed, to choose the proper combustion model. Three different models were tested on the same case, namely: the Characteristic Timescale Model [16], ECFM-3Z and coupling the chemical kinetics solver Chemkin with the FIRE code. The ERC n-heptane mechanism [17] with 34 species and 74 reactions was used. This mechanism has been widely employed for Diesel combustion calculations because of its similar ignition characteristics of n-heptane to those of conventional Diesel fuel [18].
The simulation results were considered to be very encouraging, being the predicted pressure traces were very similar for the three cases (Fig. 2.27). In particular, the ECFM-3Z and the Chemkin pressure traces are pretty much the same.
0 1 2 3 4 5 6 7 8 -5 5 15 25 35 45 55 65 75 85 CA (°ATDC) P re s s u re ( M P a ) ECFM - 3Z P CTM P CHEMKIN
Fig. 2.27 In-cylinder pressure with different combustion models (case ALFA 28 LINEAR INJ)
As far as emissions are concerned, (Tab. 2.6) the very simplified CTM model is unfit to predict NOX emissions, and needs a complementary NOX
model to do so [19]. Moreover it predicts and a very high CO value, but HC emissions are of the same order of magnitude as in the other models. The Chemkin and ECFM-3Z models are in the closest agreement, apart from NOX emissions that seem to be underestimated with ECFM-3Z.
Chemkin results were trusted to be more accurate and more reliable. For those reasons the reduced chemical kinetic mechanism was chosen for this part of the HCPC simulation activity, even though the calculation time was almost an order of magnitude longer than that of the other models.
CHEMKIN ECFM-3Z CTM
HC [g/kg-f] 22.7 28.8 34.2
NOX [g/kg-f] 31.0 7.8 0.0
CO [g/kg-f] 34.8 38.8 485.3
Tab. 2.6 Emissions results with different combustion models
2.6 RESULTS AND DISCUSSION
2.6.1 PERFORMANCE RESULTS
HCPC engine performance was calculated using CFD results for the combustor and by modeling the external compressor considering an adiabatic compression with 90% polytrophic indicated efficiency. The indicated data were derived from the indicated work calculated with:
compressor combustor
W
W
Work
Indicated
_
=
−
where:(
) (
)
[
]
∑
∫
= ⋅ + − ⋅ − − = = n n n n n n Fire combustor p dV p p V V W 0 1 1 5 . 0 − − ⋅ = − n n r icompresso Fire compressor P P n nRT M W 1 1 2 1 1 1η
FireM : Air mass delivered (calculated with FIRE)
9 . 0 = r icompresso
η : Compressor Polytrophic Indicated efficiency
K
T1=303 : Compressor intake temperature
4 . 1 = n : Polytrophic exponent MPa
P2=7 : Outlet compressor pressure, Tank Pressure
MPa
P1=0.1 : Inlet compressor pressure
[
J kgK]
R=286.9 / : Specific gas constant for dry air
Figures 2.28, 2.29 and 2.30 show indicated power and efficiency results obtained with the simulation activity. Indicated power decreases increasing A/F ratio, due to the less fuel mass injected. With a wider cam phase angle air mass delivered increases, thus compressor work increases as well. However part of the compressor work is recovered, due to engine work produced by the transferred air in the combustor during the expansion
51 stroke of the piston. The net effect is an increase of power with a wider cam phase.
Indicated efficiency varies with A/F ratio and reaches a maximum for A/F ratio around 30 for all cases with CAM 40 and at around 35 for the cases with CAM 46. The best results were obtained using the linear injection ramp rate, especially with higher A/F ratios.
8 9 10 11 12 13 14 15 16 17 18 15 20 25 30 35 40 45 50 Air/Fuel In d ic a te d P o w e r [k W ] CAM 40 SQUARE CAM 40 LIN CAM 46 SQUARE CAM 46 LIN
Fig. 2.28 Predicted Indicated Power
32% 34% 36% 38% 40% 42% 44% 46% 15 20 25 30 35 40 45 50 Air/Fuel In d ic a te d E ff ic ie n c y CAM 40 SQUARE CAM 40 LIN CAM 46 SQUARE CAM 46 LIN
170 190 210 230 250 270 15 20 25 30 35 40 45 50 Air/Fuel IS F C [ g /k w h ] CAM 40 SQUARE CAM 40 LIN CAM 46 SQUARE CAM 46 LIN
Fig.2. 30 Predicted ISFC
2.6.2 PRESSURE AND HEAT RELEASE RESULTS
Figures 2.31 to 2.33 show cylinder pressure and HRR comparisons for the different cases studied. For all cases the pressure remains almost constant during combustion, proving that the basic idea of the HCPC concept is accomplished. No large pressure gradients are present and the maximum peak pressure rise rate for the worst case is 0.25 MPa per degree, which benefits mechanical efficiency and engine noise compared to other types of HCCI/LTC combustion, and even with standard Diesel combustion.
As mentioned in the previous paragraph the linearly increasing injection rate profile gave better results than the square one in most of the cases. Figure 2.31 shows Pressure and HRR with different A/F ratios for the case CAM 40 SQUARE INJ. The pressure curves of the case A/F 24 is very close to the case A/F 17 despite the fact that the fuel amount is 25% less with benefits in the efficiency, as shown in Figure 2.29.
From Fig. 2.32 it can be seen that the pressure oscillations have lower amplitude and the heat release rates have a smaller peak around 5°ATDC because less fuel is added in the first part of the combustion. After this peak the HRR and the pressure start to decrease. This happens because there is some back flow and combustion starts to propagate also into the intake port. The air mass flow rate is, in fact, proportional to the piston velocity and inversely proportional to the heat released in the chamber. Therefore, with the linear injection profile there is less back flow combustion, as seen in Fig. 2.34, with consequent advantages in the thermal efficiency, as seen in Fig. 2.29.
53 0 1 2 3 4 5 6 7 8 -5 5 15 25 35 45 55 65 75 85 CA (°ATDC) P re s s u re ( M P a ) 0 10 20 30 40 50 60 70 80 H R R ( J /° ) P ALFA 17 P ALFA 45 P ALFA 24 HRR ALFA 17 HRR ALFA 45 HRR ALFA 24
Fig. 2.31 Pressure and HRR with different A/F ratios (case: CAM 40 SQUARE INJ)
0 1 2 3 4 5 6 7 8 -5 5 15 25 35 45 55 65 75 85 CA (°ATDC) P re s s u re ( M P a ) 0 10 20 30 40 50 60 70 80 H R R ( J /° )
P CAM 40 ALFA 17 SQUARE INJ P CAM 40 ALFA 17 LINEAR INJ HRR CAM 40 ALFA 17 SQUARE INJ HRR CAM 40 ALFA 17 LINEAR INJ
Fig. 2.32 Pressure and HRR comparison between square and linear injection profiles 0 1 2 3 4 5 6 7 8 -5 5 15 25 35 45 55 65 75 85 CA (°ATDC) P re s s u re ( M P a ) 0 10 20 30 40 50 60 70 80 H R R ( J /° )
P CAM 40 ALFA 24 LINEAR INJ P CAM 46 ALFA 24 LINEAR INJ HRR CAM 40 ALFA 24 LINEAR INJ HRR CAM 46 ALFA 24 LINEAR INJ
Fig. 2.33 Pressure and HRR with the two intake valve lifts considered (case: ALFA 24 LINEAR INJ)
Square Injection Linear Injection
Fig. 2.34 Temperature in a cross-section plane through the valve axis and in the combustion chaber for the two injection profiles considered at 12°ATDC (case: CAM 40 ALFA 24)
CAM 40 CAM 46
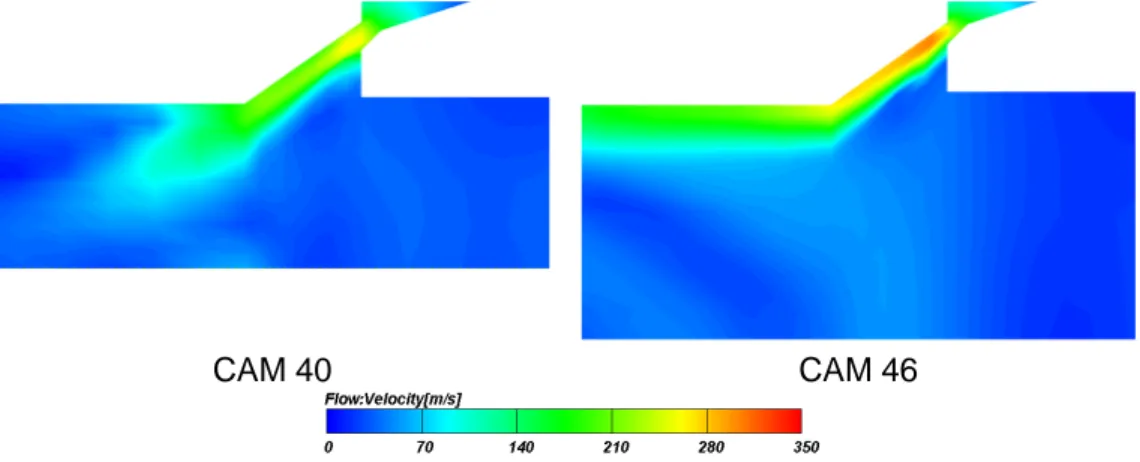
Fig. 2.35 Velocity magnitude at 3° BTVC with the tw o valve lifts considered (case: ALFA 24 LINEAR INJ)
With the wider transfer valve lift profile pressure remains constant for a longer time (Fig. 2.33) and producing more power. However, efficiency is lower in this case compared with the case with CAM 40 because closing the valve with a higher piston velocity leads to higher flow velocities, as shown in Fig. 2.35, and therefore larger pressure losses.
55
2.6.3 EMISSIONS RESULTS
In Figs. 2.36 to 2.38 pollutant emissions results in terms of HC, NOX and
CO are reported for all cases considered in the analysis. soot emissions calculated with FIRE-Chemkin were not available because the soot reactions have not yet been implemented in the Chemkin mechanism with FIRE. Therefore, for the soot prediction two approaches were used: in the first one the ECFM-3Z model was used combined with the Kennedy-Hiroyasu-Magnussen model [15]; in the second one qualitative soot emissions analysis was discussed by means of a Φ-T analysis (see next paragraph).
HC emissions were lower with respect to those produced by HCCI/LTC combustion. Moreover, they can be reduced by using a different injection strategy and with a better design of the transfer duct/valve seat, because most of them come from the wall-film on the transfer valve surfaces.
NOX emissions still needed to be reduced, due to the high combustion
temperature reached during combustion. In all the cases NOX emissions
increased increasing oxygen partial pressure, proportional to the A/F ratio. As regards CO emissions, they increased decreasing A/F ratio. With an A/F ratio of 17 they were one order of magnitude higher than in the cases with A/F ratio greater than 24, indicating that the fuel oxidation was not completely accomplished.
soot emissions predicted with the ECFM-3Z combined with the Kennedy-Hiroyasu-Magnussen model are shown in Fig. 2.39. No noticeable difference was noticed between the two injection profiles. Using A/F ratios lower than 24 soot emissions spiked to be very high values. With A/F = 28 the soot was around 2 g/kg-f and with higher A/F the soot emissions were on the same order of magnitude as the PCCI cases of Opat et al. [17].
0 10 20 30 40 50 60 15 20 25 30 35 40 45 50 Air/Fuel H C [ g /k g f] CAM 40 SQUARE CAM 40 LIN CAM 46 SQUARE CAM 46 LIN