Digital Object Identifier 10.1109/ACCESS.2018.2888916
Not in My Neighborhood: A User Equipment
Perspective of Cellular Planning Under
Restrictive EMF Limits
LUCA CHIARAVIGLIO 1,2, (Senior Member, IEEE), JAIME GALÁN-JIMÉNEZ 3,4, MARCO FIORE 5, (Senior Member, IEEE), AND NICOLA BLEFARI-MELAZZI1,2 1Department of Electronic Engineering, University of Rome Tor Vergata, 00133 Rome, Italy
2Consorzio Nazionale Interuniversitario per le Telecomunicazioni, 43124 Pisa, Italy
3Instituto de Investigación en Tecnologías Informáticas Aplicadas de Extremadura, University of Extremadura, 10003 Cáceres, Spain 4Instituto de Investigación en Tecnologías Informáticas Aplicadas de Extremadura, 10003 Cáceres, Spain
5Institute of Electronics, Computer and Telecommunication Engineering, National Research Council of Italy, 10129 Turin, Italy
Corresponding author: Luca Chiaraviglio ([email protected])
This work was supported by the Horizon 2020 EU Project 5G-EVE under Grant 815074.
ABSTRACT The installation of base station (BS) sites is regulated by a variety of laws at interna-tional, nainterna-tional, and local levels. While international regulations are already severe, the national and local laws applied in many countries and regions follow precautionary principles and enforce electromagnetic field (EMF) constraints that are even more restrictive. This legal environment results in substantial constraints affecting the planning of cellular networks, as requests for new BS site installation are easily denied by national or local authorities. In this paper, we consider the problem of cellular planning under restrictive EMF limits from the user equipment (UE) viewpoint. We focus on outdoor urban areas and first evaluate the impact of the current, non-optimal network planning at the UE side through a quantitative measurement-driven analysis of the quality of service (QoS) observed by users in heterogeneous, large-scale urban scenarios. We then perform a qualitative assessment of the perceived QoS and generated EMF levels at one UE transferring data from/to a BS based on its position with respect to the serving BS. Finally, we run a what-if analysis by comparing the existing planning with the one where new BS sites can be installed, thanks to a relaxation of the restrictive EMF constraints. Our results clearly show that a cellular planning driven by restrictive EMF constraints forces UE to experience large distances from the serving BS, frequent non-line-of-sight conditions, and poor received signal. In turn, this entails a very negative combination of high electric field activity (EFA) levels generated by the UE and low QoS perceived by the user. We show that, by relaxing the restrictive EMF constraints, the problem could be sensibly mitigated with a positive impact on the UE channel conditions and consequently on the perceived QoS and the UE EFA.
INDEX TERMS Cellular network planning, EMF limits, impact on QoS, user equipment measurements. I. INTRODUCTION
Cellular networks have been pervasively deployed in the last two-decades, and a variety of technologies, from 2G to upcoming 5G, have progressively enabled a plethora of innovative mobile services. Across all such network gener-ations, planning has been a critical step in developing radio access infrastructures capable of accommodating the grow-ing abundance of applications and the associated increasgrow-ing traffic demand [1], [2]. During the planning phase, operators select the sites that will host the Base Station (BS) equip-ment, and each BS is then properly configured in terms of, e.g., sectors, installed technologies, operating frequencies,
azimuth, tilting, etc. Solving the planning problem so as to ensure that User Equipment (UE) is served by meeting high Quality of Service (QoS) standards is a challenging task, which requires, among other aspects, a careful evaluation of the ElectroMagnetic Field (EMF) radiated by the BSs [3], [4]. As a matter of fact, the installation of new BS sites is regulated by a variety of laws on EMF levels. Many countries adopt limits that are based on the EMF levels prescribed by the International Commission on Non-Ionizing Radia-tion ProtecRadia-tion (ICNIRP) [5], which specifies maximum EMF values to avoid the detrimental effect of heating for the radiated tissues. However, several countries adopt more
VOLUME 7, 2019
2169-3536 2018 IEEE. Translations and content mining are permitted for academic research only.
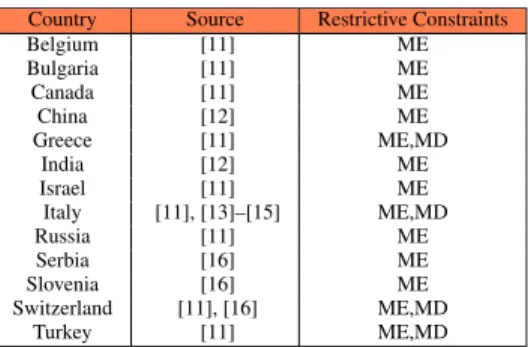
TABLE 1. List of countries adopting EMF constraints that are more restrictive than those prescribed by ICNIRP. ME = maximum EMF levels lower than the ICNIRP limits, MD = restrictions on the minimum distance between a BS and a sensitive place.
restrictive EMF constraints than those dictated by ICNIRP, as summarized in Tab.1. The additional restrictions imposed in such countries include EMF limits much lower than the ICNIRP ones, as well as a minimum distance that has to be ensured between BS sites and sensitive places (e.g., schools, hospitals, public parks). Although the debate on the health implications of EMF levels close to the ICNIRP limits is still ongoing within the research community [6]–[9], there is a growing concern from the population about the risks associated to living in proximity of a BS site. This results in strong Not In My BackYard (NIMBY) positions from the population against the installation of new BS sites [10]. However, the same individuals are constantly using their mobile devices to access social media, browse the Inter-net, store and access content on Clouds, watch streaming videos, or play online games. This sets users in a controversial position of being contrary to the installation of new BS sites, but also demanding increasing QoS to the operator to enjoy mobile applications.
A planning of cellular network driven by restrictive EMF constraints is clearly not optimal for the mobile opera-tor [4], [17]–[19], with increased installation costs, or the impossibility to install BSs in profitable locations like dense urban zones. However, such a non-optimal planning has also an impact on the UE side. Effects in this sense do not only include a reduced QoS perceived by the user, but also increased EMF generated by the UE. Indeed, the latter depends on the mutual position of the UE and serving BS, as well as on the channel conditions, both of which are penalized by sub-optimal cellular network planning.
The goal of this work is to shed light on these aspects, which are often underrated by the general public, and over-looked by the research community. In particular, we aim at answering the following question: Given an urban cellular
planning driven by restrictive EMF constraints, what is its impact in terms of QoS and Electric Field Activity (EFA) gen-erated by the UE?1In order to provide a response, we study
1Measuring the EMF in proximity to the UE is a challenging task, due
to the presence of near field conditions. To face this issue, in this paper we measure the electric field close to the UE. Even though the magnetic field in near field conditions is independent from the electric one, the measured metric is used as a proxy to measure the activity of the UE antenna.
a set of cellular metrics representative of the UE QoS, by exploiting crowdsourced Long Term Evolution (LTE) measurements collected in outdoor locations. These met-rics include the Reference Signal Received Power (RSRP), the number of distinct BSs sensed in each unit of the territory, and the distance of the UE from the serving BS. We then study the impact of cellular planning on these metrics, as well as their mutual correlation. Our analysis is substantiated by measurement data collected from six mobile network opera-tors in three different cities, where different EMF constraints, hence different planning rules, apply. In addition, we evaluate the impact of planning on the EFA generated by the UE, as well as the actual level of QoS perceived by the user. To this aim, we adopt state-of-the-art EMF meters, and we follow a qualitative approach based on active measurements, where the UE EFA and the user QoS are evaluated in one typical setting, i.e., an upload of an email attachment and the sending of the email. Finally, we perform a what-if analysis in order to assess the impact of relaxing the restrictive EMF constraints; specifically, we simulate the installation of new BS sites in a scenario where otherwise it would be not possible to install any BS, and measure the improvement in terms of distance from serving BS and estimated RSRP.
Our results indicate that a cellular planning driven by restrictive EMF constraints affects UE-related metrics in a very negative manner. This includes, e.g., values of RSRP close to the minimum ones, multiple BSs sensed in the same territory unit, UE distance from the serving BS in the order of several hundred meters (and more), and frequent Non-Line Of Sight (NLOS) channel conditions. Importantly, the non-optimal planning leads to very strong UE EFA and to QoS levels that are not satisfactory nonetheless. We pre-cisely study this effect by isolating a cluster of measurements characterized by large UE EFA levels, low QoS, low RSRP, large distance from the serving BS, and NLOS conditions. Finally, our what-if analysis clearly shows that, by relaxing the restrictive EMF limits, and by ensuring the international ones, it would be possible to dramatically improve both the RSRP values and the UE distance from the serving BS, with a positive impact on the perceived QoS and a possible decrease of the EFA generated by the UE.
The rest of the paper is organized as follows. SectionII
overviews the state-of-the art. SectionIIIsheds light on the problem of cellular planning driven by restrictive EMF lim-its. SectionIVanalyzes the impact of cellular planning on different UE metrics that are related to the QoS. The impact of planning on the EFA generated by the UE is unveiled in SectionV, which also reports an analysis of the QoS levels perceived by users. Section VI details the what-if analy-sis. The lessons learned are described SectionVII. Finally, SectionVIII summarizes the conclusions and sketches the future work.
II. STATE-OF-THE-ART
We review the state-of-the-art by separating the two following relevant domains: i) characterization of the mobile network
infrastructure and UE QoS from crowdsourced data; and, ii) measurements of EMF levels in mobile networks.
A. INFRASTRUCTURE AND QoS CHARACTERIZATION FROM CROWDSOURCED TRACES
We initially analyze the works inferring the features of the mobile network infrastructure from crowdsourced traces. We then review the works that exploit crowdsourced data to estimate the UE QoS.
1) MOBILE INFRASTRUCTURE CHARACTERIZATION
Malandrino et al. [20] analyze the mobile data measured with WeFi and OpenSignal tools in different areas of the USA. Their focus is on the LTE technology and on the character-ization of LTE networks. Interestingly, they found that LTE networks are pretty dense, and they are already composed of a variegate set of macro and small cells. In particular, there are cells covering large portions of territory (even in urban zones). As a result, different zones are covered by even dozens of cells. The work is further extended in [21], in which Malandrino et al. analyze the impact of providing 5G services starting from the information collected from the crowdsourced data. Interestingly, they found that, in order to provide 5G connectivity, it is possible to exploit the densifi-cation of the already deployed network. However, they also point out that a substantial increase of capacity is needed to sustain the predicted traffic increase in the forthcoming years. Although the works [20], [21] are surely of interest, the considered network infrastructure is deployed in the USA. Therefore, it is subject to a different set of regulations compared to other countries, which adopt strict constraints (e.g., in terms of EMF levels) when installing new BS sites. In addition, their focus is not on the impact of UE side in terms of QoS and EMF. Nevertheless, the idea of adopting crowd-sourced data to derive information about the infrastructure is effective, and we consider it in our work.
Chiaraviglio et al. [19] assess the impact of current cellular planning (both in terms of deployed networks and in terms of EMF regulations) on the deployment of 5G mobile infras-tructure, showing that: i) currently deployed 2G/3G/4G net-works are already experiencing high EMF saturation levels, thus limiting the installation of new 5G sites; ii) the current infrastructure in terms of BS sites, whose installations are heavily influenced by strict EMF regulations, provides a QoS which is clearly sub-optimal. Chiaraviglio et al. [19] base their findings on a set of scenarios, which are retrieved by simulations and by crowdsourced data. However, their focus is more on the mobile network planning, and not on the UE side like in this work. Moreover, the impact of EMF generated by the UE is not taken into account at all by [19]. On the other hand, in this work we show that the EMF generated by the UE has a large impact, which depends on several factors (e.g., UE position, channel conditions, UE QoS metrics) that are influenced by the planning of the mobile network.
Remark 1: Deriving information about the cellular plan-ning of the mobile network infrastructure from crowdsourced
data is a sensible choice. However, this task needs to be complemented by a thorough analysis of the planning from the UE side, both in terms of QoS and in terms of EMF.
2) QoS CHARACTERIZATION
Several works explore the use of crowdsourced param-eters measured by dedicated mobile apps to charac-terize the UE downlink/uplink throughput [22]–[31]. In particular, the candidate metrics include the Refer-ence Signal Received Power (RSRP) [24], [25], [27]–[30], the Reference Signal Received Quality (RSRQ) [24], [27], [29], [30], implementation-specific signal strength metrics [22], [23], [27], [31], the Received Signal Strength Indication (RSSI) [25], the Signal to Noise and Interference Ratio (SINR) or Signal to Noise Ratio (SNR) [25], the Refer-ence Signal Signal to Noise Ratio (RSSNR) [24], [27], and downlink or uplink data rate measurements obtained with active probes [22], [23], [26], [27], [31]. In the following, we provide more details about the outcomes of [22]–[31] which are relevant to our work.
Sonntag et al. [22] in their seminal work propose NetRadar, a software able to perform UE active measurements and to collect the data. They found that the signal strength has a light correlation with bandwidth. Sonntag et al. [23] analyze the impact of signal strength on service quality, showing that there is a correlation between the signal strength and the TCP goodput. In particular, when the signal strength is bad (i.e., values lower than 60% compared to the maxi-mum ones), the TCP throughput is also notably decreased. However, in both works [22], [23] they also point out that the signal strength alone does not provide enough indica-tions about the network performance, which has to be inves-tigated also by means of active measurements. Moreover, their measurements are mainly obtained from a 3G network. Nikravesh et al. [31] provide detailed insights about the performance of mobile UEs, by analyzing measurements collected with Speedometer and Mobiperf apps. In particular, they claim that the signal strength has a major impact on the performance. For example, when assessing the (maximum) capacity provided by the mobile operator, it is important to perform this test in regions with high signal strength, which otherwise would limit this value. Cainey et al. [24] focus on the modeling of downlink throughput in LTE networks. The authors observe, that, at a first glance, the RSRP can be a good candidate as signal strength indicator, as it is used for cell selection and hand-overing operations. However, they point out that the RSRP can be affected by multi-path fading, resulting in high throughput even for low RSRP values (as shown in [24, Fig. 1]). Finally, they conclude that a function considering RSRP, RSRQ and RSSNR would be more appropriate to predict the throughput, although no exact formula is provided.
Akselrod et al. [25] evaluate the main factors impacting the UE download rate in LTE networks, observing that the signal quality, which depends on the UE position, has the highest impact. However, this metric is also affected by the frequency
band and the bandwidth adopted by the operator. Moreover, although it is possible to observe a high correlation between the measured values of RSRP/RSSI/SNR and throughput, no exact relationship can be determined. However, the prob-ability to achieve a large throughput is proportional to the signal quality. Walelgne et al. [26] analyze key features of mobile network related to the throughput, pointing out that this metric depends on a large variety of factors, such as the adopted radio technology, the physical layer effects, the UE demand and mobility, as well as the mobile infrastructure in use. Apajalahti et al. [27] study the correlation of different metrics obtained from crowdsourced mobile data, including: uplink throughput, downlink throughput, RSRP, and RSRQ. The metrics are extracted from the NetRadar and the RTR Nettest platforms. Interestingly, both the Pearson’s correla-tions and the Spearman’s correlacorrela-tions reveal that there is a not negligible correlation between the RSRP and the uplink throughput (see [27, Figs. 3–6]). Enami et al. [28] build a tool, called RAIK, which is able to predict Key Performance Indicators (KPIs) such the RSRP and the path loss by apply-ing an approach based on neural networks. Their tool takes into account crowdsourced measurements and geographi-cal data (e.g, elevation and buildings). In particular, RAIK exploits the available measurements to infer the metrics in areas where measurements have not been performed. The measurements used as input to RAIK clearly show that, as the distance between the transmitter and the receiver is increased, the RSRP tends to be notably reduced (see [28, Fig. 5]). However, the size of the considered area has an impact on the variability on the measurements. In any case, the considered KPIs can be predicted with very low errors in areas where the measurements are not available.
Eventually, Raida et al. [29] provide interesting insights about the computation of RSRP and RSRQ metrics in LTE-enabled UEs. More in depth, they point out that the RSRQ is connected to the interference experienced by the UE. In particular, this metric can be useful for the estimation of the cell load determined by other users. However, they point out that this information can be correctly retrieved only if it is measured at zero downlink throughput of the UE. On the other hand, the RSRP is proportional to the SINR only when the total noise plus interference power is negligible. To this aim, [29, Fig. 5] clearly shows that the maximum achievable downlink throughput is notably decreased as the RSRP approaches the lowest values (i.e., ≤ −110 [dBm]). However, when the UE moves from the cell center to the cell edge, the RSRP is decreased (due to higher path losses), and the total noise plus interference power is increased (due to interference of the neighboring cells). As a result, the RSRP can not be used alone to predict the SINR (and consequently the throughput) when the UE is located at the cell edge. Ide et al. [30] provide an empirical analysis of the impact of LTE downlink channel indicators (mainly RSRP and RSRQ) on the UE uplink performance. In particular, they point out that the RSRP is useful to identify very good uplink condi-tions (i.e., when the user is close to its serving cell). On the
other hand, the RSRQ is effective in detecting the interference level (especially close to the cell edge). They support their claim with a comprehensive measurement campaign, which integrates passive and active measurements. More in depth, they found that the time to transmit a file is related to the measured values of RSRP and RSRQ: [30, Fig. 6] clearly shows that, as the UE moves from the cell center to the cell edge, the RSRP is decreased, while the transmission time tends to increase. However, a strong variability in the transmission time is experienced at the cell edge. As a result, they conclude that both the RSRP and RSRQ metrics are correlated to the average system performance. In any case, the authors recognize that an exact mapping between each metric and the actual performance is not possible.
In general, the metrics measured by the apps on the smartphones are in line with the ones that are measured by exploiting dedicated equipment [32], [33]. To this aim, Lauridsen et al. [32] show that the RSRP measurements performed by NetMap app are reliable. Enami et al. [33] analyze the impact of adopting smartphones as measurement devices to compute the parameters needed by radio propaga-tion models. In particular, the reported signal quality (both at the app and firmware levels) appears to be very close to the one measured by means of a dedicated channel scanner. As a result, they conclude that the radio propagation mod-els obtained from crowdsourced measurements are similar with the models obtained from measurements with advanced equipment.
Summarizing, [22]–[33] tackle the problem of assessing the QoS provided to mobile users by exploiting crowdsourced information derived from mobile Apps. However, none of these works correlates the measurements with the cellular planning. Moreover, they do not investigate the impact in terms of EMF generated by the UE. Both the two aspects are instead targeted by this work.
Remark 2: General indications about the offered QoS can be derived by analyzing crowdsourced measurement data, for both uplink and downlink directions. The RSRP metric seems to be a good proxy for (coarse) QoS levels; however, it alone does not provide an exact picture of the actual network-level performance. This is especially true at the cell edge, where the interference with the neighboring cells is dominant. Therefore, it is mandatory to: i) integrate the RSRP with other metrics (derived, e.g., from knowledge of the deployed mobile infrastructure) that are jointly able to fully character-ize the QoS; and, ii) evaluate the actual level of performance with active measurements.
B. EMF MEASUREMENTS IN MOBILE NETWORKS
We classify the related work about EMF measurements in mobile networks into: i) measurements of EMF generated by BSs; and, ii) measurements of EMF in proximity to users.
1) EMF FROM BASE STATIONS
A first set of works is tailored to the evaluation of the EMF generated by the BSs, considering 2G, 3G and/or
4G technologies [34]–[46]. To this aim, Troisi et al. [34] detail the results of a nation-wide measurement campaign conducted in Italy between 2002 and 2006, concluding that, in most of the territory, the measured EMF is well below the 6 [V/m] set by the Italian law. Their outcome, although very interesting, refers to mobile networks not including 4G tech-nologies that are nowadays pervasively and densely deployed. Manassas et al. [35] perform an EMF monitoring campaign in Greece, concluding that the EMF in urban zones is higher compared to rural ones. Also in this case, however, the LTE technology is not considered. Breckenkamp et al. [36] study the residential characteristics and the EMF exposure from measurements taken in bedrooms located in Germany, con-cluding that the exposure levels are in general very low compared to the ICNIRP limits. A similar outcome is derived by Wu et al. [37], which evaluate the EMF in proximity to a vast set of GSM BSs, and find measured EMF values to be typically orders of magnitude below the ICNIRP limits. Similar findings are obtained by Koprivica et al. [38], who consider GSM/UMTS BSs, and Lunca et al. [39], who also include measurements from LTE BSs.
Joseph et al. [40] perform a vast set of measurements in outdoor/indoor environments located in Belgium, The Netherlands, and Sweden, by adopting a methodology based on narrowband spectrum analyzer. The highest exposure is observed in urban areas, with an average EMF of 0.74 [V/m]. Moreover, the EMF contribution from LTE is much lower than the one from GSM. The previous finding is confirmed by Joseph et al. [41], which measure low values of EMF generated by LTE. Vermeeren et al. [42] performs EMF mea-surements in indoor micro environments located in Greece and in Belgium, concluding that the EMF of mobile networks and radio broadcast are most present. Additionally, they point out the exposure due to digital cordless phones, and notice that exposure levels are higher during the day compared to the night, due to the increased voice and data traffic over the networks. Although the outcomes of this work are interesting, the LTE technology is not considered by [42].
Beekhuizen et al. [43] include the localization of BSs in their analysis. However, the information about the serving BS for each UE is not included. Urbinello et al. [44] compare the BSs radiation in different types of areas located in Basel and Amsterdam, concluding that there is a strong spatial variation in the measurements. Moreover, the recorded EMF levels are always pretty low, i.e., at most equal to 0.53 [V/m]. In a further study, Urbinello et al. [45] observed that the mean exposure levels were 0.41 [V/m] in Brussels, 0.31 [V/m] in Ghent and 0.26 [V/m] in Basel, with an increase over time of the emissions generated by BSs. Martens et al. [46] evaluate the residential exposure from mobile GSM/UMTS BSs, by comparing model estimation with personal mea-surements. They conclude that the contribution from mobile BSs to the total exposure is substantial for subjects with a high exposure. In any case, the impact of EMF generated by the UE is not taken into account by all these previous works.
Summarizing, works [34]–[46] shed light on the amount of EMF generated by BSs. In this work we make three important steps forward by: i) focusing on EFA generated by the UE (although we consider BS EMF as well), ii) evaluating the impact on UE QoS, and iii) investigating the relationship between these two aspects and the cellular planning.
Remark 3: The EMF generated by BSs is in general fairly low compared to other EMF sources, although both temporal variations (e.g., different times of the day) and spatial diver-sity (e.g., different locations in the same country, or across countries) have been observed. Still, BSs remain a major concern for the general public and regulators, and it is thus mandatory to include the EMF generated by BSs in measure-ment campaigns.
2) EMF IN PROXIMITY TO USERS
A second set of works [47]–[57] investigate the EMF in proximity to users, which is generated by a variety of sources, including the UE. To this aim, different works [48]–[50], [52]–[57] exploit the use of personal exposimeters, which are carried by users located in outdoor/indoor environments. Although the exploitation of these devices allows obtain-ing large collection of data, for instance by analyzobtain-ing the behavior of set of people over several hours or days, their accuracy is still an open issue. For example, as noted by Joseph et al. [50], the exploitation of exposimeters may not reflect the exposure in proximity to body sources, as the distance between the UE and the exposimeter strongly affects the measurements, especially when the source of EMF is the UE. Moreover, as pointed out by Gajšek et al. [55] and Juhász et al. [52], an uncertainty analysis is crucial when adopting these types of devices, and should tackle issues such as body shielding, calibration uncertainties, or mea-surements errors and artifacts, which may lead to an under-estimation or an overunder-estimation of the actual EMF values. Unlike previous studies, in this work we exploit a professional EMF meter equipped with a probe oriented towards the EMF source, and we place the meter in close proximity to the UE during measurements. In this way, we get a precise recording of the EMF levels, although the approach is time-consuming and limits the number of feasible measurements. Neverthe-less, we believe that the results of our qualitative analysis are novel and insightful, as they unveil the actual relation-ship between the measurement data (in terms of metrics and locations) and the BS planning in specific case studies.
We then provide more details about the works [47]–[57] and their outcomes. According to the survey of Dürrenberger et al. [47] there is evidence that the exposure due to devices used in close proximity to users is clearly higher compared to the exposure from far-field sources (e.g., mobile networks). To this aim, Viel et al. [48] measure the EMF of a set of people living in France, finding that the largest exposure is due to FM sources. However, two comments hold in their case: i) the considered sampling period is very long, at 13 [s], and ii) the LTE technology is not considered. In any case, the contribution from UMTS
sources to the total EMF is not negligible. Frei et al. [49] investigate the EMF levels for a set of volunteers living in a Swiss city. They found that the EMF generated by the UE is reduced when the UE is in proximity to the BS. However, they do not relate this finding with the specific planning of the cellular network. Moreover, the QoS provided to users is not investigated. Finally, they considered GSM technologies (and not LTE).
Joseph et al. [50] compare the EMF exposure levels mea-sured in different countries in Europe, concluding that the highest EMF contributions are generated by the UEs, rather than the BSs. For example, the UE EMF due to phone calls in Netherlands dominates in almost all environment except outdoor urban. In addition, the EMF generated by the BSs represents an important contribution in outdoor urban envi-ronment. Although the outcome of [50] is surely of interest, it is not tailored to LTE, and it has been retrieved different years ago, when the traffic patterns generated by users were pretty different from current ones.
Gati et al. [51] collect the power transmitted/received from/to a wide set of UEs connected to the Orange network, focusing on GSM and UMTS technologies. Based on this information, they quantify the exposure due to UEs. They derive two interesting findings: i) when the UE received power is weak (due to e.g., high path losses, shadowing, fading) the UE transmitted power is high (and vice-versa); ii) when the UE received power is increased (e.g., due to proximity to a BS or good channel conditions), the average exposure ratio (defined as the evaluated Specific Absorption Rate (SAR) divided by the corresponding limit) is decreased (see, e.g., [51, Fig. 6], which shows the results for the UMTS case). Therefore, their findings suggest that there is a direct relationship between the quality of received signal and the UE EMF. However, the impact of the BS planning (e.g., the specific BS serving the UE) on the obtained results is not unveiled. Eventually, an interesting step towards this direction is included in the work of Plets et al. [58], which is focused on UMTS. In particular, [58, Fig. 2] clear shows that: i) the UE uplink power is decreased when the UE is connected to a (close) femto BS rather than to a (far) macro BS, ii) the uplink power is increased when the UE-femto BS distance is increased, iii) the transition between LOS and NLOS of the UE-femto BS radio link results in a prompt increase of the uplink power. However, the LTE technology is not considered by [51] and [58].
Bolte and Eikelboom [53] found that the largest contri-bution to EMF derives from mobile phones during calls rather than other sources, e.g., cordless phones and BSs. Moreover, the considered radio technologies are GSM and UMTS (not LTE). Urbinello and Röösli [54] found that, even when in stand-by modes, the UEs generate non-negligible EMF levels, due to the fact that a certain amount of control traffic needs to be always exchanged between the UE and the mobile network (e.g., for location update purposes). This is especially true in urban areas and when the mobility of the UE is increased (e.g., by travelling with public transportation).
However, the impact of the cellular planning and the LTE technology are not considered. In addition, Roser et al. [57] evaluate the exposure levels of Swiss adolescents carrying personal exposimeters, showing that more than 67% of expo-sures are due to the UEs. Gajšek et al. [55] demonstrate that the largest public exposure comes from the UE (used with mobile/wireless networks), thus confirming the findings of [53] and [57]. Eventually, Ibrani et al. [56] find that the uplink contribution to the EMF is lower than the downlink one. However, their analysis is not tailored on LTE. In addi-tion, the adoption of exposimeters, coupled with a relatively long time interval of 5 [s], may have biased the measure-ments. Finally, the recent work of Chiaramello et al. [59] clearly shows that the position of the UE has a clear influence in the induced SAR of a fetus.
Overall, previous works [47]–[57] have focused on the measurement of EMF in proximity to users, and in many cases they are not tailored to LTE. In contrast to them, in this work we target the EFA that is generated by an LTE UE. Moreover, we correlate the measurements with the cellular planning as well as with the experienced QoS.
Remark 4: Measuring the EMF in proximity to users is a complex and challenging task, due to the to specific meter adopted, the possibility to repeat the measurements, and near field conditions that may emerge (with electric and magnetic field not orthogonal). In general, EMF meters allow obtaining more precise measurements compared to exposimeters, but the number of measurements that can be performed with these devices is limited. Therefore, it is of mandatory importance to wisely choose the locations where to perform the measure-ments, as well as the methodology to follow when performing the measurement campaign. In any case, however, only a (coarse) indication about the UE EFA can be derived when an EMF meter is used in close proximity to the UE. In order to get reliable information about the impact of UE EMF on the user in near field conditions, a SAR-based analysis should be performed.
III. RESTRICTIVE EMF CONSTRAINTS AND CELLULAR NETWORK PLANNING: FRIENDS OR FOES?
Different countries in the world adopt the limits defined by international commissions, like the ICNIRP [5]. These limits are set in order to prevent health effects, and in particular the heating of tissues, which are especially dangerous to the human body. Although the impact of EMF generated by BSs on public wellbeing is still a controversial topic [6], [8], [9], [60], the adoption of ICNIRP limits is regarded as a best practice by a number of national and international organizations, like the United Nations. However, as we have already mentioned in SectionI, there are countries adopting limits that are more stringent than the ICNIRP ones, based on a precautionary principle. In Italy, for example, two types of limits exist, namely: i) general limits, which are applied to places like offices and/or commercial centers, where the people do not spend most of their time, and ii) restrictive lim-its, which are instead applied to residential areas. Both limits
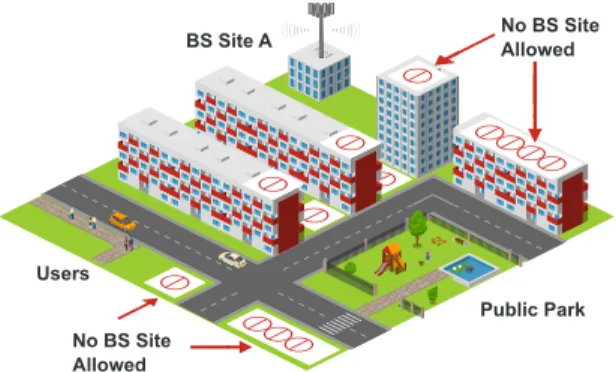
FIGURE 1. Cellular planning with restrictive EMF constraints: the installation of BS sites is not allowed in proximity to the public park. Users in bottom-left part of the figure are served by BS site A, with high EFA generated by UEs and scarce QoS (Icons source: Icograms, licensed under CC BY-NC 4.0).
are much lower than the ICNIRP ones (see [19, Fig. 1] for a visual comparison), with over 10-fold reductions in the worst cases. In addition to this aspect, local municipalities may enforce restrictions on the installation of BS sites, based on a minimum distance that have to be enforced from sensitive places such as schools, hospitals, or public parks. The city of Rome (Italy), for example, imposes a minimum distance of 100 [m] between a BS site and a sensitive place (see [13], in Italian). The definition of ‘‘sensitive place’’ is left open to interpretation, which is evaluated on a case-by-case basis, in accordance to the request presented by the operator and the citizens living in proximity of the planned site.
Given this picture, the planning of cellular networks is heavily impacted by restrictive EMF constraints. From an operator point of view, the non-optimal planning results in a variety of negative effects [12], [19], such as: a general increase of installation costs, radiated power from BSs lower than the optimal one, and the presence of EMF saturation zones. These problems jointly risk preventing a proper sup-port for advanced mobile services, like those expected to be enabled by forthcoming 5G networks. However, the non-optimal planning is also detrimental from the UE side. In order to shed light on this issue, Fig. 1 reports a repre-sentative example based on an urban scenario. In particular, the installation of new BS sites is not allowed in many zones in proximity to a public park. As a result, different UEs (e.g., the ones of the users in the bottom-left part of the figure) are served by a BS (BS site A in the figure), which is far and in NLOS with respect to them, as it is covered by different buildings. The QoS experienced by these users will be low, as long UE-to-BS distance and NLOS entail bad experienced channel conditions. In addition, the UEs will generate non-negligible EFA, in order to transfer data from/to BS site A. On the other hand, Fig.2reports the same scenario, by assuming international-based limits. In this case, a new BS site (BS site B in the figure) can be installed in proximity to the public park. As a result, the UEs in the bottom-left part will be served by BS site B, which is at short distance and in LOS condition. This is beneficial to the user, in terms of
FIGURE 2. Cellular planning with international-based EMF limits: new BS site B can be installed in proximity of the public park. Users in
bottom-left part of the figure are served by BS site B, generating low EFA from UEs and achieving good QoS (Icons source: Icograms, licensed under CC BY-NC 4.0).
experienced QoS as well as of UE-generated EFA, which will be lower compared to the previous case of Fig.1.
Remark 5: Restrictive EMF constraints impose that oper-ators install BS sites following a non-optimal planning. Although the effects triggered by the non-optimal planning are rather intuitive, their quantification in terms of QoS and EFA generated by the UE is a challenging open problem, and it represents the key contribution of our work.
IV. QUANTITATIVE ANALYSIS OF QoS METRICS AT UE As a first step in our study, we investigate the impact of cellular planning on different metrics related to the user QoS and measured from the UE side. The metrics are the RSRP, the number of distinct BSs in each unit of the territory, and the UE distance from the serving BS. We describe the method-ology and the scenarios in SectionIV-Aand SectionIV-B, respectively. We then: i) characterize the RSRP measure-ments in SectionIV-C, ii) discuss the level of BSs coverage overlap in SectionIV-D, iii) correlate the RSRP values and the number of BSs within range in SectionIV-E, and iv) analyze the relationships between the RSRP values and the distance from the serving BS in SectionIV-F.
A. METHODOLOGY
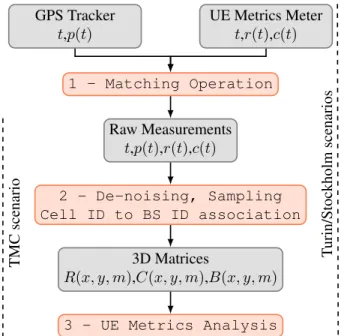
Fig.3reports a high-level scheme of the pursued methodol-ogy to perform the QoS evaluation. We consider the following steps: i) matching operation, ii) de-noising, sampling, cell ID to BS ID association, and iii) QoS analysis. Next, we describe each step in detail, also outlining the input from the previous step, and the output passed to the following one.
Step 1 is the matching operation. This task requires as input the UE positions p(t) for each time instant t, which are measured by a GPS tracker module. In addition, the RSRP
r(t) as well as the cell ID c(t),2recorded by the UE metrics meter, are also required as input. As the amount of measure-ments is typically very large (i.e., in the order of millions) we have exploited the big-data library Pandas [62] in order to efficiently perform the matching operation. More in detail,
FIGURE 3. Main steps to perform the QoS-related UE metrics evaluation.
the matching is done based on the values of t measured by both modules, by searching the exact matching in terms of t among the data measured by the GPS and the ones recorded by the UE metrics meter. In case of multiple UE metrics matching the same time t recorded by the GPS, the first entry in lexicographical order appearing in the matched measure-ments is kept.3 The outcome of Step 1 is a tuple of raw measurements, namely (t, p(t), r(t), c(t)).
In the second step, we perform the following operations: i) de-noising, ii) sampling, and iii) cell ID to BS ID associa-tion.4In particular, during the de-noising step, the measure-ments with values outside admissible ranges are discarded. This includes e.g., RSRP/cell ID zero values, or RSRP outside the working range (i.e., typically between −50 [dBm] and −140 [dBm]). Then, during the sampling phase, the measure-ments are mapped into a pixel map, in which each pixel unit is a small square of 30 × 30 [m2] of territory. More in depth, for each measurement, we extract the position p(t), and we com-pute the pixel (x, y) including the position p(t), where x is the row index and y is the column index. We then store the RSRP and the cell ID in the 3D matrices R(x, y, m) and C(x, y, m), where m is a measurement index which is unique for each measurement in the pixel (x, y) The reason for performing this phase is threefold: i) as the density of the measurements may be not uniform, the sampling operation allows to work with an uniform grid of pixels; ii) we are able to extract information about the metrics over the territory, e.g., by computing the number of cell IDs that can be measured in a pixel; iii) we treat in the same way all the measurements in the same pixel taken
3We have verified that this event is very rare for the considered traces. 4The BS ID (also known as eNodeB ID [63]) is a unique identifier of a
BS, which may include multiple sectors, each of them denoted by a unique cell ID [61].
at different time instants t. The rationale for setting pixels to 30 × 30 [m2] is that this is the smallest size (hence, highest granularity) that yields a sufficient number of measurements per pixel for the analysis to be statistically valid. Also, such a resolution is high enough for an investigation focused on outdoor environments at neighborhood (or larger) scale, such ours.5Finally, the last phase of Step 2 is the association of each cell ID to a BS ID. As this information is in general not available in the considered traces, we have implemented a crawler in order to get it from the database stored by the CellMapper app [61]. In particular, we perform the following tasks for each cell ID: i) query of the CellMapper eNB calculator web page [64] with the current cell ID; ii) getting the plain-text CellMapper response page, iii) extraction of the BS ID from ii). At the end of this phase, the BS ID is saved for each measurement in the 3D matrix B(x, y, m), where (x, y) is the pixel of the measurement and m is the measurement index.
Given the 3D-matrices R(x, y, m), C(x, y, m), B(x, y, m), the last step of Fig. 3 is the analysis of the 3D-matrices reporting the QoS-related UE metrics, which is reported in detail in SectionsIV-CthroughIV-F.
B. SCENARIOS
We consider three scenarios located in Rome (Italy), Turin (Italy) and Stockholm (Sweden). More in detail, the scenario in Rome maps to the TorrinoMezzocammino (TMC) district, which is a relatively recent neighborhood including more than 10,000 inhabitants. On the other hand, the scenarios in Turin and in Stockholm include the whole city, with around one mil-lion inhabitants each. For the three scenarios, we consider a set of operators providing LTE connectivity, namely: i) TIM, Vodafone and Wind Tre for TMC and Turin, and ii) 3, Telenor and Telia for Stockholm.
Tab.2summarizes the main EMF regulations that are in force in the three scenarios. Both TMC and Turin are subject to nation-wide general limits, which are stricter than the ICNIRP ones. In addition, the EMF limits for specific zones in Italy (e.g., in proximity to residential areas) are even more restrictive, with a maximum EMF field level equal to 6 [V/m] for all the frequencies. Focusing then on local regulations, TMC adopts the minimum distance rule enforced by the Rome municipality [13], which prevents the installation of BS sites at a distance lower than 100 [m] from a sensitive place (as already mentioned in Section III). On the other hand, the city of Turin adopts a regional law [14] enforcing a similar constraint on the minimum distance, which is however lower than in Rome, and for which exceptions can be made. Moreover, limitations on the installation of BS sites may include buildings in the historical center, as well as areas subject to landscape constraints and protected zones. Finally, the EMF limits in Stockholm adhere to the ICNIRP ones, without additional restrictions for specific zones.
5Indoor measurements may require smaller pixel sizes. We leave the
TABLE 2. EMF regulations for the cellular planning across the different scenarios.
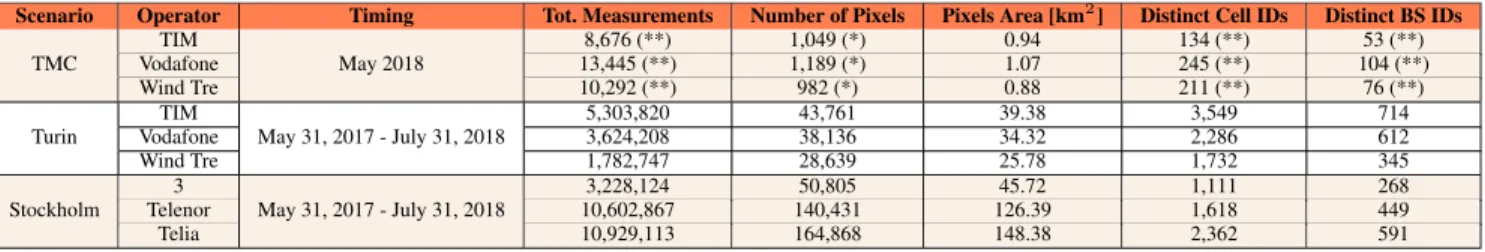
TABLE 3. Measurements features across the different scenarios/operators.
TABLE 4. Traces information across the different scenarios/operators. (*) = inside TMC boundaries, (**) = including TMC neighborhoods.
We then perform the evaluation of the QoS-related UE metrics reported in Fig.3for each operator in each scenario. To this aim, Tab.3reports the features of the measurements. More in depth, for the TMC scenario we exploit the CellMap-per application as GPS tracker and as UE metrics meter. The mapping operation is automatically performed by this application, which directly provides the raw measurements
t, p(t), r(t), c(t) as CSV files. In order to get the
measure-ments, we exploit a set of smartphones, including: Samsung S6 Edge, OnePlus 3, and Huawei Honor 7. Whenever possi-ble, we exploit multiple smartphones to get the measurements from each operator.
As far as the Turin and Stockholm scenarios are concerned, the data were collected via the MONROE open platform for mobile broadband measurements [65]. MONROE is a transnational initiative funded by the European Union, which deployed 450 monitoring nodes across several European countries. Each MONROE node integrates two PC Engines APU2 board programmable computers, and is multi-homed to up to three mobile network operators (MNOs) via 3G/4G MC7455 miniPCI express network interface cards (NICs) using LTE CAT6. The nodes run a Debian GNU/Linux
‘‘stretch’’ distribution, and execute a number of experi-ments inside isolated virtualized environexperi-ments implemented as Docker containers. The types of measurements that the MONROE platform can accommodate are many and varied, and span network coverage detection, continuous active con-nectivity monitoring, speedtests, and passive traffic analysis. This is achieved by collecting metadata from the NICs as well as from other sensors onboard each node. In this work, we are interested in geo-referenced physical-layer network param-eters, therefore we use the MONROE platform to gather metadata about the node GPS location and the UE metrics. We gather such measurements from 81 MONROE nodes aboard public buses in Turin and Stockholm. Interestingly, considering such a large number of mobile nodes with varied routes lets us investigate the geographical heterogeneity of QoS metrics at scale in the two cities.
Tab. 4 summarizes the measurement data information across the different scenarios and operators. The table reports on the following items: the timing; the total number of measurements after the de-noising phase of Fig.3; the total number of pixels in each 3D-matrix (including only pixels with at least one measurement); the total area covered by
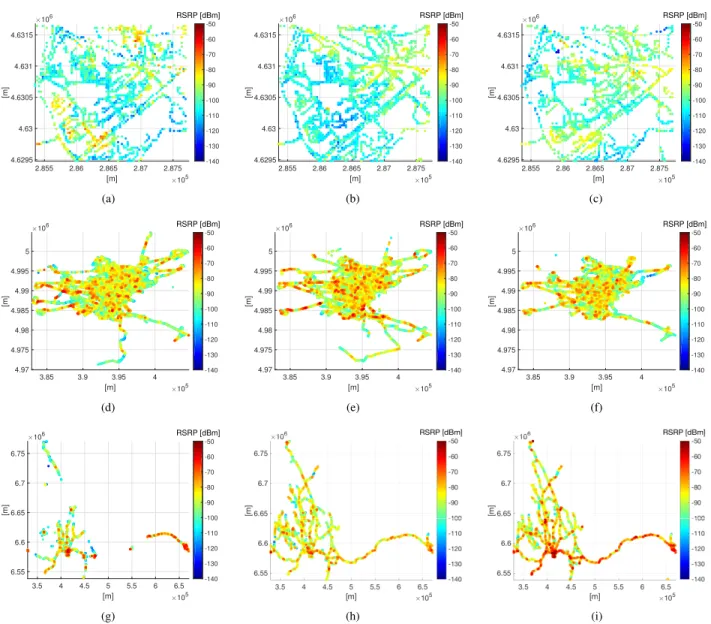
FIGURE 4. Average RSRP measured over the territory across the different scenarios and operators (Figures best viewed in colors).
(a) TMC - TIM [19]. (b) TMC - Vodafone [19]. (c) TMC - Wind Tre [19]. (d) Turin - TIM. (e) Turin - Vodafone. (f) Turin - Wind Tre. (g) Stockholm - 3. (h) Stockholm - Telenor. (i) Stockholm - Telia.
the pixels; the total number of distinct cell IDs, which is obtained by counting all the cell IDs without duplicates; the total number of distinct BS IDs obtained after the cell ID to BS ID association of Fig.3(again without duplicates).
C. RSRP CHARACTERIZATION
We initially provide a high level overview of the spatial vari-ations of RSRP across the different scenarios and operators, as shown by the subfigures in Fig. 4. Each subfigure shows the average RSRP of all measurements in the pixel area, i.e., P
mR(x, y, m)/M(x, y), where M(x, y) is the number of measurement collected at pixel (x, y). The color of each pixel maps to the RSRP, as per the colorbar on the right of each subfigure. Interestingly, the RSRP varies substantially across the scenarios and across the operators, with pixels in which the measured RSRP is pretty high (i.e., ≥80 [dBm]) and other ones instead in which the RSRP is very low
(i.e., ≤−110 [dBm]). We point out that the RSRP spatial vari-ation has been also observed by previous works in other sce-narios (see [24], [25], [29], [30]), and our analysis confirms this behavior. By observing each scenario in detail, we remark that TIM and Wind Tre seem to provide higher values of RSRP compared to Vodafone in the TMC district (which is inline with the QoS evaluation outcome of [19]). In the Stockholm scenario, Telia is able to provide vast regions of territory with values of RSRP consistently higher than 3 and Telenor. Finally, in Turin, all operators provide similar RSRP levels.
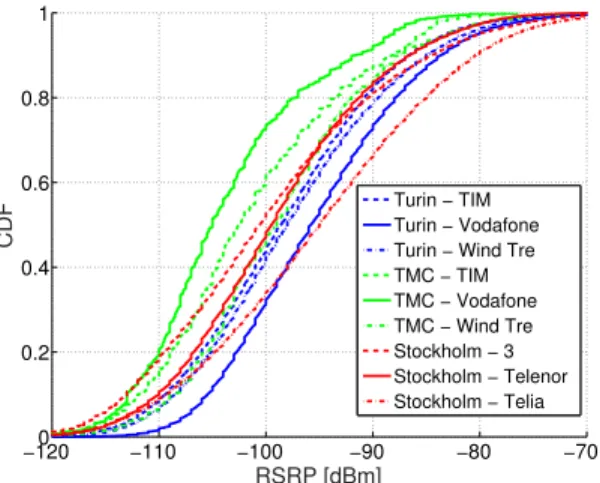
A statistical view of RSRP values is in Fig. 5, which depicts the Cumulative Distribution Function (CDF) of the RSRP computed in all pixels, for each scenario separately. As expected, there are huge differences across cities and oper-ators. The CDFs of TIM and Vodafone in the TMC scenarios are clearly shifted to the left compared to the other ones,
FIGURE 5. CDFs of the RSRP across the different countries and operators (figure best viewed in colors).
which results in worse RSRP. Moreover, the tail of the CDFs reveal that more than 20% of pixels are experiencing very low RSRP values (i.e., ≤ 110 [dBM]) for the Vodafone operator in the TMC scenario. On the other hand, the Wind Tre operator in the TMC scenario presents a CDF pretty similar to the ones of the other operators in Turin (except from Vodafone) and in Stockholm (except from Telia). This is mainly due to the fact that the Wind Tre operator is the result of a recent merging of two previously independent operators, i.e., Wind and H3G/Tre: thus, its radio access infrastructure is the com-bination of BS sites owned by both.6Wind Tre has exploited this competitive gain in order to provide a better coverage of the considered TMC scenario. Finally, by observing in more detail the right part of Fig.5, we can note that the best CDFs are achieved by Vodafone in Turin and by Telia in Stockholm. In particular, the CDF of Vodafone in Turin experiences the lowest slope, meaning that this operator provides the least variability in terms of RSRP values. For example, the values of RSRP lower than 110 [dBm] represents less than 2% of the total range. On the other hand, very good values of RSRP, i.e., higher than −80 [dBm], represents less than 5% of the total range. Finally, Telia presents a higher slope than Vodafone in Turin, meaning that, although the average RSRP of the former is pretty similar compared to the latter, its variability is also larger.
Remark 6: The analysis on the RSRP values reveals that there is a strong variability in terms of RSRP across the different operators in the same scenario, and also across mul-tiple scenarios located in different countries. We expect that this variability is translated into a variegate QoS experienced by users. However, as also pointed out by previous work, the RSRP information needs to be enriched by other metrics in order to derive reliable indications about the offered QoS.
6The resulting combination is not a complete fusion of Wind and H3G/Tre
infrastructure, as different BS sites previously owned by Wind and H3G/Tre have been dismissed and acquired by the ILIAD operator, which recently entered in the Italian market.
D. COVERAGE OVERLAP CHARACTERIZATION
We now consider the distinct number of cell IDs for each pixel in each scenario and in each operator. Fig. 6 reports the obtained pixel maps. Each pixel is colored in accordance to the values reported in the colorbar placed on the right of each subfigure, which collapses in a single color all the pixels having a number of cell IDs ≥ 8 (to improve the figure readability). Several considerations hold in this case. First, most of the pixels are served by one and/or two distinct cell IDs in the TMC scenario. Second, there are pixels in which the number of cell IDs is clearly higher. In the TMC scenario (Fig. 6(a)–6(c)), these pixels are located mainly on a hill, which is covered by multiple (far) cells. This is especially true for the TIM operator in Fig. 6(a). Focusing on the other operators of TMC, Vodafone (Fig. 6(b)) presents also a zone in the southern part of the district with a large number of cell IDs. This zone is also far from all the serving BSs. Finally, the pixels of the Wind Tre operator (Fig. 6(a)) presents at most three distinct cell IDs in many parts of the territory.
Focusing now on the Turin scenario (Fig. 6(d)–6(f)), dif-ferent portions of the territory are covered by ≥8 cell IDs. At a first glance, the number of distinct cell IDs appears to be in general higher compared to the TMC scenario. However, there are differences among the operators. For example, Tim (Fig. 6(d)) exploits more frequently a larger number of distinct cell IDs compared Vodafone (Fig. 6(e)) and Wind Tre (Fig. 6(f)).
We now move our attention to the Stockholm scenario (Fig. 6(g)–6(i)). In this case, the zones with ≥8 distinct cell IDs are mostly located in the city center, while different areas - far from the city center - are covered by less cell IDs. Summarizing, the number of distinct cell IDs notably varies across the scenarios, likely due to the different policies followed by the operators in order to install the BS sites.
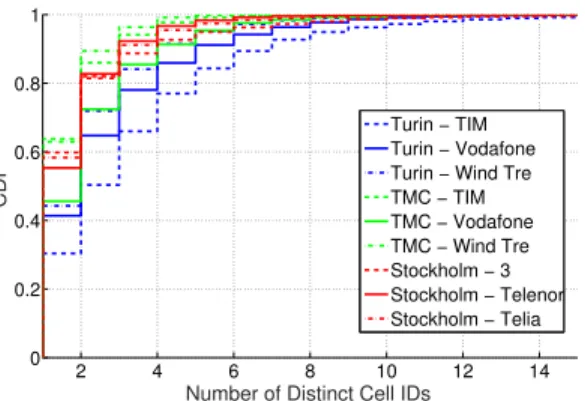
In order to provide a comparison across the different sce-narios and operators, Fig.7reports the CDFs of the number of distinct cell IDs. In the Stockholm scenario, the number of distinct cell IDs is equal to one for more than 50% of pixels across all the operators. Focusing on the TMC scenario, we can note that both TIM and Wind Tre presents a similar trend compared to the Stockholm one. On the other hand, Vodafone in the TMC scenario exploits a larger number of distinct cell IDs. However, more than 70% of the pixels are served by up most two distinct cell IDs. Eventually, focusing on the Turin scenarios, all the operators exploit a larger number of distinct cell IDs compared to the other scenarios. For example, 60% of pixels are covered by up to 4 distinct cell IDs in Turin for the TIM operator. These outcomes confirm and enforce our previous findings retrieved by analyzing Fig. 6(a)–6(i).
Up to this point, an interesting question is whether the num-ber of distinct cell ID impacts the RSRP values. Intuitively, if a pixel is covered by a large number of cell IDs, it may be located in a zone with overlapping coverage, and therefore potentially better RSRP compared to a zone served by a single
FIGURE 6. Number of distinct cell IDs across the different scenarios and operators (Figures best viewed in colors). (a) TMC - TIM. (b) TMC - Vodafone. (c) TMC - Wind Tre. (d) Turin - TIM. (e) Turin - Vodafone. (f) Turin - Wind Tre. (g) Stockholm - 3. (h) Stockholm - Telenor. (i) Stockholm - Telia.
FIGURE 7. CDFs of the number of distinct cell IDs across the different countries and operators (Figure best viewed in colors).
cell ID. However, different evidences from our results do not support this statement. For example, Telia in Stockholm has the best CDF in terms of RSRP (Fig. 5), despite the relatively low overlapping in terms of distinct cell IDs shown in Fig.7(i.e., around 60% of pixels covered by one distinct
cell ID). As a result, we need to better investigate this aspect, mainly in two ways: i) checking if we encounter the same trends by performing an analysis on the number of distinct BS IDs, ii) analyzing the interactions between RSRP and the number of distinct BS/cell IDs. In the following, we provide more details about the first avenue of investigation. Regarding the second point, we treat it in detail in the Sec.IV-E.
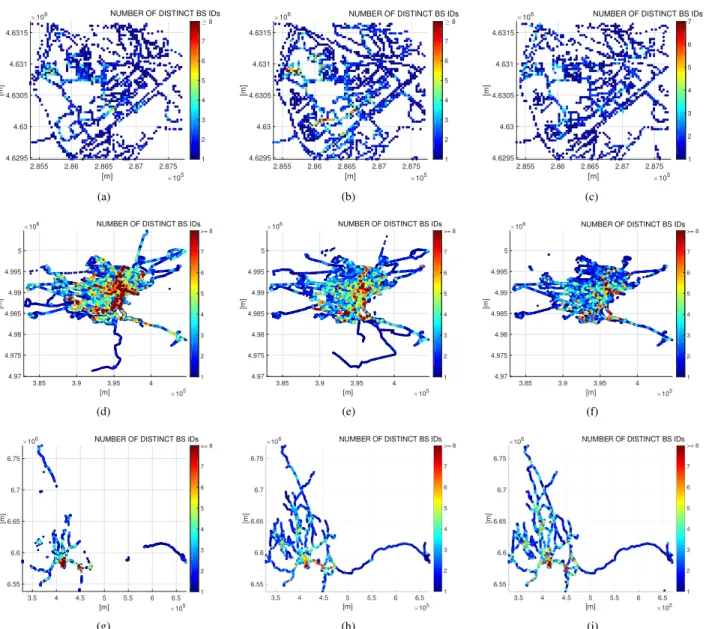
We initially concentrate on the number of distinct BS IDs. Fig.8reports the visual maps across the different scenarios and the different operators. In general, the number of distinct BS IDs is lower compared to the number of distinct cell IDs. This is an expected result, as multiple sectors (each of them identified by a unique cell ID) are colocated at one BS site (which is identified by a unique BS ID). For example, a classical BS configuration is to install three sectors in the same site. However, this is not a fixed ratio, as configurations with more (or less) than three sectors are also possible. In any case, we can note from Fig.8that there are huge differences in terms of distinct BS IDs across the different scenarios and
FIGURE 8. Number of distinct BSs IDs across the different scenarios and operators (figures best viewed in colors). (a) TMC TIM. (b) TMC Vodafone. (c) TMC Wind Tre. (d) Turin TIM. (e) Turin Vodafone. (f) Turin Wind Tre. (g) Stockholm 3. (h) Stockholm Telenor. (i) Stockholm -Telia.
the operators. However, by comparing the pixels in Fig.6and in Fig.8, it is possible to grasp that, in general, if a pixel is experiencing a large number distinct cell IDs, it will likely experience also a large number of distinct BS IDs. However, this issue needs to be properly quantified, and we will do so later in the paper.
Additional insights are provided by Fig. 9, showing the CDFs of the number of distinct BS IDs. In particular, it is possible to note that most of the pixels are served by one BS ID in the TMC and Stockholm scenarios. A similar behavior can be noted for Wind Tre and Vodafone in the Turin scenario. For what concerns the TIM operator in Turin, in this case most of the pixels are served by at most two distinct BS IDs. Therefore, the main outcome of Fig.9 is that the each BS serves almost exclusively a given portion of territory. The overlapping coverage from multiple BSs (which instead
FIGURE 9. CDFs of the number of distinct BS IDs across the different countries and operators (figure best viewed in colors).
strongly affects other scenarios like in the USA [20], [21]) appears to be not so widespread in our cases.
TABLE 5. Correlation coefficients and p-values across the different scenarios/operators.
E. CORRELATING RSRP AND COVERAGE OVERLAP
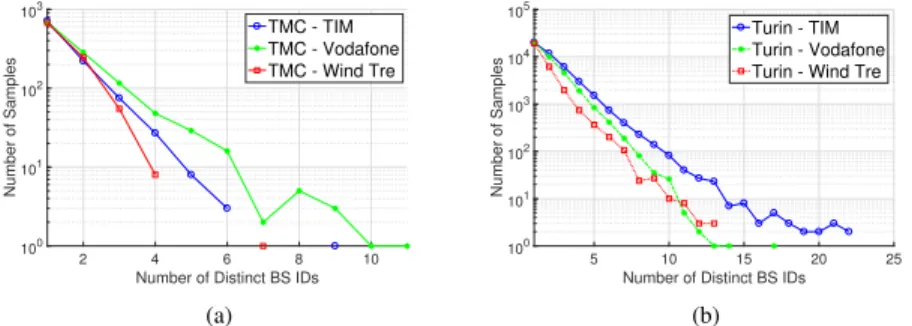
In the following, we aim at finding whether there is a rela-tionship between the number of distinct BS IDs observed in a pixel, and the values of RSRP recorded in the same area. To this end, Fig. 10(a)-10(c) depict the average RSRP versus the number of distinct BS IDs for each scenario and each operator, with 95% confidence intervals. Huge differ-ences emerge among the different operators in each scenario, as well as across cities. In particular, the average values of RSRP are decreasing when the number of distinct cell IDs passes from one to four. This is verified for the operators in both the TMC and the Turin scenarios, as well as for the Telenor operator in Stockholm. We provide a simple intuition for such a decrease: if a pixel is located at the edge of multiple BSs, it will experience a number of distinct BS IDs larger than one, despite the relatively low values of RSRP. However, when the number of distinct BS IDs is larger than four, the decreasing trend for the RSRP values is not always observed (see, e.g., the TMC and in Turin scenarios in Fig. 10(a) and in Fig. 10(b), respectively). In parallel, we can also note an increase in the confidence intervals. To provide further insights, Fig. 11 reports the number of samples (i.e., pixels) for each number of distinct BS IDs: interestingly, an exponential decrease (note the logarithmic y-axis) affects the number of samples, implying that samples for a number of distinct BS IDs larger than four are rare. This explains the variations on the average RSRP as well as the increase in the confidence intervals observed in Fig. 10(a) and in Fig. 10(b).
Until now, we have focused our attention to Turin and TMC cases, leaving almost apart the Stockholm scenario (shown in Fig. 10(c)). In this case, we can note that the RSRP does not always decrease even when the number of distinct BS IDs passes from one to four. This is especially true for the 3 operator, but also Telia reveals a light decrease followed by an increase. However, the number of samples in Fig. 11(c) is quite large, at least until a number of distinct BS IDs equal to 7. Therefore, we can infer that both 3 and Telia have a dif-ferent planning rule compared to the other operators, which involve a better overlapping of BSs coverage. In particular, for the other scenarios and the other operators the coverage overlapping is achieved at the cell edges, where the RSRP is low. On the other hand, the coverage overlapping for 3 and
Telenor tends to be not located at the cell edge, but in zones close to the center of the cell, where the RSRP is higher. We conclude that both operators employ small cells in order to improve the capacity provided to users.
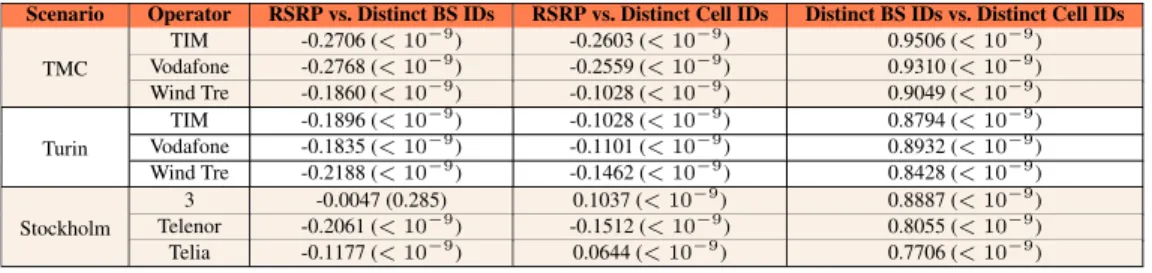
In the following, we perform a correlation analysis in order to derive additional information about the relationships between different metrics. Tab.5reports the correlation coef-ficients and the p-values in brackets for the following pairs: i) RSRP and number of distinct cell IDs, ii) RSRP and number of distinct BS IDs, iii) number of distinct BS IDs and number of distinct cell IDs. Each pair is retrieved from the metrics measured in each pixel. Several considerations hold in this case. First, a light (and significant) negative correlation is observed between the RSRP values and the number of distinct cell IDs for: all the operators in TMC, all the operators in Turin, the Telenor operator in Stockholm. Second, a light (and significant) negative correlation is observed between the RSRP values and the number of distinct BS IDs, again for the operators in TMC and Turin, as well as Telenor. This correlation is in general higher compared to the correlation considering the RSRP and cell IDs. Third, in the Stockholm scenario, when the RSRP and the number of distinct cell IDs are considered, a very light correlation (for Telia) or almost no correlation (for 3) are observed. When considering the RSRP and the distinct number of BS IDs, a non-significant value is achieved by 3, and a very light negative correlation is observed from Telia. This confirms our previous finding from Fig. 10(c) that, if the number of BS/cell IDs is increased, the RSRP is not always worsened. Finally, the correlation between the number of distinct BS IDs and the distinct number of cell IDS is always higher than 0.7 in all the sce-narios. As already mentioned earlier, this result is expected, as a single BS site is composed of multiple cells and there exists an inherent physical match between the two types of structures.
Remark 7: Our analysis suggests that, for the TMC and the Turin scenarios, there is a light negative correlation between the number of distinct cell/BS IDs and the RSRP values. This means that the average RSRP tends to be reduced as the number of cell/BS IDs is increased. Consequently, an UE located in pixels sensing more than one BS IDs in the TMC and Turin scenarios may perform frequent handovers from one BS to another one, with a negative impact on the QoS.
FIGURE 10. Average RSRP vs number of distinct BS IDs. (a) TMC. (b) Turin. (c) Stockholm.
FIGURE 11. Number of Samples vs number of distinct BS IDs. (a) TMC. (b) Turin. (c) Stockholm.
FIGURE 12. Average Distance from Serving BS in the TMC scenario. (a) TMC - TIM. (b) TMC - Vodafone. (c) TMC - Wind Tre.
F. CORRELATING RSRP AND DISTANCE FROM BS
As the RSRP is correlated to the amount of power received from the BS, it may depend on the distance between the UE and the BS. Therefore, we study the relationship between these two metrics. A preliminary step is the computation of the pixel-to-BS distance, which requires knowing the actual locations of BS sites installed over the territory – an infor-mation that is not immediately available in our datasets. As the process of inferring BS locations is time-consuming, we proceed as follows: i) we focus on the TMC scenario, ii) we extract the RSRP values for each BS ID of every operator, iii) we derive the candidate locations of BS sites by observing the zones experiencing the highest RSRP (for each BS ID), iv) we manually verify the presence of the BS sites in the candidate locations by physically visiting them, and
v) we update the exact position of each BS site.7Given the locations of BS sites, and the BS IDs for each pixel, we then compute the pixel-to-BS distance for TIM, Vodafone, Wind Tre in TMC. When multiple BS IDs are sensed in the same pixel, we compute the frequency-weighted average over all the serving BSs. Fig. 12(a)–12(c) show the result, where the pixel color code follows the colorbar on the right of each subfigure. Quite surprisingly, we find that most of the pixels in the TMC area are very far from the serving BS. This is especially true for Vodafone, in Fig. 12(b), but both TIM,
7We remark that checking all BSs serving the TMC neighborhood took
us several person-days, and more than 50 km of traveling in the area to verify the candidate BS sites. Performing this check in the citywide Turin and Stockholm scenarios is not feasible, and we leave the investigation of this aspect as future work.
FIGURE 13. Number of samples versus serving distance in the TMC scenario.
in Fig. 12(a), and Wind Tre, in Fig. 12(c), also experience a similar trend.
Remark 8: The pixel-to-BS distance in the TMC scenario is pretty large, and it is expected to have a negative impact on the perceived QoS. This condition is a direct consequence of the non-perfect planning of the operators. Moreover, the com-putation of the distance imposes to precisely localize the serving BS. This task that cannot be done by solely analyzing the RSRP information, but it requires to physically verify the actual position of the serving BS.
We delve deeper in the analysis by introducing the follow-ing set of distance bins: 0-300 [m], 300-400 [m], 400-500 [m], 500-600 [m], 600-700 [m], 700-800 [m], 800-900 [m], 900-1000 [m], ≥1000 [m]. This binning guarantees that a consistent number of pixels in almost each value interval, as shown in Fig.13. We then compute the average RSRP for each bin, as well as the corresponding confidence interval, in Fig.14. Interestingly, the average RSRP decreases in a very clear way when the distance from the serving BS is increased, and the trend is consistent for all the operators. For example, in the case of the Wind Tre operator, the average RSRP decreases from ≥−88 [dBm] at ≤300 [m] to ≤−100 [dBm] at ≥1000 [m]. We conclude our analysis by computing the correlation coefficients and the p-values for the RSRP versus pixel-to-BS distance, as per Tab.6. Here, we do not constrain the RSRP value to be included in a specific bin, and we com-pute the correlation on a pixel basis. The correlation is quite strong and, as one would expect, negative; this is especially true for Vodafone and TIM, which exhibit correlation values close to −0.5.
Remark 9: Our analysis over the TMC scenario reveals that the RSRP values and the pixel-to-BS distance are clearly and negatively correlated. This may be well influenced by NLOS conditions with respect to the serving BS, which become increasingly frequent as the distance grows, with a negative impact on the QoS.
V. QUALITATIVE ANALYSIS OF UE-GENERATED EFA AND PERCEIVED QoS
We now investigate how the issues in existing deployments, caused by EMF limits and unveiled by the quantitative anal-ysis in SectionIV, affect the end-user device. To this end, we carry out a qualitative study of the impact that cellular planning has on the EFA generated by the UE and on the QoS
FIGURE 14. Average RSRP versus serving distance in the TMC scenario.
TABLE 6. Correlation coefficient and p-value for the RSRP and pixel-to-BS distance in the TMC scenario.
perceived by the subscriber. We first present our methodology in SectionV-A, and then introduce the reference scenario in Section V-B. We report on the breakdown of the mea-surements in SectionV-C. Finally, SectionV-Danalyzes the main features of the clusters that have been retrieved from the measurements, while SectionV-Eillustrates how time affects our results.
A. METHODOLOGY
In order to measure the EFA generated by the UE, and how much this metric is impacted by the currently deployed planning, we adopted an approach based on three principles: i) the exploitation of active measurements, in which the UE is used to transfer the same amount of data in each test loca-tion; ii) the selection of the test locations based on different values of RSRP, distance from serving BS, and LOS/NLOS condition, which result in different QoS perceived by the user; and, iii) the adoption of professional EMF meters in order to measure the EFA levels generated by the UE and the ones emitted by the serving BS. For each test location, we pro-ceed as follows: i) we place the UE at a height of 0.8 [m], pointing it towards the position of the serving BS, ii) we place the probe of the UE EMF meter in close proximity (i.e., within 1 [cm]) of the UE, with the meter probe oriented towards the UE, iii) we place the BS probe in proximity to the current location, with the meter probe oriented towards the serving BS, iv) we measure the EFA generated by the UE when during a data transfer session, v) in parallel, we measure the RSRP and the cell ID, and vi) we turn off the UE and we measure the EMF generated by the BS which has previously served the UE.
Fig.15reports the main steps to perform the evaluation of the UE EFA and the QoS. Similarly to SectionIV, we employ a GPS tracker to save the current position p(t) at each time instant t. In addition, we measure the EFA generated by the UE eUE(t) and the EMF generated by the BS eBS(t0) with
FIGURE 15. Main steps to perform the UE EFA and QoS evaluation.
TABLE 7. Devices and tools to perform the UE EFA evaluation.
the EMF meters. Clearly, since the BS EMF measurement is done after the UE EFA one, it holds that t0 > t. Moreover, we measure the RSRP r(t) and the current cell ID c(t) with the UE metrics meter already used during the QoS evaluation of SectionIV. Given this information, we then perform a map-ping operation based on t and t0(we preliminary checked that all clocks in all devices are synchronized to the same time), thus retrieving the tuple t, p(t), eUE(t), eBS(t0), r(t), c(t). During the second step, we compute the BS ID for each cell ID (this operation is similar to one described in SectionIV), the distance of the UE from the serving BS, and the total time to transfer the file at the selected location. This last information is computed as the amount of time during which the UE EFA is higher that the baseline value recorded at the location (i.e., the EFA measured without using the UE and without transferring the file). The output of Step 2 is then a set of metrics for each test location l, namely: the GPS coordinates P(l), the UE EFA EUE(l, t) at time t, the BS EMF EBS(l, t0) at time t0, the RSRP R(l) (which is computed as the average of the measured RSRP over time r(t) for the
FIGURE 16. Test locations, BS site location and RSRP coverage of the selected BS.
FIGURE 17. Terrain view with test locations (blue pins) and BS site location (red pin).
location), the cell ID C(l), the BS ID B(l), the distance from the serving BS D(l), and the time to transfer the file δ(l). Finally, these metrics are used for the UE EFA evaluation, which is detailed in SectionsV-CthroughV-E.
B. SCENARIO
Tab. 7 summarizes the devices and tools used to perform the UE EFA evaluation. We use a Samsung S6 Edge as UE, with a Vodafone SIM card and an operating uplink LTE fre-quency of 1800 [Mhz] (band number 3 according to the Italian frequency bands), running the MapMarker and CellMapper apps as the GPS tracker and UE metrics meter, respectively. As the UE EFA meter, we adopt a PCE-EM300 meter, and we set the sensed frequency to the one used by the UE. In addition, the transferred file is a MPEG-4 video, which is uploaded as an email attachment and sent to an email