62
Materials and methods
63
The experimental samples
Experimental samples were collected from the experimental apiary (Fig. 2.1) of the Department of Veterinary Science of the University of Pisa in San Piero a Grado (Latitude: 43.680958(43°40'51.45''N) Longitude : 10.347489(10°20'50.96''E)).
Fig. 2.1 Experimental apiary of the Department of Veterinary Science of the University of Pisa
The samples affected by the disease were collected by another apiary that has an ongoing collaboration with the laboratory of proteomic of Apis mellifera of Dr Felicioli.
64
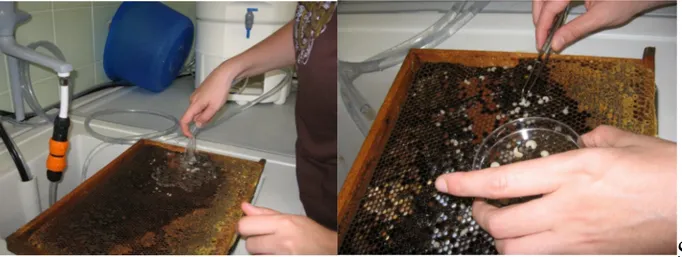
Fig. 2.2 Collection of larvae from the frame using a spray of water.
The pressure of the water caused the larvae to rise at the surface of the frame (Fig. 2.2).
Subsequently the larvae were collected in Petri dishes and divided by weight and size (Fig. 2.3) because each weight corresponds to a larval stage.
Fig. 2.3 Division of the larvae by their size.
The larval phase age lasts 5 days so the larvae were divided in L1, L2, L3, L4 and L5.
The larvae and pupae affected by the American Foulbrood were collected with tweezers (Fig. 2.4) because in the frame there was a lot of larvae killed by the bacteria and streamers.
65
Fig. 2.4 Samples affected by the American Foulbrood.
The larvae from frames contaminated by Paenibacillus larvae and with evident signs of American Foulbrood were collected only if still alive; dead larvae were discared.
Fig. 2.5 Larvae affected by Calcified brood.
The larvae affected by Sack Brood virus (SBV) and calcified brood were collected with tweezers (Fig. 2.5) and were already dead.
66
Regarding the adults, samples were collected of:
newly emerged,
nurses, guardians,
foragers,
drones.
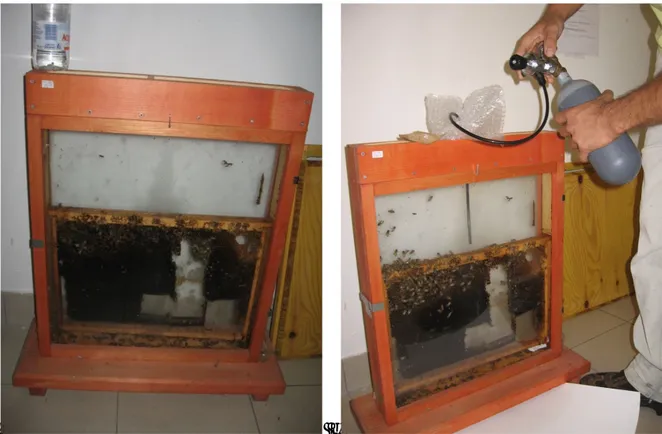
The newly emerged samples were collected from frames with brood after the removal of the other bees present. The frame put in a swarm box under sun (Fig. 2.6). When the box was all open the present bees were newly emerged ones.
Fig. 2.6 Swarm box used to collect the samples of newly emerged bees.
The nurses and the drones were collected directly from the frame with the tweezers. The nurses were identified as the bees that went in the cells to feed the larvae (Fig. 2.7).
67
Fig. 2.7 Nurse bees sampling from a frame.
The guardians (Fig. 2.8) were identified as the bees that attacked the beekeeper in order to defend the hive. The little door of the hive used by the foragers to bring the pollen inside, was closed; it was afterwards opened again and the first bees that came out from the hive were the guardians.
The guardians were collected in a bag suitable for freezing.
Fig. 2.8 The guardian collection: the guardians were the first bees that came out from the hive to attack the beekeeper when the hive was closed and opened again.
68
The foragers were collected from the same little door (Fig. 2.9) when they stopped themselves before entering in the hive with the pollen.
Fig. 2.9 The forager collection: the foragers had pollen in their “curbicolette”.
All the samples of adult bees were transported in a box with ice.
The Paenibacillus larvae was the stock ATCC 9545 given to us by the CRA api of Bologna. The samples of ApeNet national project were collected in this way: before and after the treatment period, the samples were collected from 6 colonies in group of 50 adult bees (the very old bees or the ill ones were eliminated), and about 50 newly emerged bees.
Regarding the AMR group, 50 new emerged bees were collected also the day after the treatment. The Amrine method consists of:
- in the posterior part of the hive to put an absorbent paper with 15ml of Honey bee healthy which is a stimulant honeybee feeding composed of lemongrass and spearmint oil concentrate. - in the anterior part to put cardboard impregnated with 70ml of formic acid 50%.
The samples for the experiments with Nosema were sent from the CRA api of Bologna.
Frames with rising brood were taken from two hives and put in a thermostat where the honey bees emerged. They were then reared in a small box ad libitum fed with syrup of sugar 50% w/v.
69
The honeybees were then divided in 4 thesis: 1. Control
2. Nosema
3. Pesticides (clothianidin [2 ng/ml]; clothianidin [10 ng/ml]; clothianidin [50 ng/ml]) 4. Nosema and Pesticides (Nosema + clothianidin [2 ng/ml]; Nosema + clothianidin [10
ng/ml]; Nosema + clothianidin [50 ng/ml])
The bees of thesis “Nosema” and “Nosema and Pesticides” at 2 days of age, were inoculated with Nosema ceranae using 2 microliters of spores suspension in sugar solution 50% containing about 118000 spores (59000 spores/μl).
Regarding for bees of the thesis “Pesticides” the treatment was given every day and consisted of 3 ml of sugar solution with clothianidin solution in 1% acetone at 3 different concentrations: 2 ng/ml, 10 ng/ml and 50 ng/ml.
The bees of the thesis “Control” and “Nosema” were fed with syrup with 1% acetone. So at the end of the rearing there were 7 kind of samples:
Control; Nosema; clothianidin [2 ng/ml]; clothianidin [10 ng/ml]; clothianidin [50 ng/ml]; Nosema + clothianidin [2 ng/ml]; Nosema + clothianidin [10 ng/ml]; Nosema + clothianidin [50 ng/ml].
70
Rearing in hoarding cages
Honey bees from the experimental apiary of San Piero a Grado were reared in an Observation frame (Fig. 2.10a) for about 7-8 days using the honey of the inside in the frame. The observation frame is made of wood and glass. A certain amount of these honeybees was put in a rearing cage (Fig. 2.11) with the following dimensions: 13 cm wide, 10,5 cm high and 5cm deep. These rearing cages are made of plastic, non-toxic and autoclavable material. The honeybees also lived in rearing cages for about 7-8 days. In this case there wasn’t honey in the box or it was not enough so honey was added with a syringe.
a. b.
Fig. 2.10 a. Observation frame used to rear honeybees for the experiments. B. The honeybees were collected using alimentary CO2.
After about 7 days the honeybees were collected using food-grade CO2 (Fig.2.10b) to anesthetize
71
72
Organs’ dissection
The samples were fixed in a small bed of paraffin with entomology needles, the organs were dissected and were then immersed in a drop of distilled water. In order to dissect the organs a stereoscope (Fig.2.12) was used.
Fig. 2.12 Stereoscope used in dissections.
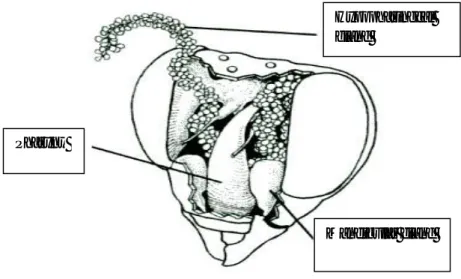
The head is a roughly triangular and flatted box. The first step was the mandibular gland (Fig 2.13) collection. The mandibles were torn off with tweezers and the sac remained attached at them. In some experiments we separated the sac from the duct. The head was cut in the dorsal part (Fig.2.14) with a n° 10 lance following a line parallel to the compound eyes. The anterior part of the head was removed. This way the head was open and the brain was visible.
73
Fig. 2.13 Head of Apis mellifera opened where are showed mandibular and hypopharingeal glands.
Fig. 2.14 Bee Head. The red line represents the line of the incision.
From the open head hypopharingeal (Fig. 2.13, 2.18) glands were collected. Each gland consists of numerous small oval cellular bodies attached by short necks to an axial duct. The axial duct was torn off with tweezers. Subsequently the post-cerebral glands (Fig. 2.15, 2.16) were collected. This glands have acini more translucent with a different, characteristic shape and the
Hypopharingeal gland
Mandibular gland Pharynx
74
acini are arranged in small groups on a branching system of tubules. The tubules with acini was torn off with tweezers.
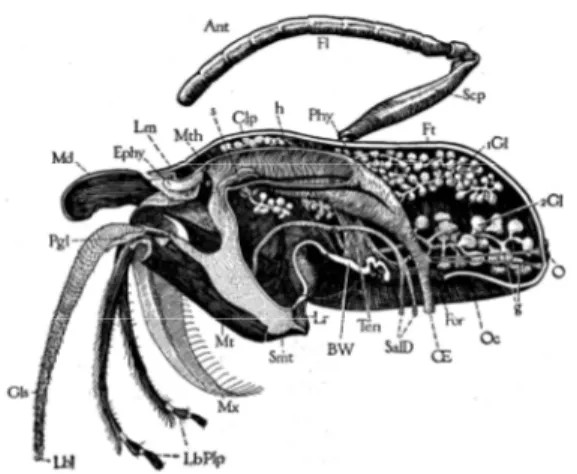
Fig. 2.15 Median longitudinal section of the head of a worker, but with entire labium attached, showing internal organs except muscles and brain. Right half of head cut near the median plane, with right antenna (Ant), right mandible (Md), and lobe of right maxilla (Ga), but with entire labium and epipharynx (Ephy). Internally are shown the pharynx (Phy), oesophagus (E) pharyngeal glands (1Gl), postcerebral salivary glands (2Gl), and salivary ducts to thorax (SalD). (Snodgrass, 1925)
Fig. 2.16 Glands of the head and thorax. A, hypopharyngeal plate of worker, anterior, showing apertures (o) of food glands. B, same, posterior, with proximal parts of food glands. C, labial salivary gland system of worker, including head glands (HGld) and thoracic glands (ThGld). D, detail of head gland. E, detail of thoracic gland. H, section of a food-gland lobule. I, posterior wall of head of worker, anterior, showing position of head salivary glands.
O, orifice of food-gland duct; y, oral arm of hypopharyngeal suspensorium, with protractor (32) and retractor (33) muscles (Snodgrass, 1956).
75
All the glands were dissected using a stereoscope and the images were photographed (Fig. 2.17) with Canon PowerShot A530, 5 mega pixels camera.
a.
b.
c. d.
Fig. 2.17 All the glands were photographed with a Canon PowerShot A530 camera: a)mandibular gland, b)hypopharingeal gland, c)salivary gland and d)post-cerebral gland.
76
Fig. 2.18 Alimentary canal and associated glands of worker. A, reservoir of salivary gland; Dct, duct of salivary gland; 1Gl, pharyngeal gland; 2Gl, postcerebral glands, 3Gl, thoracic salivary glands. (Snodgrass, 1925).
For the experiment of Senotainia tricuspis the thorax of the Apis mellifera was opened to take the larvae of the insect (Fig. 2.19).
a. b.
Fig. 2.19. a. larvae of Senotainia tricuspis between the tree parts of the honeybee (head, thorax, abdomen). b. Image of larvae of Senotainia tricuspis at light microscopy.
77
Chemicals
All the chemicals were purchased from SIGMA Aldrich, GE healthcare and Panreac.
Proteome of mandibular, hypopharyngeal and salivary glands
Protein extraction
About 30 glands were put into an eppendorf with 500 µl of PBS buffer pH 7.4 (137mM NaCl,
2.7mM KCl, 10mM sodium phosphate dibasic, 1.76mM potassium phosphate monobasic), broken with a teflon pestle for eppendorf or with a mortar (Fig.2.20) and sonicated by UP 200s sonicator (dr. hielscher Gmbh) for 1 minute.
a.
b.
78
The samples were then centrifuged at 14000 rpm at 4°C for 20 minutes. The supernatant was collected and centrifuged again at 14000 rpm at 4°C for 15 minutes.
In the experiment with precipitated extract TCA (Trichloroacetic acid) 10% w/v was added in drops with a glass pasteur. The eppendorf was kept at -20°C for 45 minutes and after was centrifuged at 14000 rpm at 4°C for 15 minutes. The pellet was collected and suspended in 200 µl of PBS. The solution was dialyzed in visking dialysis tube (MWCO 3500 Daltons, Size tubing
diameter 16.0 mm) over night.
The day after the sample was quantified by the Bradford method (Bradford, 1976) at 595nm (using ovalbumin for the calibration curve) or with a Qubit fluorometer (Fig.2.21).
Fig. 2.21 Qubit fluorometer.
2D electrophoresis
The bidimensional electrophoresis (2D) was made according to Görg (Görg et al., 1988). To an
aliquot corresponding to 150 µg of total protein, was added a rehydration solution composed of
Urea 7 M, ThioUrea 2M, CHAPS (3-[(3-Cholamidopropyl)-dimethylammonio]-1-propane sulfonate) 2%, DTT (Dithiothreitol) 60mM, IPG buffer 1%, trace of Bromophenol blue in water solution. After centrifugation for 10 minutes at 14000rpm at 4°C, 150 µl of solution was loaded
79
for each strip (7cm) pH 3-10 in an IPGphor III (Fig.2.22) apparatus (Iso-Electro-Focusing) ( GE healthcare) and run overnight with the following protocol:
Rehydration time 13h, T 20°C Step 100V for 2h Step 500V for 2h Step 1000V for 2h Gradient 2000V for 2000Vh Gradient 3000V for 4000Vh Gradient 5000V for 3000Vh.
Fig. 2.22 IPGphor III (GE healthcare).
Following the Iso-Electro-Focusing the gels were equilibrated in agitation with a mod.711 agitator (Conacom Italy) using the following solution:
6M Urea, 75mM TrisHCl pH 8.8, 29.3% glycerol, 2% SDS (Sodium Dodecyl Sulphate), trace of Bromophenol blue. The equilibration was carried out for 15 minutes with the addition of 1%
80
DTT and for 15 minutes with addition of 2.5% iodoacetamide. After the equilibration the strips were loaded into 12%T, 2.6%C separating polyacrylamide gels (1.5 mm thick) according to Laemmli (Laemmli, 1970) but without stacking gel. The running gel was composed of: 1.5M TrisHCl pH8.8, distilled water, 40% Acrilamyde, 2% bys-acrylamide, 10% SDS, ammonium persulfate and TEMED (N,N,N',N'-tetramethylethylenediamine ). The strips were loaded (Fig.2.23a) into a film of agarose 0.5% in contact with the polyacrylamide gel. Low range markers 14,4-97 kDa were used. The samples ran at 20mA/ gel at 15°C for about 2 h using SE 260 mini vertical electrophoresis (Fig. 2.23b) (Amersham Biosciences) and Electrophoresis power supply EPS 301 (Amersham pharmacia biotech), running buffer (1.9M Glycine, 0.25M Tris base, 0.035M SDS).
a. b.
Fig. 2.23 a. Following equilibration the strips were loaded into a film of agarose 0.5% in contact with the polyacrylamide gel. b. The samples ran using a SE 260 mini vertical electrophoresis system.
After the electrophoresis the gels were put in a glass tank with a fixing solution (40% methanol, 10% acetic acid, 50% distilled water) for 30 minutes in agitation to block the proteins. The gels
81
were stained overnight with Coomassie brilliant G colloidal (Candiano et al., 2004) 80% (20ml phosphoric acid, 120g ammonium sulphate, 1g coomassie brilliant blue G-250 brought to a volume of 1l with distilled water) and 20% methanol and discoloured with water. All the replicates have been scanned with an Epson Expression 1680 Pro scanner and analyzed using PDQuest (Biorad).
Some spots were analyzed using a 4800 MALDI TOF/TOF mass spectrometer (Applied Biosystems/MDS Sciex, Toronto, Canada), equipped with a laser emitting at λ= 355 nm with a
repetition rate of 200 Hz. The mass spectrometer analyses were carried out with a 4000 Series Explorer, version 3.5.2 program, in a laboratory of CNR in Pisa.
Zymography of larval protein extract infected by Paenibacillus larvae
Protein extraction
Samples affected (but not dead) by AFB and control samples of larvae of Apis mellifera were collected.
Table 2.1 number of samples used and quantity of PBS pH 7.4 used for each extract.
Healthy (n°) PBS (µl) Diseased (n°) PBS (µl)
samples 1extract 2extract 1extract 2extract 1extract 2extract 1extract 2extract
Larvae 0.01g 6 6 200 200 4 4 200 200 Larvae 0.05g 4 5 400 500 4 4 400 400 Larvae 0.1g 4 4 400 500 4 3 400 400 Prepupae 4 4 600 600 4 4 500 500 Pupae eyes 3 3 600 600 Pupae no eyes 2 2 600 600 Paenib. L. 50µl 50µl 200 200 Secrete 400µl 400µl 400 400
82
Different quantities of PBS pH 7.4 (table 2.1) were added to the samples which were then kept at -20°C for at least 1h. After this time samples were homogenized by a Teflon pestle and were centrifuged for 20 minutes at 14000 rpm at 4°C. The samples were put again at -20°C for 15 minutes and were centrifuged at 14000 rpm at 4°C for 10 minutes. The prepupae, healthy and diseased, were also dialyzed in visking dialysis tube ( MWCO 3500 Daltons, Size tubing diameter 16.0 mm) for 3h. The total protein concentration of the extracts was quantified with a Qbit fluorometer.
Mono-dimensional zymography
The electrophoresis for activity (zymography) was made according to Heussen and Dowdle, (1980). An aliquot of the sample corresponding to 20 µg of total protein was mixed with samples buffer without β-mercaptoethanol (62.5mM TrisHCl pH 6.8, 10% glycerol, 2% SDS, trace of Bromophenol blue in water solution). The solutions with samples and sample buffer were loaded into 12%T, 2.6%C separating polyacrylamide gels (1.5 mm thick) according to Laemmli (1970) with stacking gel 4% ( 0.5M TrisHCl pH 6.8, distilled water, 40% acrylamide, 2% bys-acrylamide, ammonium persulfate, TEMED). The running gel was adjusted and gelatine 0.5% was added to the distilled water. Low range markers 14,4-97 kDa were used.. The samples ran at 20mA/ gel at 15°C for about 2 h using SE 260 mini vertical electrophoresis. After the electrophoresis the gels were put in a glass tank and washed two times for 15 minutes in 2% Triton-X-100 ( to remove SDS). The gels were put in incubation at 37°C in 100mM TrisHCl pH8 for 2h. The proteases were shown by coloration with coomassie blue R-250 overnight and discoloured in fixing solution.
In the experiments which investigated what kind of inhibitor could be the inhibitor for our proteases, the following compounds were used: α-chymotrypsin (100µg/ml) and trypsin as standards, aprotinin (140µM), leupeptin (2mM), PMSF (phenylmethylsulfonyl fluoride) (2mM), TPCK (Tosyl phenylalanyl chloromethyl ketone) (2.5mM), trypsin inhibitor (30mg/ml), bestatin
83
(300µM), EDTA (Ethylenediaminetetraacetic acid) (4mM), protease Inhibitor Cocktail (contains 4-(2-aminoethyl)benzenesulfonyl fluoride (AEBSF), E-64, bestatin, leupeptin, aprotinin, and sodium EDTA), pepstatin A (90µM), TLCK (n- a-tosyl-l-lysine chloromethyl ketone hydrochloride) (1mM), iodacetamide (250mM), leupeptin (2mM).
Regarding the experiment about two different pH (6 and 7) 200mM Acetate buffer (acetic acid and sodium acetate) for pH6 and 100mM TrisHCl for pH7were used.
In the experiment to investigate the inhibitor of trypsin and chymotrypsin present in the samples, two washing of 15 minutes in 2% Triton-X-100 were made and then gels were put in incubation at 37°C in 100mM TrisHCl pH8 with Trypsin (25µg/ml) and α-chymotrypsin (100µg/ml) for 2h
according to Felicioli (Felicioli et al., 1997). Bi-dimensional zymography
Samples corresponding to 75µg of total protein were used ad added reagents of the rehydration
solution composed of Urea 2M , Chaps 2%, DTT 0.5%, IPG 1%, trace of Bromophenol blue in water solution. After centrifugation at 14000rpm for 10 minutes at 4°C the samples were loaded on 7cm strips pH 3-10 and 11cm strips pH3-10.
With the 7 cm strips the following protocol was used: Rehydration time 12h Step 100V for 2h Step 500V for 2h Step 1000V for 2h Gradient 2000V for 2000Vh Gradient 3000V for 4000Vh Gradient 5000V for 3000Vh.
With the 11 cm strips the following protocol was used: Rehydration time 12h
84 Step 50V for 1h Step 100V for 1h Step 500V for 1h Step 1000V for 2h Gradient 3000V for 4000Vh Gradient 4000V for 3000Vh Gradient 6000V for 3000Vh.
At the end of the Iso-Electro-Focusing the gels were equilibrated with the sample buffer for zymography without β-mercaptoethanol ( 62.5mM TrisHCl pH 6.8, 10% glycerol, 2% SDS, trace of Bromophenol blue in water solution ) for 20 minutes in agitation. For the second dimension
the strips were loaded into 15%T, 2.6%C separating polyacrylamide gels (1 mm thick) according to Laemmli (1970) but without stacking gel. The strips were loaded into a film of agarose 0.5% in contact with the polyacrylamide gel. Low range markers 14,4-97 kDa were used.. The samples ran at 20mA/ gel for 8 minutes and 30mA/gel for about 4h at 7°C using Hoefer SE 600 Ruby vertical electrophoresis apparatus with a 2197 power supply (LKB) (Fig.2.24). After the electrophoresis the gels were put in a glass tank and were washed two times for 15 minutes in 2% Triton-X-100 ( to remove SDS). The gels were put in incubation at 37°C in 100mM TrisHCl pH8 for 2h. The proteases were shown by coloration with coomassie blue R-250 overnight and discoloured in the fixing solution. All the replicates have been scanned with an Epson Perfection V-750-M Pro scanner
85
a. b.
Fig. 2.24 a. After equilibration the strips were loaded into a film of agarose 0.5% in contact with the polyacrylamide gel. b. The samples ran using Hoefer SE 600 Ruby vertical electrophoresis apparatus.
About the experiment to investigate the inhibitor of trypsin and chymotrypsin present in the used samples, after two washings for 15 minutes in 2% Triton-X-100, the gels were put in incubation at 37°C in 100mM TrisHCl pH8 with trypsin (25µg/ml) and α-chymotrypsin (100µg/ml) for 2h
according to Felicioli (Felicioli et al., 1997).
About the gels for proteins, after the electrophoresis, they were put for 30 minutes into the fixing solution in agitation and after in Coomassie brilliant G colloidal overnight and destained with distilled water.
86
Investigation of Phenoloxidase, glucose oxidase and amylase by activity
staining
Amylase investigation
The collected samples of Apenet project consisted of:
1. Mandibular glands of newly emerged honeybees collected from the apiary the day before the treatment
2. Mandibular glands of newly emerged honeybees collected from the apiary treated with formic acid AMRINE method (AMR)
3. Mandibular glands of newly emerged honeybees collected from the apiary 30 days after the treatment
4. Mandibular glands of newly emerged honeybees collected from the control apiary the day before the treatment
5. Mandibular glands of newly emerged honeybees collected from the control apiary 30 days after the treatment
6. Mandibular glands of adult honeybees collected from the apiary the day before the treatment 7. Mandibular glands of adult honeybees collected from the apiary treated with formic acid
AMRINE method (AMR)
8. Mandibular glands of adult honeybees collected from the apiary 30 days after the treatment 9. Mandibular glands of adult honeybees collected from the control apiary the day before the
treatment
10. Mandibular glands of adult honeybees collected from the control apiary 30 days after the treatment.
The samples were extracted with the same method that was used for the extraction of the samples for the 2D electrophoresis.
87
Two 9 cm gels of polyacrylamide were prepared (T10% C2.6%) (Fig. 2.25a).
Running gel: Acrylamide/Bys-acrylamide solution 30% (37.5:1), 1.5M TrisHCl pH8.8, distilled water, APS 10%, TEMED, without SDS.
Stacking gel: Acrylamide/Bys-acrylamide solution 30% (37.5:1), 0.5M TrisHCl pH6.8, distilled water, APS 10%, TEMED.
The samples were loaded for native electrophoresis using Thermo Scientific Owl P9DS Dual Gel System Thermo 16 x 14-16 cm (Fig. 2.25b)with running buffer without SDS, 50mA/gel.
a. b.
Fig. 2.25 a. Two native gels of polyacrylamide were prepared T10% C2.6%. b. The samples were run using Thermo Scientific Owl P9DS Dual Gel System Thermo apparatus.
When the electrophoresis was completed the gels were put in agitation with M 103-BA roching agitator (MPM Instruments s.r.l.) (Fig. 2.26) for 2h with a 100ml/gel solution containing 1%starch in 50mM Na-acetate buffer pH 5.2 (optimum pH for the amylase) and 10mM CaCl2
(for the stability of the active site). After this incubation the gels were rapidly washed with 50mM Na-acetate buffer pH 5.2 and 10mM CaCl2 without starch, covered with a film of the
88
Fig. 2.26 At the end of electrophoresis the gels were put in agitation.
The buffer was then discarded and the gels were put in reaction with 1.3% I2, 3% KI. The gel
changed color and became black while where amylase was present the gel remained white. After the gels were washed with distilled water. It was very important that the gels were scanned immediately why the vaporized iodine. The scanned gels were then analyzed with the free software ImageJ (http://rsbweb.nih.gov/ij/index.html).
Phenoloxidase investigation
The collected samples of the Apenet project consisted of:
11. Thorax of newly emerged honeybees collected from the apiary the day before the treatment 12. Thorax of newly emerged honeybees collected from the apiary treated by formic acid
AMRINE method (AMR)
13. Thorax of newly emerged honeybees collected from the apiary 30 days after the treatment 14. Thorax of newly emerged honeybees collected from the control apiary the day before the
treatment
15. Thorax of newly emerged honeybees collected from the control apiary 30 days after the treatment
89
17. Thorax of adult honeybees collected from the apiary treated by acid formic AMRINE method (AMR)
18. Thorax of adult honeybees collected from the apiary 30 days after the treatment
19. Thorax of adult honeybees collected from the control apiary the day before the treatment 20. Thorax of adult honeybees collected from the control apiary 30 days after the treatment Samples with various treatments, like oxalic acid oxalic acid, oxalic acid and thymol, formic acid, thymol in strong concentration, and samples affected by American foulbrood, were also analyzed.
For each sample ten thoraxes were collected and polverized using liquid nitrogen in a mortar. The powder was suspended in PBS pH 7.4 and the concentrations were quantified with Qubit. Two 9 cm gels of polyacrylamide were prepared T10% C2.6% without SDS.
The samples were loaded for native electrophoresis using Thermo Scientific Owl P9DS Dual Gel System Thermo with running buffer without SDS, 50mA/gel.
After electrophoresis, using Schmid modified protocol ( Schmid et al., 2008) the gels were incubated in 10ml PBS solution pH 6.5 containing 150mM NaCl, 10mM Na2HPO4 (or PBS pH
7.4). L-dopa (3,4-diidrossi-l-fenilalanina) 40mg/50ml and 30ml of distilled water were added. The reaction was immediate using PBS pH 6.5 and needed 2h of incubation for PBS pH 7.4. Glucose oxidase investigation
Samples with various treatments, like oxalic acid, oxalic acid and thymol, formic acid, thymol in strong concentration, and samples affected by American foulbrood, were analyzed.
Two gels of T10%, C 2.6% were prepared with the following reagents:
Running gel: Acrylamide/Bys-acrylamide solution 30% (37.5:1), 40% sucrose in 0.2M Tris-Glycine pH 8.9, Distilled water, APS 10%, TEMED.
Stacking gel: Acrylamide/Bys-acrylamide solution 30% (37.5:1), 0.5M TrisHCl pH6.8, distilled water, APS 10%, TEMED.
90
The samples ran at 20mA/ gel at 15°C for about 2 h using SE 260 mini vertical electrophoresis, Running buffer ( 1.9M Glycine, 0.25M Tris base).
At the end of the electrophoresis, following the protocol described by Cohen (1973) but with some modifications, the gels were put in the glass tanks with a solution containing:
80ml 100mM Hepes pH7, 2.4mg EDTA, 10ml DAB (3,3'-Diaminobenzidine) (4mg/ml), 4ml HRP ( peroxidise from horseradish) (1mg/ml), 5ml 3M glucose. The glucose in the Hepes was mixed for 1h in an Are2 (VELP scientific) stirrer in order to obtain D-glucose ( Keilin and Hartree, 1952b) that is the substrate of the glucose oxidase. After 2h of incubation the reaction was visible.
Investigation
of
Phenoloxidase
and
glucose
oxidase
with
spectrophotometry
Phenoloxidase investigation
For the protein extracts, thoraxes and heads of honeybees were used. PBS buffer pH7.4 with 1% Triton X-100 (Alaux et al., 2010) was added to the biological samples. The samples were put at -20°C for 20 minutes and afterwards homogenized with a teflon pestle. PBS buffer pH7.4 without Triton was added to the supernatant. The total protein concentration was quantified using Qubit fluorimeter.
For this experiment spectrophotometry was used. Absorbance data were obtained using a Ultrospec 2100 UV pro (Amersham Biosciences) (Fig. 2.27).
91
Fig. 2.27 Ultrospec 2100 UV pro spectrophotometer and the cuvette with samples mixed to the solution to analyse.
The same total protein quantity in the same volume were analyzed.
The cuvettes were filled with the following solution: 675µl milliQ water, 475µl PBS buffer
pH7.4, 50µl sample in PBS pH7.4. Alaux protocol (Alaux et al., 2010) was used, with some
modifications.
The cuvettes were put in incubation at 37°C for 5 minutes.
After the incubation the cuvettes were put in the spectrophotometer and 300µl of
L-dopa (2mg/ml) were added. The reaction was immediate. Absorbance data were obtained at λ=490nm for 10 minutes.
92
The reaction between the compounds was:
PBS pH7.4 without sample was used as the white reference.
In some experiments the modified protocol was used: 30% ammonium hydroxide was used to dissolve the L-dopa. The first protocol was chosen because the ammonium hydroxide was very irritant for the technician.
Calibration curve for phenoloxidase by Melanin The cuvettes were filled with a solution containing:
675µl milliQ water, 525µl of PBS buffer pH7.4, 300µl of melanin at different concentrations.
The first concentration of melanin used was 1mg/ml in 30% ammonium hydroxide. For the other less concentrated solutions milliQ water was used. Absorbance data were obtained at λ=490nm.
93
Table 2.2 absorbance values and corresponding values of melanin mg/ml produced Melanin mg/ml Absorbance 0,00390625 0,001 0,00390625 0 0,00390625 0 0,0078125 0,01 0,0078125 0,007 0,0078125 0,006 0,015625 0,021 0,015625 0,023 0,015625 0,019 0,03125 0,041 0,03125 0,042 0,03125 0,042 0,0625 0,087 0,0625 0,086 0,0625 0,087 0,125 0,178 0,125 0,177 0,125 0,165 0,25 0,358 0,25 0,344 0,25 0,351
94
Table 2.3 mean absorbance values and corresponding values of melanin mg/ml produced Melanin mg/ml Absorbance average 0,003906 0 0,007813 0,007667 0,015625 0,021 0,03125 0,041667 0,0625 0,086667 0,125 0,173333 0,25 0,351
Fig. 2.28 The calibration curve was used to determine the equation to transform the absorbance values obtained in the experiments in mg/ml of melanine produced.
Each absorbance value obtained from the experiments (tables 2.2 and 2.3, fig.2.28) was transformed mg/ml of melanin produced using the following equation: Melanin (mg/ml)=(Abs+0,0031)/1,4166 Abs=absorbance
95
Glucose oxidase investigation using DAB
The protein extracts were prepared with the same method used for the samples in the phenol oxidase investigation but without 1% Triton X-100 in the PBS buffer.
Each cuvette was filled with 1.5ml of solution containing 100mM Hepes pH7, 0.1mM EDTA, 5mM glucose was prepared. The glucose in the Hepes was mixed for 1h to obtain D-glucose (Keilin and Hartree, 1952b). After this time DAB (0.18mg/ml), and HRP (peroxidise from horseradish) (0.02mg/ml) were added. The protocol of Cohen (Cohen, 1973) was used but modified. Before reading the absorbance 50µl of sample in PBS buffer were added in each
cuvette. The same total protein quantity in the same volume was analysed using a Ultrospec 2100 UV pro spectrophotometer.
Absorbance data were obtained at λ=352nm for 2h.
The reaction between the compounds was:
PBS pH7.4 without sample was used as the reference. Calibration curve for glucose oxidase by H2O2 for DAB
A solution was prepared containing:
100mM Hepes pH7, 0.1mM EDTA, DAB 0.18mg/ml, HRP 0.02mg/ml.
In each cuvette were put 1250µl of scalar dilutions of H2O2of solution and 300µl milliQ water.
96
The same total protein quantity in the same volume was analysed using a Ultrospec 2100 UV pro spectrophotometer.
Absorbance data were obtained at λ=352nm.
Table 2.4 absorbance values and corresponding values of H2O2 M produced.
M H2O2 Absorbance 2,75E-08 0 2,75E-08 0,001 2,75E-08 0,009 0,000000055 0 0,000000055 0,019 0,000000055 0 0,00000011 0,017 0,00000011 0,032 0,00000011 0,022 0,00000022 0,059 0,00000022 0,059 0,00000022 0,037 0,00000044 0,094 0,00000044 0,096 0,00000044 0,071 0,00000088 0,187 0,00000088 0,151 0,00000088 0,152 0.0000088 0,242 0.0000088 0,236 0.0000088 0,223
97
Table 2.5 mean absorbance values and corresponding values of H2O2 M produced.
M H2O2 Absorbance average 2,75E-08 0,003333 0,000000055 0,006333 0,00000011 0,023667 0,00000022 0,051667 0,00000044 0,087 0,00000088 0,163333
Fig. 2.29 The calibration curve was used to determine the equation to transform the absorbance values obtained in the experiments in values of H2O2 M produced.
Each absorbance obtained from the experiments (tables 2.4 and 2.5, fig. 2.29) was transformed using the following equation in the Molarity of produced H2O2:
98
Glucose oxidase investigation using O-Dianisidine
The glucose oxidase enzymatic activity was also analyzed using another protocol but the first protocol with DAB was preferred because the results were similar and the reagents of the first protocol were readily available. The second protocol consisted in a modified version of the protocol described by Alaux (2010).
The protein extracts were prepared with the same method used for the samples for the phenol oxidase but without 1% Triton X-100 in the PBS buffer.
Each cuvette was filled with 1.5ml of a solution containing 375µl 100mM Hepes pH7, 750µl
milliQ water, 150µl 100mM glucose (in Hepes 100mM pH7 and mixed for 1h), 75µl HRP and
50µl of sample in PBS pH7.4. After incubation for 10minutes at 37°C 150µl 3mM O-dianisidine
(in ethanol 95%) were added.
The reaction between the compounds was:
Absorbance data were obtained at λ=430nm for 1.5h.
PBS pH7.4 without sample was used as reference.
Calibration curve for glucose oxidase by H2O2 for O-Dianisidine
For each cuvette a solution was prepared containing:
425µl 100mM Hepes pH7, 750µl milliQ water, 150µl 3mM O-Dianisidine ( in ethanol 95%),
HRP 0.02mg/ml.
In each cuvette were put 150µl of scalar dilutions of H2O2 in milliQ water In the white H2O2 was
99
The same total protein quantity in the same volume was analyzed using a Ultrospec 2100 UV pro spectrophotometer.
Absorbance data were obtained at λ=430nm.
Table 2.6 absorbance values and corresponding values of H2O2 M produced.
MH2O2 Absorbance 0,0000016 0,219 0,0000016 0,222 0,0000016 0,243 0,0000033 0,436 0,0000033 0,447 0,0000033 0,43 0,0000067 0,79 0,0000067 0,766 0,0000067 0,75 0,0000134 1,518 0,0000134 1,478 0,0000134 1,395
Table 2.7 mean absorbance values and corresponding values of H2O2 M produced
M H2O2 Absorbance average 0,0000016 0,228 0,0000033 0,438 0,0000067 0,769 0,0000134 1,464
100
Fig. 2.30 The calibration curve was used to determine the equation to transform the absorbance values obtained in the experiments in values of H2O2 M produced.
Each absorbance obtained from the experiments (tables 2.6 and 2.7, fig. 2.30) was transformed using the following equation in the Molarity of produced H2O2:
M H2O2 =(Absorbance-0.0769)/103611.
Inhibition of Paenibacillus larvae by Glucose oxidase and
Phenoloxidase and their products
Minimum inhibitory concentration (MIC)
Minimum inhibitory concentration (MIC) of glucose oxidase and phenoloxidase against
Paenibacillus larvae ATCC 9545 was determined. The strain was stored at–80°C in BHI broth
added of 1% (v/v) glycerol as cryoprotectant. The strain was revitalized in glass tube with Brain Heart Infusion broth (BHI) as growth medium.
BHI composition was:
101
Calf brains (infusion from 200g), 12.5g/L Disodium hydrogen phosphate, 2.5g/L D(+) glucose, 2g/L
Peptone, 10g/L.
After 24 hours of incubation at 37°C in aerobe conditions the tube was centrifuged at 3000rpm for 10 minutes. The supernatant was removed and sterile physiological solution was added to the pellet in order to obtain a turbidity corresponding to the point 2 of Standard McFarland scale (approximately cell density 6X10^8 CFU/mL). For each experiment Gram staining was performed and cells were observed using an optic microscope 100X to check the culture purity (Fig. 2.28).
Fig. 2.28 Image of Paenibacillus larvae at light microscopy (100X) stained by Gram’ method.
The following solutions were prepared:
Solution A (GOX):
10ml 100mM Hepes pH7, EDTA 1.3mg, 0.2M glucose, 0.3M sucrose (all this reagents were mixed for 1h). Before the use 4mg of Glucose oxidase of Aspergillus Niger were added.
102
Solution B (Gluconic acid + H2O2):
5ml Gluconic acid (50% in water), 5ml H2O2 (40% in water).
Solution C (Gluconic acid):
5ml Gluconic acid (50% in water), 5ml milliQ water. Solution D (H2O2):
5ml H2O2 (40% in water), 5ml milliQ water.
Solution E (Phe-ox):
10ml PBS pH7.4, 20mg L-dopa, 16mg phenoloxidase (Agaricus bisporus). Solution F (melanin):
20mg Melanin in 4ml 9M NaOH (or hydroxide ammonium).
Solution G (T1):
The same composition of solution A without glucose oxidase. Solution H (T2): milliQ water. Solution I (T3): 10ml PBS pH7.4, 20mg L-dopa. Solution L (T4): 9M NaOH.
The solutions G, H, I, L were used as controls to esclude a potential inhibitory effect of the solutions used to dissolve the inhibitors.
103
The first wells of the microplates were loaded with 50% of the inhibitors solutions and 50% of BHI broth. The subsequent wells were filled with 50% of BHI broth and 50% of the solution of the previous well (Fig.2.29). Each well contained a total volume of 100µl comprising the
inhibitor dissolved in BHI broth and 5µl of the bacterial suspension. For each plate a positive
control well (BHI + bacterial suspension) and a negative control well (BHI) were included.
Fig. 2.29 The dilutions were made adding 50% of the previous well in 50% BHI broth.
The plates were incubated at 37°C for 24h in a moisture chamber in aerobe conditions.
The plates were then read by visual method. Wells with a bacterial precipitation with a diameter wider than 2mm were considered positive.
The solutions from the well corresponding to the MIC, was inoculated on Trypticase soy agar (TSA) medium to determine where the MIC corresponded to the minimum bactericidal concentration (MBC). The TSA medium containing:
15 g Tryptone, 5 g Soytone enzymatic digest of soybean meal, 5 g Sodium Chloride, 15 g Agar for One liter of solution with milliQ water.
104
Evaluation of survival growth rate
The MIC of the inhibitors were used to determine the survival growth rate of P. larvae. Sixty hundred µl of inhibitors were put in tubes with 6ml of BHI broth and 300µl of a standardized
Paenibacillus larvae culture. The final concentration of the bacteria corresponded to the point 2
of the Standard McFarland scale. Bacterial suspension in BHI without inhibitors were included as control samples.
The tubes were incubated for 24 hours at 37°C.
After incubation, 10 fold dilutions of the samples were performed in order to enumerate the colonies.
All the dilutions were inoculated by inclusion in TSA agar and incubated at 37°C for 48 hours. The survival rate was calculated as percentage of the growth after treatments compared to the growth of control samples.
First immune-histochemistry approach of the Phenol oxidase and
Glucose oxidase of larvae and prepupae phases
Incubation in the glasses
The samples used were L2 and L5 larvae, prepupae, pupae with red eyes, pupae with black eyes. They were included in a solution of Tissue tek were cut using a cryostat in 15 micron thick slices. The slices were put in antifreeze glasses and stored at -20°C.
50ml of each of the following solutions were prepared.
Solution A for Glucose oxidase (GOX):
Sucrose 5g, 0.1mM EDTA, 150mM glucose, HRP (1mg/ml), DAB (4mg/ml) in 50ml 100mM Hepes pH7.
105
Solution B for Phenoloxidase (Phe-ox) :
50ml milliQ water, L-dopa (40mg/30ml), 10ml PBS pH 7.4. Both solutions were incubated at 37°C for 10 minutes.
The glasses were put in 2 vertical carry-glasses tanks, each with 1 of the solutions and incubated at 37°C for 2h for GOX and for 1 day for Phe-ox.
Activity staining for GOX of slices stored at -20°C Three different gels were prepared.
Gel A contained: 6.975ml 100mM Hepes pH7 1.875ml 40% Acrylamide 1ml 2% bis-acrylamide 100µl SDS 10% w/v in water 80µl APS 10% 5µl TEMED
To this solution 0.3M sucrose, 150mM glucose, 0.2mM EDTA (these three reagents were thoroughly mixed for 1h), 10mg DAB, 1mg HRP were added.
After the addition of APS the gel became brown. We suppose that the APS could oxidize the DAB. Gel B contained: 6.975ml 100mM Hepes pH7 1.875ml 40% Acrylamide 1ml 2% bis-acrylamide 100µl SDS 10% w/v in water
106
80µl APS 10%
5µl TEMED
GEL C contained:
6.975ml 100mM Hepes pH7
0.5mg HRP (peroxidase from horseradish) 1.875ml 40% Acrylamide
1ml 2% bis-acrylamide 100µl SDS 10% w/v in water
80µl APS 10%
5µl TEMED
The slices of L5 were kept for 15 minutes under the hood. Different solutions were used for the different gels.
For the gel A 100mM Hepes pH7 were used.
For the gel B 100mM Hepes pH7, 5mg DAB, 0.5mg HRP were used. For the gel C 100mM Hepes pH7, 5mg DAB were used.
Activity staining for GOX of fresh slices
Prepupae were included in a solution of Tissue tek and cut using a cryostat in 15 micron thick slices.
The slices were fixed on antifreeze glasses. Two different gels were prepared.
Gel B contained:
107 1.875ml 40% Acrylamide 1ml 2% bis-acrylamide 100µl SDS 10% w/v in water 80µl APS 10% 5µl TEMED GEL C contained: 6.975ml 100mM Hepes pH7
0.5mg HRP (peroxidase from horseradish) 1.875ml 40% Acrylamide
1ml 2% bis-acrylamide 100µl SDS 10% w/v in water
80µl APS 10%
5µl TEMED
The slices were put on the gels and incubated horizontally with 2 different solutions. In the gel B 100mM Hepes pH7, 5mg DAB, 0.5mg HRP were used.
In the gel C we put on 100mM Hepes pH7, 5mg DAB were used. The glasses were incubated in the solution A.
Solution A for Glucose oxidase (GOX):
Sucrose 5g, 50ml 100mM Hepes pH7, 0.1mM EDTA, 150mM glucose, HRP (1mg/ml), DAB (4mg/ml).
Both gels and glasses were incubated at 37°C for 2h. Only the glasses gave results.
108
Statistical analysis
Statistical analyses were performed using the R v. 2.15.1 software (R Development Core Team 2011). The presence of a statistically significant difference in values of mg/ml melanin produced regarding to phenoloxidase activity and molar of hydrogen peroxide produced concerning to the glucose oxidase activity of the different trials, both among
control and treated/ill ones, was tested using the one-way ANOVA test and Tukey HSD test for post-hoc comparisons. To verify the significance of differences between relative absorbance values of samples, Student t-test was used.