original article
n engl j med 359;21 www.nejm.org november 20, 2008 2220
Clinical Risk Factors, DNA Variants,
and the Development of Type 2 Diabetes
Valeriya Lyssenko, M.D., Anna Jonsson, M.Sc., Peter Almgren, M.Sc., Nicoló Pulizzi, M.D., Bo Isomaa, M.D., Tiinamaija Tuomi, M.D., Göran Berglund, M.D., David Altshuler, M.D., Peter Nilsson, M.D.,
and Leif Groop, M.D.
From the Department of Clinical Sciences, Lund University, Malmö, Sweden (V.L., A.J., P.A., G.B., P.N., L.G.); the University of Pisa, Pisa, Italy (N.P.); the Folkhalsan Research Center (B.I., T.T.) and Helsinki University Central Hospital and the Uni-versity of Helsinki (T.T., L.G.) — all in Helsinki, Finland; and the Program in Med-ical and Population Genetics, Broad Insti-tute of Harvard and MIT, Cambridge, MA, and Massachusetts General Hospital, Bos-ton (D.A.). Address reprint requests to Dr. Lyssenko at the Department of Clini-cal Sciences, Diabetes, and Endocrinology, Lund University, CRC, Malmö University Hospital, 20502 Malmö, Sweden, or at [email protected].
N Engl J Med 2008;359:2220-32.
Copyright © 2008 Massachusetts Medical Society.
Abs tr act Background
Type 2 diabetes mellitus is thought to develop from an interaction between environ-mental and genetic factors. We examined whether clinical or genetic factors or both could predict progression to diabetes in two prospective cohorts.
Methods
We genotyped 16 single-nucleotide polymorphisms (SNPs) and examined clinical factors in 16,061 Swedish and 2770 Finnish subjects. Type 2 diabetes developed in 2201 (11.7%) of these subjects during a median follow-up period of 23.5 years. We also studied the effect of genetic variants on changes in insulin secretion and action over time.
Results
Strong predictors of diabetes were a family history of the disease, an increased body-mass index, elevated liver-enzyme levels, current smoking status, and reduced measures of insulin secretion and action. Variants in 11 genes (TCF7L2, PPARG, FTO,
KCNJ11, NOTCH2, WFS1, CDKAL1, IGF2BP2, SLC30A8, JAZF1, and HHEX) were
signifi-cantly associated with the risk of type 2 diabetes independently of clinical risk fac-tors; variants in 8 of these genes were associated with impaired beta-cell function. The addition of specific genetic information to clinical factors slightly improved the prediction of future diabetes, with a slight increase in the area under the receiver-operating-characteristic curve from 0.74 to 0.75; however, the magnitude of the increase was significant (P = 1.0×10⁻⁴). The discriminative power of genetic risk
fac-tors improved with an increasing duration of follow-up, whereas that of clinical risk factors decreased.
Conclusions
As compared with clinical risk factors alone, common genetic variants associated with the risk of diabetes had a small effect on the ability to predict the future de-velopment of type 2 diabetes. The value of genetic factors increased with an increas-ing duration of follow-up.
The New England Journal of Medicine
Downloaded from nejm.org on June 24, 2012. For personal use only. No other uses without permission. Copyright © 2008 Massachusetts Medical Society. All rights reserved.
T
ype 2 diabetes mellitus is a complex polygenic disorder in which common ge-netic variants interact with environmental factors to unmask the disease. The identification of persons at high risk for the disease may aid in disease prevention. A family history of diabetes, an increase in body-mass index (BMI, the weight in kilograms divided by the square of the height in meters), and impaired insulin secretion and ac-tion are risk factors for type 2 diabetes.1-4 A chal-lenge has been to identify genetic variants that explain the excess risk associated with a family history of diabetes. From a long list of candidate genes, variants in only three have been consistent-ly associated with type 2 diabetes: TCF7L2, KCNJ11, and PPARG.5-7 However, in 2007, a number of novel genetic variants (CDKAL1, IGF2BP2, the locus on chromosome 9 close to CDKN2A/CDKN2B, FTO,HHEX, SLC30A8, and WFS1)8-14 were shown to in-crease susceptibility to type 2 diabetes in repro-ducible studies. Furthermore, a recent meta-analy-sis identified six novel variants (JAZF1, CDC123/
CAMK1D, TSPAN8/LGR5, THADA, ADAMTS9, and NOTCH2) that are associated with type 2
dia-betes.15
We examined subjects in two large Scandina-vian prospective studies with a median follow-up period of 23.5 years to determine whether these genetic variants alone or in combination with clinical risk factors might predict the future de-velopment of type 2 diabetes and whether these variants were associated with changes in insulin secretion or action over time.
Methods Study Populations
We followed two prospective cohorts from the Malmö Preventive Project (MPP) and the Botnia study in Finland, consisting of 18,831 persons, for a median period of 23.5 years (Fig. 1, and the Methods section and Table 1A in the Supplemen-tary Appendix, available with the full text of this article at www.nejm.org). Among these subjects, diabetes developed in 2201 (11.7%) during this period.
Measurements
We measured weight, height, waist and hip cir-cumference, and blood pressure, as reported pre-viously.16 In the MPP cohort at baseline, blood
samples were drawn at 0, 40, and 120 minutes during the 75-g oral glucose-tolerance test for measurements of blood glucose and serum insu-lin, and fasting samples were drawn at a follow-up visit for measurement of plasma glucose and lipids with the use of standard techniques.17 In the Botnia study, blood samples were drawn 10 min-utes before the glucose-tolerance test and then at 0, 30, 60, and 120 minutes. The insulin sensitivity index (ISI) was calculated from the oral glucose-tolerance test according to the formula18:
ISI = 10,000 ÷ √([fasting plasma glucose × fasting plasma insulin] × [mean OGTTglucose × mean OGTTinsulin]), in which OGTT denotes the oral glucose-tolerance test. We calculated the basal insulin resistance in-dex by the homeostasis model assessment (HOMA) levels of fasting insulin and glucose (www.dtu.ox. ac.uk). Beta-cell function was assessed as correct-ed incremental insulin response (CIR) during the glucose-tolerance test according to the formula19:
CIR = (100 × insulin at 30 min or 40 min in MPP) ÷ ([glucose at 30 min or 40 min in MPP] × [glucose at 30 min or 40 min in MPP − 3.89]) or as a disposition index (i.e., insulin secretion ad-justed for insulin sensitivity, or CIR × ISI).20
Plasma glucose was measured by the hexoki-nase method in the MPP cohort and by the glu-cose oxidase method in the Botnia cohort. Plasma insulin was measured with the use of a local radioimmunoassay in the MPP cohort and with the use of enzyme-linked immunosorbent assay (Dako) in the Botnia cohort.16,21
Genotyping
We genotyped 16 SNPs in 16 genes that in re-cent cross-sectional genomewide association stud-ies have shown consistent association with type 2 diabetes: TCF7L2 (rs7903146), KCNJ11 (rs5219),
PPARG (rs1801282), CDKAL1 (rs7754840), IGF2BP2
(rs4402960), CDKN2A/CDKN2B (rs10811661), FTO (rs9939609), HHEX (rs1111875), SLC30A8 (rs13266634), WFS1 (rs10010131), JAZF1 (rs864745), CDC123/CAMK1D (rs12779790), TSPAN8/LGR5 (rs7961581), THADA (rs7578597), ADAMTS9 (rs4607103), and NOTCH2 (rs10923931).5-9,11-15,22
DNA was extracted from whole blood with the use of a Plasmid Maxi Kit (Qiagen). Genotyp-ing was performed with the use of
matrix-assist-n ematrix-assist-ngl j med 359;21 www.matrix-assist-nejm.org matrix-assist-november 20, 2008 2222
39p6 25,677 Eligible patients were
invited to participate 33,346 Patients were screened
at baseline
7010 Died 659 Moved
17,284 Participated in follow-up
16,061 Did not have
diabetes at baseline 942 Had type 2 diabetesat baseline 78 Did not undergoglucose test
12,210 Had normal glucose tolerence
3851 Had impaired fasting glucose level or impaired
glucose toleramce
1251 Had type 2 diabetes
at follow-up 812 Had type 2 diabetesat follow-up
2063 Had type 2 diabetes
203 Did not undergo DNA test
2770 Patients did not have diabetes at baseline
2094 Had normal glucose tolerance
676 Had impaired fasting glucose level or impaired
glucose tolerance
55 Had type 2 diabetes at follow-up
83 Had type 2 diabetes at follow-up
138 Had type 2 diabetes
AUTHOR: FIGURE: : E U S S I : B O J 4-C H/T RETAKE SIZE ICM CASE EMail Line H/T Combo Revised
AUTHOR, PLEASE NOTE: Figure has been redrawn and type has been reset.
Please check carefully.
REG F Enon 1st 2nd 3rd Lyssenko 1 of 4 11-20-08 ARTIST: ts 35921 A B
Malmö Preventive Project
Botnia Prospective Study
The New England Journal of Medicine
Downloaded from nejm.org on June 24, 2012. For personal use only. No other uses without permission. Copyright © 2008 Massachusetts Medical Society. All rights reserved.
ed laser desorption–ionization time-of-flight mass spectrometry on the MassARRAY platform (Sequenom)23 for rs7903146, rs1801282, rs5219, rs7754840, and rs10811661; with an allelic dis-crimination assay-by-design method on ABI 7900 (Applied Biosystems) for rs4402960, rs9939609, rs10010131, rs1111875, rs864745, rs12779790, rs7961581, rs7578597, rs4607103, and rs10923931; and with an allele-specific assay (KASPar, KBio-science) for rs13266634. We obtained an average genotyping success rate of more than 95% and an average genotyping accuracy of more than 98% by regenotyping 11% of the samples using the Sequenom platform. All SNPs were in Hardy– Weinberg equilibrium (P>0.001), with the excep-tion of rs864745 in the JAZF1 gene (P = 0.001). Genotyping errors are an unlikely explanation for this finding, since in the genotyping of 2416 samples (15%) of rs864745 with the use of two different methods (allelic discrimination on ABI7900 and Sequenom), the concordance rate was 98.7%.
Statistical Analysis
We investigated the predictive ability of clinical factors and the specific polymorphisms that we had genotyped as risk factors for future type 2 dia-betes using logistic-regression analysis applied to the following models: first, a model using uni-variate clinical risk factors (with adjustment for age and sex); second, a model using personal fac-tors (age, sex, family history of diabetes, and BMI) and clinical factors (age, sex, family history of diabetes, BMI, and levels of blood pressure, triglyc-erides, and fasting plasma glucose), as used by Wilson et al. in the Framingham Offspring Study4; third, a clinical model in which we re-placed the clinical variables suggested by Wilson et al. by measures of insulin secretion; and fourth, a clinical model with the polymorphic
gene variants. Since men and women were includ-ed at different times, we adjustinclud-ed for this factor using the participation period (coded 0 or 1), sex, and an interaction term (participation period × sex, which was coded 0 or 1) as covariates in the analyses.
Improvement in area under the receiver-oper-ating-characteristic (ROC) curves (also referred to as C statistics) was assessed after adding the genetic data to the clinical model.24 To confirm that the addition of genetic data to clinical models improved risk prediction, we tested the ability of the combined clinical and genetic model to re-classify subjects into predefined risk categories on the basis of the percentage likelihood of type 2 diabetes developing (<10%, 10 to 20%, and >20%), using the net-reclassification-improvement ap-proach.25 Since this method requires predefined risk categories, we also used another approach, without this requirement (i.e., the integrated-discrimination-improvement method).25
For the first analysis of the effects of the polymorphic DNA variants, we used additive genetic models. In addition, we tested dominant and recessive alternative models for the best fit (http://pngu.mgh.harvard.edu/~purcell). Multivari-ate linear regression analyses were used to test correlations between genotype and phenotype.26 Non-normally distributed variables were log-transformed before analysis. The effect size of a genetic or clinical risk factor on the risk of type 2 diabetes was calculated from multivariate re-gression analysis, with adjustment for age and sex, with the use of Nagelkerke R square. We estimated the predictive value of a combination of risk alleles (each person could have 0, 1, or 2 of them, for a total of 22) in 11 genes, which sig-nificantly predicted the risk of diabetes by defin-ing subjects with more than 12 risk alleles (about 20%) as being at high risk and those with fewer than 8 risk alleles (about 20%) as being at low risk. All statistical analyses were performed with the use of SPSS software, version 14.0; PLINK (http://pngu.mgh.harvard.edu/~purcell/plink); and Stata software.
R esults Incidence of Diabetes
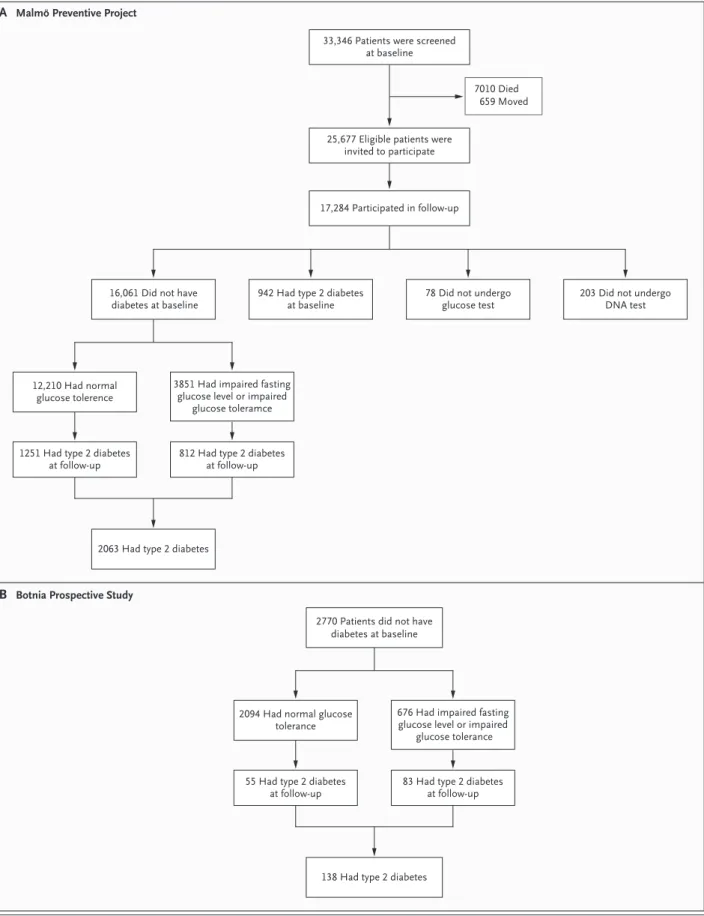
In the MPP study, diabetes developed in 2063 sub-jects (12.8%) during a median follow-up period Figure 1 (facing page). Design of the Malmö and Botnia
Studies.
Panel A shows an outline of the data collection in the Malmö Preventive Project, in which 16,061 subjects without diabetes were initially eligible for the study of the prediction of future diabetes; type 2 diabetes devel-oped in 2063 (12.8%) of these subjects. Panel B shows the progression to diabetes in the Botnia Prospective Study, which included 2770 family members and spous-es without diabetspous-es; type 2 diabetspous-es developed in 138 (5.0%) of these subjects.
n engl j med 359;21 www.nejm.org november 20, 2008 2224
Table 1. Baseline Clinical Factors Predicting Type 2 Diabetes in the Malmö and Botnia Prospective Studies.*
Variable Malmö Botnia
Odds Ratio (95% CI) P Value Odds Ratio (95% CI) P Value
Univariate regression analysis
Age, per SD 1.13 (1.07–1.20) 2.9×10⁻⁵ 1.87 (1.54–2.27) 2.9×10⁻⁶
First-degree family history of diabetes 1.67 (1.46–1.91) 1.0×10⁻¹³ 2.13 (1.22–3.71) 0.008
Current smoking 1.30 (1.18–1.43) 6.5×10⁻⁸ 1.20 (0.76–1.89) 0.43
Impaired fasting glucose level 2.58 (2.29–2.91) 5.6×10−53 3.84 (2.22–6.64) 2.0×10⁻⁶
Impaired glucose tolerance 1.91 (1.61–2.26) 1.7×10⁻¹⁴ 3.67 (2.27–5.93) 1.8×10⁻⁸
Both impaired fasting glucose level
and impaired glucose tolerance 5.37 (4.26–6.78) 5.9×10
−47 7.77 (4.48–13.46) 1.9×10⁻¹⁵
Increased body-mass index, per 1 SD 1.84 (1.76–1.93) 2.1×10−153 1.84 (1.57–2.16) 5.0×10⁻¹³
Increased waist circumference, per 1 SD NA NA 2.23 (1.85–2.67) 2.9×10⁻¹⁷
Increased blood pressure, per 1 SD
Systolic 1.34 (1.28–1.41) 2.6×10−37 1.56 (1.31–1.85) 9.8×10⁻⁷
Diastolic 1.39 (1.33–1.46) 3.9×10−44 1.52 (1.27–1.83) 2.2×10⁻⁵
Increased triglycerides, per 1 SD 1.70 (1.62–1.78) 9.8×10−101 1.53 (1.28–1.82) 8.1×10⁻⁶
Increased γ-glutamyltransferase, per 1 SD 1.53 (1.46–1.60) 8.4×10−72 1.44 (1.21–1.71) 3.8×10⁻⁵
Increased aspartate aminotransferase, per 1 SD 1.28 (1.22–1.35) 2.2×10⁻²⁴ 0.99 (0.83–1.20) 0.98
Increased alanine aminotransferase, per 1 SD 1.64 (1.56–1.72) 9.1×10−86 NA NA
Increased apolipoprotein A-I, per 1 SD 0.79 (0.73–0.86) 2.6×10⁻⁸ 0.75 (0.62–0.91) 0.002
Increased insulin sensitivity index, per 1 SD 0.59 (0.53–0.65) 1.2×10⁻²² 0.43 (0.36–0.52) 1.2×10⁻¹⁷
Increased insulin resistance index, per 1 SD 1.47 (1.33–1.62) 2.4×10⁻¹⁴ 2.02 (1.70–2.39) 5.3×10⁻¹²
Decreased corrected insulin response, per 1 SD 1.26 (1.10–1.44) 7.1×10⁻⁴ 1.48 (1.21–1.82) 3.3×10⁻⁴
Decreased disposition index, per 1 SD 2.12 (1.82–2.47) 6.7×10⁻²² 3.40 (2.66–4.34) 2.5×10⁻²¹
Multivariate regression analysis†
Age, per SD 0.92 (0.83–1.009) 0.08 1.52 (1.20–1.91) 2.9×10⁻⁴
Male sex 0.88 (0.67–1.12) 0.29 NA NA
Time period for participation in study 0.72 (0.55–0.95) 0.02 NA NA
Time period for either men or women 1.76 (1.29–2.41) 6.3×10⁻⁴ NA NA
First-degree family history of diabetes 1.62 (1.38–1.89) 2.0×10⁻¹⁰ NA NA
Current smoking 1.43 (1.25–1.63) 1.4×10⁻⁹ NA NA
Increased body-mass index, per 1 SD 1.45 (1.37–1.55) 4.5×10−36 1.43 (1.20–1.72) 0.002
Increased fasting plasma glucose, per 1 SD 1.54 (1.43–1.65) 1.7×10⁻³⁴ NA NA
Increased diastolic blood pressure, per 1 SD 1.15 (1.07–1.22) 8.6×10⁻⁶ NA NA
Increased triglycerides, per 1 SD 1.26 (1.18–1.35) 4.8×10⁻¹³ NA NA
Increased γ-glutamyltransferase, per 1 SD 1.12 (1.04–1.21) 0.002 NA NA
Increased aspartate aminotransferase, per 1 SD 0.90 (0.83–0.98) 0.01 NA NA
Increased alanine aminotransferase, per 1 SD 1.37 (1.25–1.50) 2.4×10⁻¹¹ NA NA
Increased apolipoprotein A-I, per 1 SD‡ NA NA 0.76 (0.62–0.92) 0.006
Decreased disposition index, per 1 SD§ NA NA 3.04 (2.34–3.96) 5.1×10⁻¹⁴
* CI denotes confidence interval, and NA not applicable.
† Missing values from the Botnia study were not part of the multivariate regression analysis because they were not significant.
‡ Values for apolipoprotein A-I from the Malmö study were not calculated in the multivariate regression analysis because they were not significant. § The disposition index in the Malmö study was not part of the multivariate regression analysis because of the limited data that were available
(see Table 1 in the Supplementary Appendix).
The New England Journal of Medicine
Downloaded from nejm.org on June 24, 2012. For personal use only. No other uses without permission. Copyright © 2008 Massachusetts Medical Society. All rights reserved.
of 24.8 years, with the highest conversion rate (21.1%) in those with impaired fasting glucose levels or impaired glucose tolerance at baseline (Fig. 1A). Impaired fasting glucose levels devel-oped in 1400 of 10,933 subjects with normal
glu-cose tolerance at baseline (12.8%). In the Botnia study, diabetes developed during the follow-up period in 138 of all 2770 subjects (5.0%) and in 83 (12.3%) of those with impaired fasting glucose levels or impaired glucose tolerance at baseline
33p9 30 Incidence of Diabetes (%) 20 25 15 10 5 0 Q1 Q2 Q3 Q4 Body-Mass Index
A Family History and Body-Mass Index
AUTHOR: FIGURE: JOB: 4-C H/T RETAKE SIZE ICM CASE EMail Line H/T Combo Revised
AUTHOR, PLEASE NOTE: Figure has been redrawn and type has been reset.
Please check carefully.
REG F Enon 1st 2nd 3rd Lyssenko 2 of 4 11-20-08 ARTIST: ts 35921 ISSUE: 40 Incidence of Diabetes (%) 20 30 10 0 High Low Insulin Secretion Q1 Q2 Q3 Q4 Body-Mass Index High Low Insulin Secretion
B Family History and Insulin Secretion
No Yes
First-Degree Family History of Diabetes
No Yes
First-Degree Family History of Diabetes
35 30 Incidence of Diabetes (%) 20 25 15 10 5 0
C Risk Alleles and Body-Mass Index
≤8 No. of Risk Alleles9 10 11 ≥12 ≤8 No. of Risk Alleles9 10 11 ≥12 40 Incidence of Diabetes (%) 20 30 10 0
D Risk Alleles and Insulin Secretion
Figure 2. Nongenetic and Genetic Risk Factors for Type 2 Diabetes in the Malmö Study.
Panel A shows the incidence of type 2 diabetes in four quartiles (Q) of body-mass index (BMI) among Malmö subjects who had a family history of diabetes and those without such a history. An increase in the quartile of the BMI gradu-ally increased the risk of diabetes, as compared with the lowest quartile, with an odds ratio of 1.50 for the second
quartile (95% confidence interval [CI], 1.26 to 1.78; P = 6.7×10⁻⁶), of 2.36 for the third quartile (95% CI, 2.00 to 2.78;
P = 1.5×10⁻²⁴), and of 4.96 for the fourth quartile (95% CI, 4.25 to 5.79; P = 1.1×10−90). Panel B shows the incidence
of type 2 diabetes in relation to insulin secretion (disposition index) among subjects with a family history of diabe-tes and those without such a history. Subjects with a disposition index below the median of 23,393 (26.1% of high-risk subjects and 9.4% of low-high-risk subjects) had an increase in the high-risk of type 2 diabetes by a factor of 3.23 (95% CI,
2.41 to 4.34; P = 5.8×10⁻¹⁵), as compared with those above the median. A family history of diabetes significantly
in-creased the risk of diabetes in subjects with impaired insulin secretion (35.5% vs. 9.9%), with an odds ratio of 4.86
(3.12 to 7.56, P = 2.3×10⁻¹²). Panel C shows the incidence of type 2 diabetes in carriers of an increasing number of
risk alleles in 11 genes, which individually predicted future risk of type 2 diabetes, in relation to quartiles of BMI. There was a stepwise increase in diabetes risk with an increasing number of risk alleles and increasing quartiles of BMI so that participants carrying more than 12 risk alleles showed a doubling of the risk conferred by BMI alone. In the
high-est quartile of BMI (31.8% vs. 5.1%), this yielded an odds ratio of 8.0 (95% CI, 5.71 to 11.19; P = 9.1×10⁻³⁴). Panel D
shows the incidence of type 2 diabetes in carriers of an increasing number of risk alleles in the 11 genes, which in-dividually predicted future risk of type 2 diabetes, in relation to low insulin secretion. Carriers of more than 12 risk
n engl j med 359;21 www.nejm.org november 20, 2008 2226 Table 2. Genetic Factors Predicting Type 2 Diabetes in the Malmö and Botnia Studies.* Chromo- some Gene SNP Risk Allele Malmö Botnia P Value for Heterogeneity† RA AFF No. of Subjects Primary Model Alternative Model RA AFF No. of Subjects Primary Model Alternative Model odds ratio (95% CI) P value odds ratio (95% CI) P value odds ratio (95% CI) P value odds ratio (95% CI) P value 10 TCF7L2 rs7903146 T 0.31 15815 1.30 (1.21–1.40) 9.5×10 −13 Dominant 1.42 (1.29–1.55) 5.0×10 −13 0.25 2645 1.52 (1.14–2.04) 0.003 Dominant 1.53 (1.07–2.21) 0.02 0.33 3 PPARG rs1801282 C 0.88 15993 1.20 (1.08–1.32) 4.0×10 −4 NA NA 0.90 2544 1.45 (0.96–2.20) 0.08 NA NA 0.30 16 FTO rs9939609 A 0.44 15931 1.14 (1.07–1.22) 9.2×10 −5 Recessive 1.26 (1.12–1.42) 1.3×10 −4 0.42 2464 1.04 (0.80–1.36) 0.77 Recessive 1.14 (0.71–1.85) 0.58 0.58 11 KCNJ11 rs5219 T 0.41 15600 1.13 (1.06–1.21) 3.6×10 −4 NA NA 0.51 2635 0.98 (0.75–1.26) 0.85 NA NA 0.31 1 NOTCH2 rs10923931 T 0.11 15589 1.13 (1.02–1.26) 0.02 NA NA 0.11 2642 1.15 (0.77–1.73) 0.45 NA NA 0.17 4 WFS1 rs10010131 G 0.59 15944 1.12 (1.04–1.19) 0.001 Recessive 1.17 (1.07–1.30) 0.001 0.52 2631 0.79 (0.61–1.01) 0.08 Recessive 0.84 (0.56–1.26) 0.40 0.01 6 CDKAL1 rs7754840 C 0.33 15487 1.11 (1.03–1.19) 0.004 Recessive 1.24 (1.07–1.44) 0.004 0.34 2495 1.05 (0.80–1.37) 0.74 Recessive 1.15 (0.65–2.01) 0.63 0.87 3 IGF2BP2 rs4402960 A 0.32 15157 1.10 (1.03–1.18) 0.008 Recessive 1.23 (1.06–1.44) 0.008 0.27 2500 0.92 (0.69–1.24) 0.59 Recessive 0.78 (0.36–1.71) 0.53 0.30 8 SLC30A8 rs13266634 C 0.70 15931 1.10 (1.03–1.18) 0.008 NA NA 0.57 2497 0.85 (0.66–1.10) 0.21 NA NA 0.04 7 JAZF1 rs864745 A 0.53 15944 1.08 (1.01–1.15) 0.03 NA NA 0.49 2639 0.99 (0.77–1.28) 0.95 NA NA 0.63 10 HHEX rs1111875 G 0.60 15942 1.07 (1.00–1.15) 0.03 NA NA 0.56 2597 0.99 (0.76–1.29) 0.92 NA NA 0.83 2 THADA rs7578597 T 0.90 15620 1.11 (0.99–1.24) 0.07 NA NA 0.96 2658 1.29 (0.69–2.39) 0.42 NA NA 0.48
The New England Journal of Medicine
Downloaded from nejm.org on June 24, 2012. For personal use only. No other uses without permission. Copyright © 2008 Massachusetts Medical Society. All rights reserved.
(Fig. 1B), whereas impaired fasting glucose or impaired glucose tolerance developed in 313 of 2039 subjects (15.4%).
Clinical Factors Predicting Incidence of Diabetes
In both the MPP and Botnia studies, a family his-tory of diabetes, an increased BMI, and increased levels of blood pressure and serum levels of tri-glycerides, apolipoprotein A-I, and liver enzymes were independent predictors of future type 2 dia-betes (Table 1). In the MPP study, current smok-ing was also associated with a marked increase in the risk of diabetes. Impaired insulin secretion and action, particularly insulin secretion adjusted for insulin resistance (disposition index), were strong predictors of future diabetes. The presence of a first-degree family history of diabetes dou-bled the risk of the disease that was seen with an increased BMI (Fig. 2A) and a low disposition in-dex (Fig. 2B).
We also constructed models for personal fac-tors (age, sex, a family history of diabetes, and body-mass index) and clinical factors (age, sex, a family history of diabetes, BMI, blood pressure, triglycerides, and fasting plasma glucose) for the risk of type 2 diabetes, as described by Wilson et al.4 The area under the ROC curve (AUC) for the clinical models was similar in the MPP study (0.74) and the Botnia study (0.79) but was lower than in the Framingham Offspring Study (0.88) (Table 4 in the Supplementary Appendix). The ad-dition of measures of insulin secretion to the clinical model4 significantly improved values in the AUC in both studies (P<0.01).
Predictive Effect of Genotyped DNA Variants
Type 2 Diabetes
Common variants in 11 genes were significant-ly associated with the risk of future type 2 dia-betes in the MPP cohort, including TCF7L2 (odds ratio, 1.30; P = 9.5×10⁻¹³), PPARG (odds ratio, 1.20; P = 4.0×10⁻⁴), FTO (odds ratio, 1.14; P = 9.2×10⁻⁵), KCNJ11 (odds ratio, 1.13; P = 3.6×10⁻⁴), NOTCH2 (odds ratio, 1.13; P = 0.02), WFS1 (odds ratio, 1.12; P = 0.001), CDKAL1 (odds ratio, 1.11; P = 0.004),
IGF2BP2 (odds ratio, 1.10; P = 0.008), SLC30A8 (odds
ratio, 1.10; P = 0.008), JAZF1 (odds ratio, 1.08; P = 0.03), and HHEX (odds ratio, 1.07; P = 0.03) (Table 2). Although these findings could not be fully replicated in the smaller Botnia study, there was little heterogeneity between the studies with
9 CDKN2A/ CDKN2B rs10811661 T 0.85 15132 1.09 (0.99–1.19) 0.07 NA NA 0.82 2475 0.84 (0.60–1.17) 0.29 NA NA 0.18 12 TSPAN8/ LGR5 rs7961581 G 0.27 15594 1.04 (0.96–1.12) 0.30 NA NA 0.26 2656 1.09 (0.83–1.43) 0.55 NA NA 0.59 3 ADAMTS9 rs4607103 C 0.77 15729 1.04 (0.96–1.13) 0.34 NA NA 0.81 2640 1.23 (0.88–1.73) 0.22 NA NA 0.27 10 CDC123/ CAMK1D rs12779790 G 0.19 15547 1.02 (0.93–1.11) 0.70 NA NA 0.22 2642 1.03 (0.76–1.39) 0.87 NA NA 0.94 * The odds ratios for the risk of type 2 diabetes were calculated with the use of univariate logistic-regression analyses with adjustment for age at participation and sex. The primary genet -ic models are additive; alternative models are indicated. CI denotes confidence interval, NA not applicable, and RA AFF frequency of the risk allele in affected subjects. † The test for heterogeneity (interaction) indicates whether the results varied significantly between the Malmö and Botnia studies.
n engl j med 359;21 www.nejm.org november 20, 2008 2228
respect to the risk conferred by different geno-types.
We also studied whether these variants would predict conversion from normal glucose tolerance and from impaired fasting glucose levels or im-paired glucose tolerance to type 2 diabetes in different ways. Variants in most genes predicted progression from normal glucose tolerance to type 2 diabetes, including TCF7L2 (odds ratio, 1.27; P = 2.7×10⁻⁷), PPARG (odds ratio, 1.15; P = 0.03), FTO (odds ratio, 1.16; P = 7.2×10⁻⁴), KCNJ11 (odds ratio, 1.11; P = 0.01), WFS1 (odds ratio, 1.13; P = 0.004), CDKAL1 (odds ratio, 1.21; P = 0.05),
IGF2BP2 (odds ratio, 1.12; P = 0.01), and SLC30A8
(odds ratio, 1.11; P = 0.02), whereas four variants predicted transition from impaired fasting glu-cose levels or impaired gluglu-cose tolerance to type 2 diabetes, including TCF7L2 (odds ratio, 1.30; P = 2.7×10⁻⁵), PPARG (odds ratio, 1.29; P = 0.004), KCNJ11 (odds ratio, 1.15; P = 0.02), and FTO (odds
ratio, 1.13; P = 0.03) (Table 3 in the Supplementary Appendix).
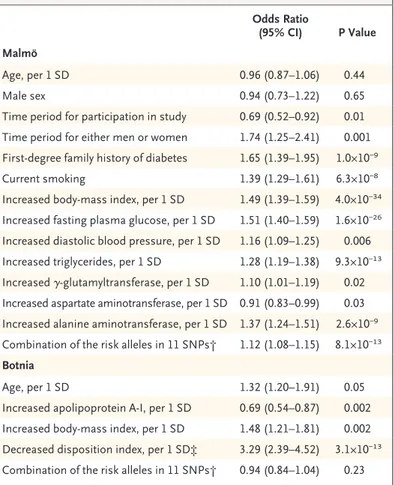
On the basis of the frequency distribution of risk alleles, we defined a low genetic risk group and a high genetic risk group as the quintile with the lowest (≤8) and the highest (≥12) number of risk alleles, respectively (Fig. 1 in the Supple-mentary Appendix). As expected, more subjects who were diagnosed with diabetes than those without the diagnosis had a high genetic risk (32.0% vs. 22.1%), which translated into an in-crease in the risk of future diabetes by a factor of 1.95 (95% confidence interval [CI], 1.69 to 2.25; P = 2.5×10⁻²⁰). In addition, in the multivariate re-gression analysis, the inclusion of the genotyped DNA variants provided information that was in-dependent of clinical risk factors, showing in the Malmö cohort an increase in the risk of type 2 diabetes by a factor of 1.12 per single copy of the risk allele (P = 8.1×10⁻¹³) (Table 3).
Change in Body-Mass Index and Insulin Secretion and Action
We examined the effect of the genotyped DNA variants on changes in the BMI and insulin se-cretion (disposition index) and action over time in 2444 subjects from the Botnia study who did not have diabetes. At baseline, carriers of risk genotypes in the IGF2BP2 and SLC30A8 genes and at the CDKN2A/CDKN2B locus had a lower disposi-tion index, which was maintained unchanged throughout the 8-year observation period (P<0.05) (Fig. 3H, 3I, and 3M in the Supplementary Ap-pendix).
The presence of variants in the FTO, JAZF1, and ADAMTS9 genes was associated with changes in the BMI, as compared with the absence of these variants; the BMI was higher in carriers of the FTO risk allele by 0.24 (P<0.0001) and lower in carriers of risk genotypes in JAZF1 and ADAMTS9 by 0.10 (P = 0.003) and 0.13 (P = 0.004), respec-tively (Fig. 3 in the Supplementary Appendix).
In addition, we evaluated changes in insulin secretion and action and BMI over time in carriers of a low and high gene score in the Botnia study Table 3. Combination of Baseline Clinical and Genetic Factors Predicting
Type 2 Diabetes in the Malmö and Botnia Studies.*
Odds Ratio
(95% CI) P Value Malmö
Age, per 1 SD 0.96 (0.87 –1.06) 0.44
Male sex 0.94 (0.73–1.22) 0.65
Time period for participation in study 0.69 (0.52–0.92) 0.01
Time period for either men or women 1.74 (1.25–2.41) 0.001
First-degree family history of diabetes 1.65 (1.39–1.95) 1.0×10⁻⁹
Current smoking 1.39 (1.29–1.61) 6.3×10⁻⁸
Increased body-mass index, per 1 SD 1.49 (1.39–1.59) 4.0×10⁻³⁴
Increased fasting plasma glucose, per 1 SD 1.51 (1.40–1.59) 1.6×10⁻²⁶
Increased diastolic blood pressure, per 1 SD 1.16 (1.09–1.25) 0.006
Increased triglycerides, per 1 SD 1.28 (1.19–1.38) 9.3×10⁻¹³
Increased γ-glutamyltransferase, per 1 SD 1.10 (1.01–1.19) 0.02
Increased aspartate aminotransferase, per 1 SD 0.91 (0.83–0.99) 0.03
Increased alanine aminotransferase, per 1 SD 1.37 (1.24–1.51) 2.6×10⁻⁹
Combination of the risk alleles in 11 SNPs† 1.12 (1.08–1.15) 8.1×10⁻¹³
Botnia
Age, per 1 SD 1.32 (1.20–1.91) 0.05
Increased apolipoprotein A-I, per 1 SD 0.69 (0.54–0.87) 0.002
Increased body-mass index, per 1 SD 1.48 (1.21–1.81) 0.002
Decreased disposition index, per 1 SD‡ 3.29 (2.39–4.52) 3.1×10⁻¹³
Combination of the risk alleles in 11 SNPs† 0.94 (0.84–1.04) 0.23
* The odds ratios for the risk of type 2 diabetes were calculated with the use of
multivariate logistic regression analyses with adjustment for age at participation and sex. CI denotes confidence interval.
† The combination of the risk alleles in 11 SNPs was calculated as sum of the risk alleles (coded as 0, 1, or 2).
‡ The disposition index was not part of the multivariate regression analysis in the Malmö study because limited data were available (see Table 1 in the Sup-plementary Appendix).
The New England Journal of Medicine
Downloaded from nejm.org on June 24, 2012. For personal use only. No other uses without permission. Copyright © 2008 Massachusetts Medical Society. All rights reserved.
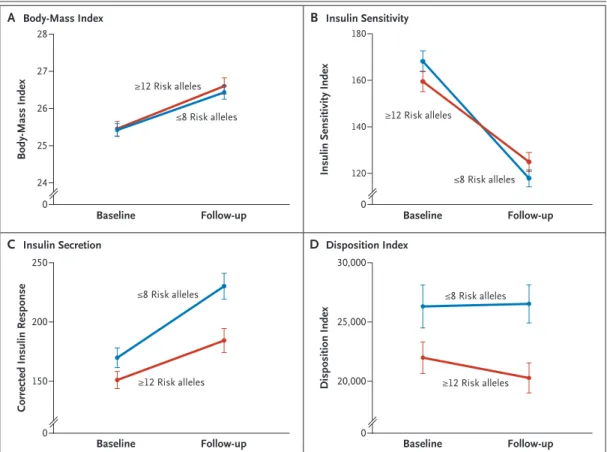
(Fig. 3). An increase in the BMI and a concomi-tant decrease in insulin sensitivity during the 8-year period were consistent findings, with no differences between subjects at high and low genetic risk (Fig. 3A and 3B). However, subjects with a high genetic risk did not increase their insulin secretion (disposition index) to compen-sate for the increase in insulin resistance as effi-ciently as did those with a low genetic risk (Fig. 3C and 3D).
Combined Effect of Clinical and Genetic Risk Factors We also evaluated whether genetic risk factors would further increase the risk imposed by an increase in the BMI or a decrease in the
disposi-tion index. There was a stepwise increase in dia-betes risk with an increasing number of risk alleles and increasing quartiles of BMI (Fig. 2C) or a disposition index above or below the median. Therefore, carriers of more than 12 risk alleles who were in the highest quartile of BMI (263 of 826 subjects vs. 45 of 874 subjects) or who had a low disposition index (58 of 153 subjects vs. 17 of 168 subjects) had an odds ratio for type 2 diabetes of 8.0 (95% CI, 5.71 to 11.19; P = 9.1×10⁻³⁴) and 5.8 (95% CI, 3.18 to 10.61, P = 1.1×10⁻⁸), respec-tively (Fig. 2D).
The C statistics of the AUC had minimal yet significant improvement after the addition of data from the genotyped DNA variants to the clinical
33p9 28 Body-Mass Index 26 27 25 24 0
Baseline Follow-up Baseline Follow-up
Baseline Follow-up Baseline Follow-up
A Body-Mass Index AUTHOR: FIGURE: JOB: 4-C H/T RETAKE SIZE ICM CASE EMail Line H/T Combo Revised
AUTHOR, PLEASE NOTE: Figure has been redrawn and type has been reset.
Please check carefully.
REG F Enon 1st 2nd 3rd Lyssenko 3 of 4 11-20-08 ARTIST: ts 35921 ISSUE: 180
Insulin Sensitivity Index
140 160 120 0 B Insulin Sensitivity 250
Corrected Insulin Response
200 150 0 C Insulin Secretion 30,000 Disposition Index 25,000 20,000 0 D Disposition Index ≤8 Risk alleles ≥12 Risk alleles ≤8 Risk alleles ≥12 Risk alleles ≤8 Risk alleles ≥12 Risk alleles ≤8 Risk alleles ≥12 Risk alleles
Figure 3. Effect of a Combination of Risk Alleles on Changes in Insulin Secretion and Sensitivity in the Botnia Prospective Study.
Changes in diabetes-related phenotypes over time are shown for the 380 subjects in the Botnia study who were at high genetic risk for diabetes (≥12 risk alleles) (red) and for 471 of subjects who were at low risk (≤8 risk alleles) (blue). Panel A shows similar increases in the BMI in subjects at high and low genetic risk. Panel B shows a similar worsening of insulin sensitivity in the two groups. Panel C shows an increase in corrected insulin response over time, an increase that was greater in subjects at low risk than in those at high risk. Panel D shows a decrease in beta-cell function (disposition index) in subjects at high risk, as compared with those at low risk. Among subjects at low risk, the disposition index increased slightly to compensate for an increase in insulin resistance. The I bars denote standard errors.
n engl j med 359;21 www.nejm.org november 20, 2008 2230
model (from 0.74 to 0.75, P = 1.0×10⁻⁴) (Table 4 in the Supplementary Appendix). Since C statis-tics could be considered an insensitive method to identify improvement in prediction, we also re-classified subjects into three risk categories (0 to ≤10%, >10 to ≤20%, and >20%) using the net-reclassification-improvement method (Table 5 in the Supplementary Appendix). By adding genetic factors to clinical factors, we could reclassify 9% of the MPP subjects (P = 2.5×10⁻⁵) and 20% of the Botnia subjects (P = 0.05) to a higher risk cat-egory. Also, the use of the integrated-discrimina-tion-improvement method, which did not require predefined risk categories, significantly improved the prediction of future diabetes in both the MPP subjects (P = 3.7×10⁻¹⁴) and the Botnia subjects (P = 0.001).
An important factor defining the discrimina-tive power of clinical risk factors and DNA vari-ants is the duration of follow-up. To address this issue, we defined the AUC for clinical and ge-netic risk factors in quintiles of time of follow-up. We observed a decrease in the AUC for the clinical model and an increase in the AUC for the genetic risk score (P = 0.01 for both comparisons) with increasing duration of follow-up (Fig. 4, and Table 6 in the Supplementary Appendix).
Discussion
Our study provides insight into the relative im-portance of clinical risk factors and those that are related to a panel of DNA variants associated with type 2 diabetes. Obesity was a strong risk factor for future diabetes, a risk that almost dou-bled in subjects with a family history of diabetes. However, the addition of data from genotyping of the known DNA variants to clinical risk factors (including a family history of diabetes) had a minimal, albeit statistically significant, effect on the prediction of future type 2 diabetes. Notably, the ability of genetic risk factors to predict fu-ture type 2 diabetes improved with an increasing duration of follow-up, suggesting that assessment of genetic risk factors is clinically more mean-ingful the earlier in life they are measured.
Although subjects in the prediabetic stage showed many features of insulin resistance, beta-cell function that was adjusted for insulin resis-tance (disposition index) was the strongest pre-dictor of future diabetes. The addition of measures of insulin secretion to the clinical model, which included mostly components of the metabolic syndrome, further improved the discriminatory power of the ROC curve, from 0.70 to 0.74 in the
36p6 1.00 Sensitivity 0.50 0.75 0.25 0.00 0.00 0.25 0.50 0.75 1.00 Follow-up quintile 1 Follow-up quintile 5 1−Specificity A Genetic Factors AUTHOR: FIGURE: JOB: 4-C H/T RETAKE SIZE ICM CASE EMail Line H/T Combo Revised
AUTHOR, PLEASE NOTE: Figure has been redrawn and type has been reset.
Please check carefully.
REG F Enon 1st 2nd 3rd Lyssenko 4 of 4 11-20-08 ARTIST: ts 35921 ISSUE: 1.00 Sensitivity 0.50 0.75 0.25 0.00 0.00 0.25 0.50 0.75 1.00 Follow-up quintile 1 Follow-up quintile 5 1−Specificity B Clinical Factors
Figure 4. Area under the ROC Curve (C Statistic) for Clinical and Genetic Models Predicting Type 2 Diabetes, According to the Duration of Follow-up.
The effect of genetic risk factors increases with the duration of follow-up, with an area under the ROC curve (AUC) of 0.56 in quintile 1 (blue) and 0.62 in quintile 5 (red) (P = 0.01) (Panel A), whereas the effect of clinical risk factors decreased with the duration of follow-up, with an AUC of 0.75 in quintile 1 and 0.67 in quintile 5 (P = 0.01) (Panel B). The black line indicates reference values.
The New England Journal of Medicine
Downloaded from nejm.org on June 24, 2012. For personal use only. No other uses without permission. Copyright © 2008 Massachusetts Medical Society. All rights reserved.
MPP subjects (P = 0.001) and from 0.79 to 0.83 in the Botnia subjects (P = 0.006).
Of the 16 loci that have been associated with type 2 diabetes previously,8-15 we showed that 11 — TCF7L2, PPARG, FTO, KCNJ11, NOTCH2, WFS1,
CDKAL1, IGF2BP2, SLC30A8, JAZF1, and HHEX —
were associated with an enhanced risk of future diabetes. Many of the variants that we genotyped appear to influence beta-cell function, possibly through effects on proliferation, regeneration, and apoptosis. There was a time-dependent in-crease in the BMI and a dein-crease in insulin sen-sitivity in the subjects from the Botnia study, an increase in insulin resistance that was reflected by an increase in insulin secretion. However, this increase was inadequate to compensate for the increase in insulin resistance in carriers with a high genetic risk, which resulted in a markedly impaired disposition index. Only variants in FTO were associated with an increased BMI. Both FTO and PPARG together with TCF7L2 and KCNJ11 pre-dicted transition from impaired fasting glucose levels or impaired glucose tolerance to manifest diabetes, which suggests that a combination of increased obesity and insulin resistance with a deterioration in beta-cell function contribute to the manifestation of diabetes in these subjects. Collectively, our findings emphasize the critical role of inherited defects in beta-cell function for the development of type 2 diabetes.
Given the large number of subjects with a long follow-up, we were in a position to determine whether the addition of genotyping data at known loci associated with diabetes to clinical risk fac-tors could improve the ability of models to pre-dict future diabetes. To this end, we confirmed that clinical risk factors were good predictors of future diabetes. However, our AUC values for the MPP subjects (0.74) and for the Botnia subjects (0.79) were lower than the value reported in the Framingham Offspring Study (0.88).4 The ap-plication of the coefficients that were derived from the Framingham study to our populations decreased the values of the AUC (0.60 for the MPP subjects and 0.75 for the Botnia subjects), which suggests that different clinical variables have different discriminatory value in different studies.27
The addition of DNA data to the clinical model improved not only the discriminatory power, as assessed by ROC curves, but also the reclassifica-tion of the subjects into different risk strategies, with the use of net-reclassification-improvement
and integrated-discrimination-improvement ap-proaches. However, the discriminatory power of genes alone was relatively low (0.62) but in keep-ing with findkeep-ings from two previous studies.28,29 In contrast, one recent case–control study showed a very high value for the AUC of 0.86 for 15 novel gene loci.30 The most likely explanation is that in this study, subjects with diabetes were compared with those who maintained complete-ly normal glucose tolerance. If we were to restrict our analysis of subjects without diabetes to those with normal glucose tolerance, the value for the AUC would increase to 0.82. These data thus emphasize the need for population-based stud-ies for assessment of diabetes risk.
One of the strengths of our study was its pro-spective nature. Cross-sectional studies often in-clude case subjects and control subjects who were ascertained in different ways, thereby limiting their predictive value. Prospective studies have the advantage that all subjects have been ascertained and followed up in the same way. One caveat was that in the MPP study, men and women were included at different times. However, we adjust-ed for this variable using the participation period and sex as covariates in the analyses.
In conclusion, the inclusion of common ge-netic variants that are associated with type 2 diabetes very slightly improved the prediction of future type 2 diabetes, as compared with the inclusion of clinical risk factors alone. Although this effect might be too small to allow for indi-vidual risk prediction, it could be useful in reduc-ing the number of subjects who would need to be included in intervention studies aimed at the prevention of type 2 diabetes.
Supported by grants from the Swedish Research Council (in-cluding Linné grant 31475113580), the Heart and Lung Founda-tion, the Swedish Diabetes Research Society, a Nordic Center of Excellence Grant in Disease Genetics, the Diabetes Program at the Lund University, the Finnish Diabetes Research Society, the Sigrid Juselius Foundation, the Påhlsson Foundation, the Cra-foord Foundation, the Folkhälsan Research Foundation, the Novo Nordisk Foundation, the European Network of Genomic and Genetic Epidemiology, the Wallenberg Foundation, and the European Foundation for the Study of Diabetes.
Dr. Lyssenko reports receiving consulting fees from Tethys; Dr. Altshuler, receiving consulting fees from Merck, Eisai, and MPM Capital and grant support from Novartis, receiving an un-restricted grant from the Bristol-Myers Squibb Foundation, and having an equity interest in MPM Capital; and Dr. Groop, receiv-ing consultreceiv-ing fees from Tethys, Eli Lilly, GlaxoSmithKline, Aventis, and Sanofi, lecture fees from Aventis and Sanofi, and grant support from Novartis. No other potential conflict of in-terest relevant to this article was reported.
We thank the patients for their participation and Anna Berg-lund, Margareta Svensson, and Malin Neptin for their excellent technical assistance.
n engl j med 359;21 www.nejm.org november 20, 2008 2232
References
Lyssenko V, Almgren P, Anevski D, et 1.
al. Predictors of and longitudinal changes in insulin sensitivity and secretion pre-ceding onset of type 2 diabetes. Diabetes 2005;54:166-74.
Tirosh A, Shai I, Tekes-Manova D, et 2.
al. Normal fasting plasma glucose levels and type 2 diabetes in young men. N Engl J Med 2005;353:1454-62. [Erratum, N Engl J Med 2006;354:2401.]
Stern MP, Williams K, Haffner SM. 3.
Identification of persons at high risk for type 2 diabetes mellitus: do we need the oral glucose tolerance test? Ann Intern Med 2002;136:575-81.
Wilson PW, Meigs JB, Sullivan L, Fox 4.
CS, Nathan DM, D’Agostino RB Sr. Predic-tion of incident diabetes mellitus in middle-aged adults: the Framingham Offspring Study. Arch Intern Med 2007;167:1068-74.
Altshuler D, Hirschhorn JN, Klanne-5.
mark M, et al. The common PPARgamma Pro12Ala polymorphism is associated with decreased risk of type 2 diabetes. Nat Genet 2000;26:76-80.
Gloyn AL, Weedon MN, Owen KR, et 6.
al. Large-scale association studies of vari-ants in genes encoding the pancreatic beta-cell KATP channel subunits Kir6.2 (KCNJ11) and SUR1 (ABCC8) confirm that the KCNJ11 E23K variant is associated with type 2 diabetes. Diabetes 2003;52: 568-72.
Grant SF, Thorleifsson G, Reynisdottir 7.
I, et al. Variant of transcription factor 7- like 2 (TCF7L2) gene confers risk of type 2 diabetes. Nat Genet 2006;38:320-3.
Saxena R, Voight BF, Lyssenko V, et al. 8.
Genome-wide association analysis identi-fies loci for type 2 diabetes and triglycer-ide levels. Science 2007;316:1331-6.
Frayling TM, Timpson NJ, Weedon 9.
MN, et al. A common variant in the FTO gene is associated with body mass index and predisposes to childhood and adult obesity. Science 2007;316:889-94.
Sandhu MS, Weedon MN, Fawcett KA, 10.
et al. Common variants in WFS1 confer
risk of type 2 diabetes. Nat Genet 2007;39: 951-3.
Scott LJ, Mohlke KL, Bonnycastle LL, 11.
et al. A genome-wide association study of type 2 diabetes in Finns detects multiple susceptibility variants. Science 2007;316: 1341-5.
Sladek R, Rocheleau G, Rung J, et al. 12.
A genome-wide association study identi-fies novel risk loci for type 2 diabetes. Nature 2007;445:881-5.
Steinthorsdottir V, Thorleifsson G, 13.
Reynisdottir I, et al. A variant in CDKAL1 influences insulin response and risk of type 2 diabetes. Nat Genet 2007;39:770-5.
Zeggini E, Weedon MN, Lindgren CM, 14.
et al. Replication of genome-wide associa-tion signals in UK samples reveals risk loci for type 2 diabetes. Science 2007;316:1336-41.
Zeggini E, Scott LJ, Saxena R, et al. 15.
Meta-analysis of genome-wide association data and large-scale replication identifies additional susceptibility loci for type 2 dia-betes. Nat Genet 2008;40:638-45.
Groop L, Forsblom C, Lehtovirta M, et 16.
al. Metabolic consequences of a family his-tory of NIDDM (the Botnia study): evidence for sex-specific parental effects. Diabetes 1996;45:1585-93.
Eriksson KF, Lindgarde F. Prevention 17.
of type 2 (non-insulin-dependent) diabetes mellitus by diet and physical exercise: the 6-year Malmö feasibility study. Diabetolo-gia 1991;34:891-8.
Matsuda M, DeFronzo RA. Insulin 18.
sensitivity indices obtained from oral glu-cose tolerance testing: comparison with the euglycemic insulin clamp. Diabetes Care 1999;22:1462-70.
Hanson RL, Pratley RE, Bogardus C, 19.
et al. Evaluation of simple indices of insu-lin sensitivity and insuinsu-lin secretion for use in epidemiologic studies. Am J Epidemiol 2000;151:190-8.
Bergman RN, Ader M, Huecking K, Van 20.
Citters G. Accurate assessment of beta-cell function: the hyperbolic correction. Dia-betes 2002;51:Suppl 1:S212-S220.
Heding LG. A simplified insulin radio-21.
immunoassay method. In: Donato L, Hul-haud G, Sirchis J, eds. Labelled proteins in tracer studies. Brussels: European Atomic Energy Community, 1966:345-50.
Lyssenko V, Almgren P, Anevski D, et 22.
al. Genetic prediction of future type 2 dia-betes. PLoS Med 2005;2(12):e345.
Tang K, Fu D, Kötter S, Cotter RJ, 23.
Cantor CR, Köster H. Matrix-assisted laser desorption/ionization mass spectrometry of immobilized duplex DNA probes. Nu-cleic Acids Res 1995;23:3126-31.
Pencina MJ, D’Agostino RB. Overall C 24.
as a measure of discrimination in survival analysis: model specific population value and confidence interval estimation. Stat Med 2004;23:2109-23.
Pencina MJ, D’Agostino RB Sr, 25.
D’Agostino RB Jr, Vasan RS. Evaluating the added predictive ability of a new marker: from area under the ROC curve to reclas-sification and beyond. Stat Med 2008;27: 157-72.
Cohen J, Cohen P, West SG, Aiken LS. 26.
Applied multiple regression/correlation analysis for the behavioral sciences. 3rd ed. Hillsdale, NJ: Lawrence Erlbaum, 2003.
D’Agostino RB Sr, Grundy S, Sullivan 27.
LM, Wilson P. Validation of the Framing-ham coronary heart disease prediction scores: results of a multiple ethnic groups investigation. JAMA 2001;286:180-7.
Vaxillaire M, Veslot J, Dina C, et al. 28.
Impact of common type 2 diabetes risk polymorphisms in the DESIR prospective study. Diabetes 2008;57:244-54.
Weedon MN, McCarthy MI, Hitman G, 29.
et al. Combining information from com-mon type 2 diabetes risk polymorphisms improves disease prediction. PLoS Med 2006;3(10):e374.
Cauchi S, Meyre D, Durand E, et al. 30.
Post genome-wide association studies of novel genes associated with type 2 diabe-tes show gene-gene interaction and high predictive value. PLoS ONE 2008;3(5): e2031.
Copyright © 2008 Massachusetts Medical Society.
powerpointslidesofjournalfiguresandtables
At the Journal’s Web site, subscribers can automatically create PowerPoint slides. In a figure or table in the full-text version of any article at www.nejm.org, click on Get PowerPoint Slide. A PowerPoint slide containing the image, with its title and reference citation, can then be downloaded and saved.
The New England Journal of Medicine
Downloaded from nejm.org on June 24, 2012. For personal use only. No other uses without permission. Copyright © 2008 Massachusetts Medical Society. All rights reserved.