Cristina Cornaro, Angelo Andreotti Solar spectral irradiance measurements relevant to photovoltaic applications pages 3541-3550
Solar spectral irradiance measurements relevant to photovoltaic
applications
Cristina CORNARO1,2, Angelo ANDREOTTI1
1Department of Enterprise Engineering, 2CHOSE, University of Rome Tor Vergata
Via del Politecnico, 1 00133, Rome, Italy
Abstract
Recently, two spectroradiometers from EKO have been added to the instrumentation available at the ESTER outdoor station of the University of Rome Tor Vergata, with the aim to characterize the spectral irradiance at the site and evaluate its influence on the performances of photovoltaic modules, especially thin films and third generation devices as Dye Sensitized Solar Cells (DSSC). The paper will present the results of more than six months monitoring activity where the spectral solar irradiance in the range 350 nm – 1,700 nm has been measured continuously with a time interval of 10 minutes on a horizontal plane. A wide variety of spectra have been acquired in various weather conditions and first indications about the spectra behaviour on a daily and seasonal basis have been obtained. Moreover also some information about the effect of the weather conditions on the solar radiation spectral distribution will be presented.
Keywords
Solar spectral irradiance, spectral effects, solar spectral variation, PV module.
Introduction
The introduction of thin film technology into the market (especially amorphous silicon) and, more recently, the impulse to the study of organic and hybrid solar devices has given higher attention to the solar spectral irradiance measurements and studies. These devices, in fact, have a narrower spectral response to the solar irradiance than the common crystalline silicon devices and for this reason they are more sensitive to the spectral variation in this range. Moreover although amorphous silicon is now well established in the market, some mechanisms that characterize its behaviour are not completely understood yet: thermal effects and/or spectral effects seem to contribute to amorphous silicon seasonal performances [1], [2], [3]. Organic devices as Dye Sensitized Solar Cells (DSSC) are still in a research phase and they exhibit a better response at low irradiance levels, under diffuse radiation conditions [4], [5] and also seem to have a sensitivity to the solar spectral variation. It is well known that the solar spectrum varies during the time being sensitive to the time of the day, the season, the weather conditions and also to the position of the receiver [6], [7]. If one wants to evaluate the potentiality of these new generations devices at a particular location, spectral measurements should be taken routinely [8] to evaluate indices that can uniquely identify the spectral characteristics of the site. For this reason the outdoor monitoring station at the University of
relate them to the particular response of new generation PV devices. This work tries to identify the solar spectral variation induced by the local environmental conditions in Rome. Future activity will introduce the spectral variation as a factor that can influence the performance of thin films and new generation photovoltaic devices.
Experimental
The ESTER outdoor station, described elsewhere [9], is active since 2007 in the outdoor monitoring of photovoltaic modules of various technologies and in the solar irradiance measurements at the ground. Quite recently (February 2009) the station has been upgraded with two spectroradiometers by EKO (MS710 and MS712) for field measurements of solar spectral irradiance in the range 350 – 1,700 nm. The two instruments have been located on a horizontal plane in the solar- weather unit of the station, as shown in Figure 1.
Figure 1: view of the solar-weather unit of the ESTER station; on the left the two spectroradiometers.
The MS-710 is provided with a CMOS sensor that can measure spectral irradiance in the range 350 – 1,050 nm, while the MS-712 has an InGaAs sensor that provides measurements in the range 900 – 1,700 nm. The spectral resolution is < 7.5 nm, the wavelength accuracy is ±1.5 nm with a cosine error ≤ 5%.The two spectra are merged with a dedicated software so that the final spectral irradiance is in the range 350 – 1,700 nm. Both instruments are suitable for field measurements and do not require particular maintenance or protection to the weather conditions. The spectral intensity is collected by optical diffuser protected by a glass dome. A shutter can control the exposition time on a grating that separate the wavelength components, the spectral intensity is then measured by a photodiode array. Data acquisition is controlled by a dedicated software that collects the spectra every 10 minutes and stores them in a dedicated computer. Solar irradiance spectra have been collected since February 2009 and data till December 2009 are considered for this study. As an example the spectral irradiance collected in a clear day of May 2009 for various time of the day is shown in Figure 2.
Figure 2: solar spectral irradiance at different hours of a clear day of May 2009. Spectral Indices
To illustrate the effect of the solar spectral variations it is useful to define a parameter that can represent the extent to which a spectrum can shift toward the red or the blue. Different authors use different indices to evaluate this behaviour [3], [10], [11]. Here we focus the attention on two indices that are also well correlated each other: the Useful Fraction (UF) which essentially depends on the PV technology that is considered and the Average Photon Energy (APE) which is independent from the particular technology under consideration.
The Useful Fraction is defined as follow:
( )
∫
∫
∞ = 0 0 ( ) λ λ λ λ λ d G d G UF (1)where G(λ) is the spectral irradiance that at the numerator is integrated over the band gap of the material of the chosen technology and at the denominator is integrated over the whole solar spectrum, giving the total irradiance.
The UF represents the amount of energy from the sun which is usefully converted into electricity by the considered device. It is well known that crystalline silicon responds to a broader solar energy band with respect to thin film, like amorphous silicon or with respect to the new generation DSSC technology. The value of UF for amorphous silicon is approximately 0.6 for the standard spectrum at 1.5 AM [1]; higher values indicate a blue shift while lower value indicates red shift of the solar spectrum.
The Average Photon Energy (APE) is defined as the average energy per photon of the spectrum and it is calculated by dividing the integrated irradiance with the integrated photon flux density as follow:
where q is the electronic charge, G is the spectral irradiance and Φ the photon spectral flux density. The APE for the reference spectrum [3] is 1.88 eV in the range 350 – 1,050 nm while for a spectral range of 350 – 1,700 nm is 1.6 eV. A high value of APE corresponds to blue rich spectrum while a low value indicates a redder spectrum. A good correlation agreement has been demonstrated between APE and UF for amorphous silicon, [12], so that these two indices can be used interchangeably. APE calculation is more straight forward since it is a device independent index and its uniqueness for the spectra measured in a particular location and climate has been recently demonstrated [13]. In the following discussion the characteristics of the solar spectrum with respect to air mass, season and weather conditions will be illustrated. Moreover the average colour of the spectra at the site will be identified considering APE calculated in the spectral range 350 – 1,700 nm.
Results
In order to evaluate the spectral characteristics of the solar spectra measured at various irradiance intensities a normalization procedure has to be considered. In this work the spectral irradiance has been normalized with respect to the intensity value measured at 560 nm [3]. The intensity at this wavelength is least affected by environmental conditions especially related to the water vapour content into the atmosphere (absorption and scattering). The normalized spectra have been studied in order to evaluate their variation during the day, during the year and for an overcast day, to characterize the spectra behaviour for the location in the period March – December 2009.
The APE parameter has been chosen as a spectral index for the evaluation of the average colour of the solar spectrum measured on a horizontal plane in the area of Rome. As already mentioned the APE index is related to the colour of the spectrum: high APE values indicate a spectrum shifted toward the blue while a lower value is correlated to a redder spectrum. To verify this for our measurements we took all the spectral measurements taken during the period considered and we calculated the APE values. For each months the spectra at noon have been related to the correspondent APE and the spectral irradiances have been graphed. Figure 3 shows some of these spectra for the month of June 2009.
Figure 3: irradiance spectra at different APE taken at noon for the month of June 2009.
In this case APE has been calculated for the spectral range 350 – 1,050 nm. It can be observed as the spectrum with the highest energy in the blue part (bluest spectrum) with respect to the red part is the one with highest APE and that as the APE decreases also the blue content of the spectrum decreases. This behaviour has been observed when comparing spectra of the same month while if spectra for different months and different APE are compared the previous considerations do not hold.
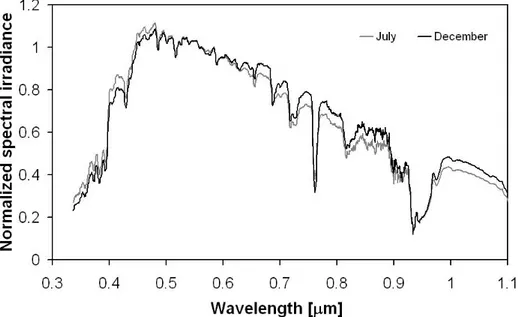
Figure 4. Normalized spectra for July and December 2009.
Figure 4 shows the normalized solar spectral irradiance measured for clear days at noon for the month of July and December 2009. It can be noted the air mass effect on the spectral variation, indeed, the December spectrum appears more reach in the high wavelengths (red shift) and this is due to the longer path the solar radiation covers to reach the ground (higher AM) in the winter months than in the summer months. This behaviour has been confirmed by the analysis of various clear days spectra measured at noon and it has been proved for all the months.
To quantify this assumption the APE index for the spectral range 350 – 1,700 has been calculated for the spectra showed in Figure 4. The July spectra has an APE of 1.72 while for December a value of 1.59 has been calculated. Considering an average APE value of 1.64 for the period, July exhibits a 5% bluer spectrum than the average while December a 2.6% redder spectrum than the average, moreover, between the two seasons a spectral variation of the order of 8% has been observed. These findings confirm a consistent seasonal effect on the spectral irradiance.
It is known that the spectral variation is strongly dependent on the water vapour content into the lower atmosphere and that this content varies during the day, in particular water vapour is generally lower in the morning than in the afternoon providing a redder spectrum in the morning than in the afternoon [6]. To prove this assumption a series of clear days for each month have been considered; for each day three spectra have been chosen: one in the morning, one at midday and one in the afternoon.
Figure 5: a) daily spectra variation of a clear day in March 2009; b) daily spectra variation of a clear day in May 2009; c) daily spectra variation of a clear day in July
2009; d) daily spectra variation of a clear day in December 2009.
Figure 5 shows the three normalized spectra for the month of March, May, July and December 2009. It can be observed that in all cases the normalized morning spectral irradiances have higher intensities in the red part of the spectrum, while in the afternoon the intensities are higher in the blue part, confirming the previous assumption. This behaviour has been observed systematically for each clear day considered, the only anomaly has been observed for the month of November 2009 and this behaviour has not been completely understood. However, the amount of energy delivered in the red part and in the blue part of the spectrum expressed as fraction of the global solar irradiance in the range 350 – 1,700 nm, shows only a variation of the order of 0.5% between morning and afternoon, indicating a low significance for the data considered. More quantitative evaluations are necessary to confirm or reject this hypothesis. Analogous considerations can be done comparing spectra taken in a clear day with spectra taken in an overcast day. Nann and Riordan, [7] carried on an interesting study on the behaviour of the solar spectrum in the overcast sky conditions.
They conclude that the relative spectral transmission is enhanced in the UV and blue region of the spectrum in an overcast day while a consistent reduction is observed for the wavelength in the 700 – 950 nm range where some water vapour absorption bands are present.
Between the 950 nm and 1,000 nm even if other vapour bands are present they observed an increase in spectral transmission essentially due to albedo effects from the clouds and the ground. In order to find a confirmation to what exposed, a series of spectra of overcast days and clear days taken at noon in the different periods of the year considered have been compared.
a b
Figure 6: irradiance spectra taken on the 5th (clear day) and 8th (overcast day) of December 2009.
In Figure 6 it is shown, as an example, the comparison of two normalized spectra measured in a clear and in an overcast day for the month of December. The behaviour confirms the Nann and Riordan considerations for what concerns the blue enrichment of the spectrum in the overcast day, while no increment has been observed at higher wavelengths. For each month the APE index of the overcast and clear day spectrum at noon has been calculated. The values have been compared with the monthly average APE at noon. For the overcast days the increment in APE with respect to the average varies from a maximum of 24% in June and a minimum of 3.5% in May. For the clear days, the variation is of the order of 3.5% less than the average (redder spectrum). For each month, considering the average of the spectra at noon of the overcast days, an increment in APE of approximately 10% with respect to the clear days has been observed. PV devices such as amorphous silicon and DSSC can be sensitive to the blue shift observed for the overcast days since their spectral response is mainly centred on the blue part of the spectrum as can be seen from figure 7, where the effective energy collected by a DSSC and a double junction amorphous silicon device is shown. Less evident effect can be considered for devices that have a broader spectral response, such as crystalline silicon and CIS.
To characterize the site for the period of interest, the solar energy delivered under different values of APE (spectral range 350 – 1,700 nm) was calculated and it is shown in Figure 8. The APE values were separated in 0.01 eV bins and for each bin the solar energy (irradiation) was calculated integrating the irradiance. It can be seen how the energy peaks at an APE of 1.61 and that approximately 60% of the total energy for the period is delivered with APE higher than 1.6 indicating a slighter enrichment in the blue wavelengths. It has also to be considered that, owing to a failure in the measurement system, the August, September and October data have not been considered for the analysis. A higher percentage of energy at higher APE could be expected taking into account also for the contribution of the missing data that are mostly concentrated in the summer period where bluer spectra are observed.
Figure 8: energy delivered under different APE at the Rome site for the period March 2009 – December 2009.
Conclusions
Spectral irradiance measurements in the spectral range 350 – 1,700 nm have been collected on a horizontal plane at the outdoor monitoring station of the University of Rome Tor Vergata since February 2009. Data analysis evidenced the dependence of the solar spectrum from the time of the day, the period of the year and the presence of clear sky or cloudy sky. APE index has been calculated for the considered spectra and it has been used as an indicator of the blue enrichment of the spectrum. A variation in APE of around 7% is observed between summer and winter period (summer is bluer) while for the overcast days a blue enrichment proved by an increment of APE of approximately 10% with respect to the clear days is observed. For the period March 2009 – December 2009 a spectral characterization of the site has been made, considering the amount of solar energy delivered under different APE. A solar energy peak has been observed at an APE value of 1.61 eV, very near to the APE calculated for the Standard Spectrum (1.6 eV). A slight shift towards blue enriched energy is observed with approximately 60% of the total energy delivered at APE higher than 1.6 eV for the data considered. Some missing data in the summer period would probably have contributed to increase the energy delivered at high APE.
In the future, the instruments will be positioned on the plane of the PV modules under test and a systematic evaluation of the performance dependence from the solar spectrum will be carried on with special focus on thin film technology and organic Dye Sensitized Solar Cell (DSSC) devices.
Acknowledgements
This work was supported by the Lazio Region within the frame of the Centre for Hybrid and Organic Solar Energy (CHOSE).
Nomenclature
G: Spectral Irradiance [W/m2
µm] λ: Wavelength [µm]
Φ: Photon Spectral Flux Density [µmol/m2/s]
APE: Average Photon Energy [eV] UF: Useful Fraction
q: Electron charge [C]
References
[1] Gottschalg R., T.R. Betts, D.G. Infield, M.J. Kearney, 2005, “The effect of spectral variations on the performance parameters of single and double junction amorphous silicon solar cells”, Solar Energy Materials and Solar Cells, Vol 85, pp. 415-428.
[2] Nakada Y., S. Fukushige, T.Minemoto, H. Takakura, 2009, “Seasonal variation analysis of the outdoor performance of amorphous Si photovoltaic modules using the contour map”, Solar
Energy Materials and Solar Cells, Vol 93, pp. 334-337.
[3] Minemoto T., S. Nagae, H. Takakura, 2007, “Impact of spectral irradiance distribution and temperature on the outdoor performance of amorphous Si photovoltaic modules”, Solar Energy
Materials and Solar Cells, Vol 91, pp. 919-923.
[4] Hinsch A.,H. Brandt, W. Veurman, S. Hemming, M. Nittel, U. Wurfel, P. Putyra, C. Lang-Koetz, M. Stabe, S. Beucker, K. Fichter, 2007, “Dye solar modules for facade applications: Recent results from project ColorSol” Solar Energy Materials and Solar Cells, Vol 93, pp. 820-824.
[5] Cornaro C., A. Spena, T. M. Brown, A. Di Carlo, A. Reale, S. Martella, 2009, “Outdoor characterization of Dye Solar Cells: first results” Proceedings of the 24 EUPVSEC, 21-25 September, Hamburg.
[6] Fabero F., F. Chenlo, 1991, “Variance in the solar spectrum with the position of the receiver surface during the day for PV applications”, Proceedings of the 22nd IEEE Photovoltaic Specialist Conference, pp. 812-817.
[7] Nann S. C. Riordan, 1990, “Solar spectral irradiance under overcast skies”, Proceedings of the 21st IEEE Photovoltaic Specialist Conference, 21-25 May, Orlando, USA.
[8] Gottschalg, R., D.G. Infield, M.J. Kearney, 2003, “Experimental study of variations of the solar spectrum of relevance to thin film solar cells”, Solar Energy Materials and Solar Cells, Vol 79, pp. 527-537.
[9] Spena A, C. Cornaro, S. Serafini, 2008 “Outdoor ESTER Test Facility for Advanced Technologies PV Modules”, Proceedings of the 33rd IEEE Photovoltaic Specialists Conference,
[10] Perez-Lopez J.J., F. Fabero, F. Chenlo, 2007, “Experimental solar spectral irradiance until 2500 nm: results and influence on the PV conversion of different materials” Progress in
photovoltaics: Research and Applications, vol. 15, pp. 303-315.
[11] Gottschalg, R., T.R. Betts, D.G. Infield, M.J. Kearney, 2004, “On the importance of considering the incident spectrum when measuring the outdoor performance of amorphous silicon photovoltaic devices”, Measurement Science and Technology, Vol 15, pp. 460-466. [12] Betts T.S., C.N. Jardine, R. Gottschalg, D.G. Infield, K. Lane, 2003, “Impact of spectral effects on the electrical parameters of multifunction amorphous silicon cells” Proceedings of the 3rd World Conference on Photovoltaic Energy Conversion, 11-18 May, Osaka, Japan. [13] Minemoto T., Y. Nakada, H. Takahashi, H. Takakura, 2009, “Uniqueness verification of solar spectrum index of average photon Energy for evaluating outdoor performance of photovoltaic modules”, Solar Energy, vol. 83, pp. 1294-1299.