CHAPTER 3
Measurement of the critical micelle concentration of the surfactants
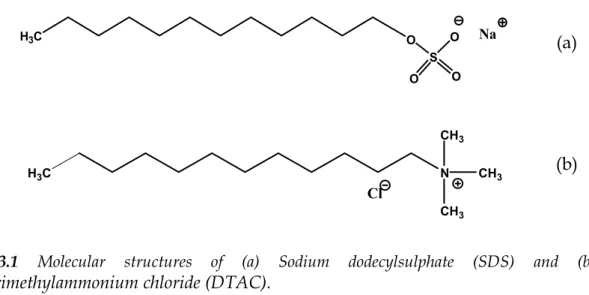
Two surfactants, the anionic sodium-dodecyl-sulphate (SDS) and the cationic dodecyl-trimethylammonium chloride (DTAC), were employed depending on the metal ions to be extracted. The structures of the surfactant monomers are shown in Figure 3.1.
The CMC of SDS in water is about 8.0 × 10⁻³ M (Chattopadhyay and London, 1984; Goodling et al., 1994), while the CMC of DTAC in water is about 2.0 ×10⁻² M (Nowakowska et al., 2003; Klevens, 1953).
H3C O S O Na O O H3C N CH3 CH3 CH3 Cl
Figure 3.1 Molecular structures of (a) Sodium dodecylsulphate (SDS) and (b)
dodecyltrimethylammonium chloride (DTAC).
Since the beginning of the study of surfactant containing systems it was recognized that physical properties of the solutions, such as surface tension, electrical conductivity, osmotic pressure and light scattering, show an abrupt change in the neighbourhood of a critical concentration. Most of the physico-chemical property changes can be used to determine the CMC, provided that the measurement can be carried out accurately. A wide variety of techniques involving the measurement of physical properties have been used to determine the CMC value.
(a)
3.1 Determination of critical micelle concentration of SDS
In the present investigation electrical conductivity measurements were used to determine the CMC value of SDS. Since the mobility of the ionic surfactant when present as monomer resembles that of dissociated salts, and differs significantly from that of aggregated surfactant, there is a change in the conductivity at the CMC (Williams et al., 1955).
The measuredconductance C (S), defined as the reciprocal of the resistance, for a solution is related to the distance between the electrodes (l) and the microscopic surface area (geometric area× roughness factor) of each electrode (A):
k l A
C= χ =χ (3.1)
The quantity χ (S cm-1) is the specific conductance or conductivity and contains all of the chemical information available from the measurement (e.g., concentrations and mobilities of the ions present). Therefore conductivity is an intrinsic property of a solution, rather than a property of the conductance cell used. The ratio A/l is a constant for a given measurement cell, and is hence referred to as the cell constant k. Since it is difficult to build a cell with well defined geometrical parameters, any cell should be calibrated with a solution of exactly known specific conductance. The cell constant is determined by measuring the conductance of a cell filled with a solution of known specific conductance, which is invariably KCl.
Since conductivity is concentration dependent, measured values for different solutions are not easy to compare directly. For this reason, a quantity denoted as the molar conductivity (or sometimes equivalent conductivity) is used (Bard and Faulkner, 1980). The molar conductivity Λ (S cm2 mol-1) is defined as the solution conductivity normalized by the total concentration. If the electrolyte concentration, c, is expressed in mol/cm3, the molar conductivity is defined as:
c χ =
For strong electrolytes Kohlrausch (Robinson and Stokes, 2002) determined the variation of molar conductivity with concentration
(3.3) where Λ0 represents the molar conductivity for a compound that would hypothetically be measured in the limit of infinite dilution.
The measurements have been carried out at 25 °C in a cell with k = 0.965 cm by progressively adding known amounts of SDS solution 0.2 M to 10 ml of water. For each addition the conductance has been measured. The calculated value of the molar conductivity has been plotted against the square root of SDS concentration, according to equation (3.3) (Fig. 3.2). Upon addition of SDS to an aqueous solution a linear decrease in molar conductivity was observed up to surfactant concentrations of 7.8×10⁻³ M, where a change of slope was seen. This break occurs at surfactant concentrations equal to the CMC. The value so obtained (7.8×10⁻³ M) is in good agreement with the literature value (8.0 ×10⁻³ M).
The first points of the curve decrease linearly with c in accordance equation (3.3). Therefore the intercept of the first straight line gives Λ0 for the monomeric SDS.
0.00 0.05 0.10 0.15 0.20 30 40 50 60 70 80 90 Λ (S cm 2 mo l -1 ) [SDS]1/2 (M)1/2
3.2 Determination of critical micelle concentration of DTAC
The CMC of DTAC was checked by electrical conductivity, surface tension and calorimetric measurements; there was evidence for the presence of small amounts of an amine impurity in the DTAC. This was not eliminated, as in commercial extraction it is expected that impure surfactants would be employed. The CMC of our sample was found to be 1.0 × 10⁻² M, somewhat less than the literature CMC values of pure DTAC (~ 2×10⁻² mol dm-3). However the results obtained from the methods employed here are in good agreement among each other.
3.2.1 Conductivity measurement
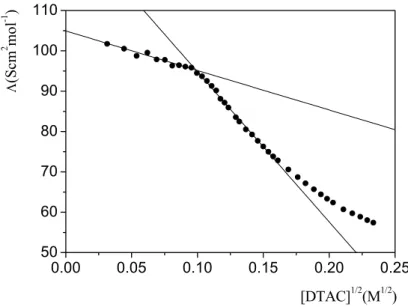
The measurements have been carried out at 25 °C in a cell with k = 0.965 cm by progressively adding known amounts of DTAC solution 0.1 M to 10 ml of deionised water. For each addition the conductance has been measured. The molar conductivity has been plotted against the square root of DTAC concentration (Figure 3.3). The CMC value so obtained was 9.9 × 10 -3 M.
0.00 0.05 0.10 0.15 0.20 0.25 50 60 70 80 90 100 110 Λ (S cm 2 mo l -1 ) [DTAC]1/2(M1/2)
Figure 3.3 Dependence of the molar conductivity of DTAC on the square root of the surfactant
3.2.2 Surface tension measurement
The cohesive forces between liquid molecules are responsible for the phenomenon known as surface tension. The cohesive forces between molecules down into a liquid are shared with all neighboring atoms. The molecules at the surface have no neighboring atoms above and consequently they cohere more strongly to those directly associated with them on the surface. This enhancement of the intermolecular attractive forces at the surface is called surface tension.
The surface tension (γ) is defined as the force acting on a liquid-gas interface resulting in a thin film on the surface. It can be quantified as the force acting parallel to the interface per unit length of the film at equilibrium, which also equals the surface energy (the energy required to increase the surface area of the liquid by a unit amount). This force tends to minimize the area of the surface, thus explaining why drops and bubbles are round. The surface tension is typically measured in N/m.
When a surfactant is placed in a water system it adsorbs at the air-water surface and lowers the surface tension. In fact an amphiphilic molecule can arrange itself at the surface of the water such that the polar part interacts with the water and the non-polar part is held above the surface. The presence of these molecules on the surface disrupts the cohesive energy at the surface and thus lowers the surface tension.
The proportion of molecules present at the surface or as micelles in the bulk of the liquid depends on the concentration of the amphiphile. At low concentrations surfactants will favor arrangement on the surface. As the surface becomes crowded with surfactant more molecules will arrange into micelles. At some concentration (the CMC), the surface becomes completely loaded with surfactant and any further additions must arrange as micelles. Therefore the surfactant will cause a large reduction in surface tension at low concentration up to the CMC while, when the CMC is reached, i.e. when the surface is saturated with surfactant molecules, a further increase in surfactant concentration no longer has any appreciable
There are many methods for determining the surface tension of a liquid. We used the “Du Nouy” tensiometer which consists of a platinum ring supported by a stirrup attached to the beam of a torsion balance. The ring is placed at the interface of the liquid with air. It is then pulled upward until it breaks free of the liquid and moves into the air. The tensiometer provide the force (F) required to break the ring free of the liquid/air interface, which is proportional to the surface tension (γ).
γ
πr
F =4 (3.4)
where r is the ring radius. If φ is the torsion angle of the balance the elastic force is F = -k φ and from equation 3.4 :
r k π ϕ γ 4 = (3.5)
It was not necessary to know the technical parameters (k, r, φ) of the instrument because the tensiometer automatically converts F to γ.
Figure 3.4 shows the values of measured γ obtained by adding increasing amounts of DTAC solution to 10 ml of deionised water. Usually in order to determine the CMC, two linear sections formed by the measuring points must be determined and the CMC is obtained from the intersection of the straight lines for the linear concentration-dependent section and the concentration-independent section. However, in the present case the plot of surface tension versus [DTAC] (Fig. 3.4) shows a minimum. This means that the surfactant contains an impurity, which is more surface active than the surfactant itself. This impurity is preferentially adsorbed at the liquid-air surface lowering the surface tension and when the micelles form in solution it becomes solubilized in the micelles, thus desorbing from the liquid-air interface and determining an increase in surface tension. The CMC, evaluated from the minimum in the graph represented in Figure 3.4, is 1.0 × 10⁻² M.
0.00 0.01 0.02 0.03 0.04 0.05 30 40 50 60 70 80 γ (mN/m ) [DTAC] Figure 3.4 Surface tension of DTAC at 25 °C.
3.2.3 Calorimetric measurement
Finally the CMC of DTAC was determined by calorimetric titration.
In the application of titration calorimetry towards understanding the properties of ionic surfactants in aqueous solution (Grime, 1985; Bijma et al., 1994), small aliquots of a solution containing a surfactant at a concentration greater than the CMC are injected into a sample cell. Initially, the sample cell contains water and so the calorimeter senses the heat q accompanying micelle deaggregation. With an increase in the number of aliquots injected into the sample cell, the concentration of surfactant in this cell increases and eventually exceeds the CMC. The heat accompanying subsequent injected aliquots is then associated with dilution of micelles into a micellar solution. A plot of heat q against concentration of surfactant in the sample cell shows a step at the CMC. The titration calorimetric technique yields, therefore, in principle, both the enthalpy of micellization ∆micH° and the CMC at a given temperature.
The calorimetric titration was carried out under isothermal conditions at 25 C°. Small quantities (50 µl) of a DTAC solution (0.1 M) were added to the calorimetric cell filled with 12.475 ml of pure water. The DTAC solution, containing a surfactant
calorimeter records the heat effect caused by dilution of the surfactant. Following injection, a series of exothermic pulses were recorded and each recorded rate of heating was integrated to yield a plot showing the dependence of heat of injection q on surfactant concentration in the sample cell. The ratio of heat q to amount of surfactant injected yields the enthalpy of injection per mole of surfactant, ∆injH. The titration curve so obtained is represented in Figure 3.5; the inflection point on the curve, determined by taking the first derivative (Figure 3.6), corresponds to the CMC (9.7 × 10⁻³ M). 0.000 0.005 0.010 0.015 0.020 0.5 1.5 2.5 3.5 -∆ inj H (k J/ m ol) [DTAC] (M) Figure 3.5 Calorimetric titration curve of DTAC recorded at 25 °C.
0.000 0.005 0.010 0.015 0.020 -400 -200 0 dH /dC [DTAC] (M) Figure 3.6First derivative of the titration curve shown in Fig. 3.5