ITALIAN
ENERGY EFFICIENCY
ANNUAL REPORT
2015
EXECUTIVE SUMMARY
August 2015
The full report was edited by the Italian National Energy Efficiency Agency of ENEA, on data and information available at April 30th, 2015. Project Leaders: Roberto Moneta, Nino Di Franco, Ilaria Bertini, Alessandro Federici Project Manager: Alessandro Federici Editorial team: Carlo Alberto Campiotti, Dario Chello, Antonio Disi, Gaetano Fasano, Laura Manduzio, Mauro Marani, Chiara Martini, Gabriella Messina English translation: Chiara Martini Cover design: Cristina Lanari The Italian National Energy Efficiency Agency would like to thank all the authors, and key experts who played advisory roles in drafting the full report. For further information please contact: Agenzia Nazionale per l’Efficienza Energetica CR ENEA Casaccia. S.P. 002 Via Anguillarese, 301 00123 S.Maria di Galeria ‐ Roma e‐mail: [email protected] Without further permission, the contents of this document may be reproduced in whole or in part for non‐commercial use only, and provided that both ENEA is acknowledged as the source, and any third party receiving the material is informed that these conditions also apply to them and that they must comply with these conditions. To download a copy of the full report, please visit: http://www.agenziaefficienzaenergetica.it/. ENERGY EFFICIENCY ANNUAL REPORT 2015 ‐ EXECUTIVE SUMMARY 2015 ENEA – www.enea.it Italian National Agency for New Technologies, Energy and Sustainable Economic Development Lungotevere Thaon di Revel, 76 00196 Roma
Foreword I always believed in the strength of simple ideas and I am convinced that energy efficiency is one of them. Simple actions make the difference, and a new cultural approach should be developed: to achieve the same result, with a system that makes use of less energy. In recent years, I could look at energy efficiency from different perspectives – citizen, academic professor, Member of Parliament, company consultant, and now in a big national institution strongly involved in the energy challenge – and I witnessed several changes described in this Fourth Annual Report on Energy Efficiency. This report is not only a collection of results. It is the tangible sign that citizens, private companies and public administration have understood and accepted the challenge in this field. Thus, they need a knowledge tool able to help guide themselves, assessing the performances of their initiatives and accepting suggestions for the direction of this deep change. Our industry sector, and the pioneering White Certificates scheme, have ensured between 2005 and 2013 a primary energy saving of almost 5 Mtoe/year and, since 2007, more than two million of taxpayers have invested more than EUR 22 billion in energy upgrading of their homes. A virtuous path that make us a fundamental component of European environmental and energy policy, and places Italy among the most active countries, in particular in terms of cost‐benefits of the implemented actions. Nevertheless, we still use too much energy to produce manufactured items, heat homes, reach workplaces. Energy efficiency technologies are often available and continuously improving, but the structures and mechanisms that could allow their adoption often develop at a slower speed, impeding the potential advantages.
The answer is innovation. In both technologies and behaviors. The change and technological development can increase in a significant way the range of available options, reducing the cost of objectives achievement: looking at future, high performance and efficient technologies will be more and more needed. Nevertheless, hitting the targets would be difficult without an active role of every single actor.
Then, we strongly need a more accessible and transparent information, in order to involve the highest number of actors: it would be decisive to recognize to knowledge the role of primary resource for having proactive and well‐informed consumers.
In such a context, policy plays a fundamental role to create an attractive environment for knowledge, research and development, and to support those actors that as ourselves are committed to “create” innovation. Well‐structured technological development policies are key in a strategy to attract more investments in energy efficiency technologies.
Thanks to the know‐how of our researchers, recognized experts inside and outside national borders, we can provide a contribution to identify appropriate solutions to the needs of both collectiveness and single citizens: the Annual Report on Energy Efficiency is a product of this know‐how and competence, which we willingly make available with the wish it could be a useful knowledge and work tool.
Table of contents
Introduction: the international and national context 7 1. Energy demand 9 2. Final energy use 9 3. Energy intensity 11 4. Monitoring of indicative national objectives of energy saving, effectiveness and efficiency of the adopted measures 12 5. Renovation of the building stock 16 6. The energy efficiency market and available financial tools 18 7. Information and training 21 8. Sustainability and competitiveness of the agro‐food system 24 Authors 26
Introduction: the international and national context In recent years, attention to energy efficiency has grown, from the lack of visibility inherent in its past identification as “the hidden fuel” to an increasing recognition as “the first fuel”. According to the International Energy Agency (IEA), energy efficiency is placed on an equal footing with any other energy resource and it can contribute to the three main challenges of world energy policy: energy security, sustainability and economic development. In the period 1970‐2011, avoided energy use from energy efficiency improvements (1,337 million tonnes of oil equivalent, Mtoe) was larger than the total final consumption of oil (1,202 Mtoe), electricity (552 Mtoe) or natural gas (509 Mtoe) in 2011, and higher than total final energy consumption of the European Union (1,139 Mtoe).
In 2050, IEA global analyses show that 40% of energy would have to come from energy savings. This is one of the reasons why the energy efficiency market is receiving a growing attention from institutions, as witnessed by the launch of the Energy Efficiency Action Plan by the Group of Twenty (G20) in 2014. In spite of the key strategic role of energy efficiency, projections reveal that under existing policies the vast majority of economically viable investments will not be realized. Many barriers contribute to this result, one of the main ones being the lack of attention paid to energy efficiency investment opportunities both by public and private stakeholders relative to other options available on the market, associated for example to unconventional gas. IEA data show that investments associated to technologies for extraction, distribution and use of natural gas and oil are around three times larger than those in energy efficiency, which are still highly differentiated for different countries and end‐use sectors.
However, aggregate annual investments in energy efficiency were more than USD 310 billion in 2012 (IEA, 2014), which was larger than supply‐side investment in renewable electricity or in coal, oil and gas power generation. Around 40% of energy efficiency investment worldwide is financed with debt and equity, and the remaining is auto‐financed by the private sector, through incentives as well. The market is moving from being a niche to a more established segment, in part as a result of the availability of a greater range of financial products and Energy Performance Contracts, involving a growing number of Energy Service Companies (ESCOs). As largely highlighted in the Energy Efficiency Directive (EED) 2012/27/EU, European energy efficiency field needs innovative financing tools. Around EUR 100 billion investments per year are necessary to achieve the 20% energy saving target by 2020. In order to address the financing barriers that hinder the deployment of energy saving technologies, we need to
8
support the development of a robust investment framework in this sector, and to increase the knowledge and capacity among stakeholders.
With the aim of reaching the 2020 objective and providing the basis for further improvements beyond 2020, EED sets a common framework of measures to promote energy efficiency in the EU. Moreover, it introduces rules to remove obstacles on the energy market and overcome the shortcomings that limit the efficiency in energy supply and use. The Directive also defines national indicative energy efficiency objectives for 2020. In Italy, the EED transposition (Legislative Decree 102/2014) and the 2014 National Energy Efficiency Action Plan (NEEAP 2014) further reinforce policies in this sector, with the aim of achieving the 2020 energy saving objective of 20 Mtoe of primary energy, equivalent to 15.5 Mtoe of final energy. Table 1 – Energy efficiency objectives to 2020 (final and primary energy, Mtoe/year) Sector Measures to be implemented in 2011‐2020 Expected savings at 2020 Energy Efficiency Directive ‐ Article 7 Other measures Obligation Scheme Alternative measures White Certificates Scheme Tax Deductions Scheme Heating & Cooling Support Scheme
Standards Transport Final Energy Primary Energy Residential 0.15 1.38 0.54 1.60 3.67 5.14 Services 0.10 0.93 0.20 1.23 1.72 Public 0.04 0.43 0.10 0.57 0.80 Private 0.06 0.50 0.10 0.66 0.92 Industry 5.10 5.10 7.14 Transport 0.10 3.43 1.97 5.50 6.05 Total 5.45 1.38 1.47 5.23 1.97 15.50 20.05 Source: NEEAP 2014 In our country, the White Certificate scheme is the EED obligation scheme. It should ensure the achievement of an energy saving not lower than 60% of the cumulative national energy saving 2020 objective. The other existing incentive measures for energy efficiency interventions would allow the remaining energy saving to be achieved.
The Legislative Decree 102/2014 also introduces the National Fund for Energy Efficiency, an important financial tool to support energy refurbishment of Public Administration buildings and interventions to reduce energy consumption in industry and service sectors. A specific component of the fund sustains investments in district heating and cooling.
The currently available financial resources amount to more than EUR 800 million. In order to ensure an optimal coordination between interventions financed by the Fund and other energy efficiency measures, the Decree has also envisaged a specific steering committee, recently constituted: the quick implementation of the program for energy refurbishment of Public Administration buildings is among its primary objectives, and the Government has earmarked EUR 350 million for the period 2014‐2020. 1. Energy demand
In 2013, primary energy demand has confirmed its negative trend: gross inland consumption was 173 Mtoe, decreasing by 1.9% relative to 2012. More in detail, natural gas consumption was at the same level than oil consumption (57.4 Mtoe). Renewables were the only primary energy source for which an increase has been observed (+27.2%), with a share on the total equal to 19.6%. Solid fuels contributed with a share equal to 8.2%, whereas the electricity contribution equaled 5.4% (Figure 1). Figure 1 – Primary energy demand by energy source (%), year 2013 Source: Ministry of Economic Development
The energy demand distribution by source confirms the peculiar characteristics of Italy, when compared with the EU average: indeed, it stands out for high natural gas use, structural electricity import, low contribution of solid fuels, and absence of nuclear energy. 2. Final energy use In 2013, final energy use was 126.6 Mtoe, 1% lower than in 2012. This is in line with the decreasing trend observed since 2010, which has taken final energy use back to the 1997 level (Figure 2). 34% 33% 20% 8% 5% Oil Natural Gas Solid Fuels Electricity Renewables
10 Figure 2 – Final energy use by sector (Mtoe), years 1997‐2013 Source: Ministry of Economic Development It is worth noting that energy consumption is higher than in 1997 only in the residential and services sector (+31.9%). By contrast, starting from 2005 energy consumption has lowered consistently in the industrial sector, reaching 28.2 Mtoe (‐24.3% relative to 1997). Finally, during the investigated period a slight decrease in transport sector consumption has been observed (‐2.7%) and a higher decrease in agriculture (up to 2.7 Mtoe, corresponding to ‐14.4%).
In 2013, in terms of sectoral distribution, civil sector employs 39.1% of final energy use, followed by transport (29.9%) and industry (22.3%). Remaining energy (11.1 Mtoe) is distributed among agriculture (2.2%), bunkers (1.9%) and non‐energy use (4.7%), in particular relative to petrochemical sector (Figure 3). Figure 3 – Final energy use by sector (%), year 2013 Source: Ministry of Economic Development 0 20 40 60 80 100 120 140 160 Mtoe Bunkers Non‐Energy Use Agriculture Residential and Services Transport 22% 30% 39% 2%5% 2% Industry Transport Residential and Services Agriculture Non‐Energy Use Bunkers
3. Energy intensity In 2013, energy intensity of the Italian economy was 122.27 toe/M€2005 (Figure 4), showing a constant value with respect to 2012 (+0.05%), against a PIL reduction equal to 1.9%. Since 2005, when White Certificates mechanism was introduced, energy intensity has decreased by 7.9%. Figure 4 – Energy intensity, GDP and gross inland energy consumption, years 2000‐2013 Source: ENEA elaboration on data from Ministry of Economic Development and ISTAT
In Italy, energy intensity of the economy is lower than the average of 28 EU member countries and of Euro Area countries (Figure 5). The distance between Italy and the Euro Area countries is steadily reducing: in 1995, the difference amounted to 40 toe/M€2005, whereas in 2013 to 20 toe/M€2005. Figure 5 – Energy intensity of the economy in EU28 (toe/M€2005), years 1991‐2013 Source: ENEA elaboration on EUROSTAT data 100 120 140 160 180 200 1300 1350 1400 1450 1500 1550 GDP (Billion €2005) (left) Gross inland energy consumption (Mtoe) (right) Energy intensity (toe/M€2005) (right) 100 120 140 160 180 200 toe/M€ 2005 EU28 Euro Area France Germany Italy UK Spain
12 For an overall evaluation of energy efficiency improvements in different sectors, the ODEX energy efficiency index has been adopted. Developed within the ODYSSEE‐MURE European project, it provides a more reliable assessment than energy intensity figures, since it does not include structural changes and other non‐efficiency factors (Figure 6). Figure 6 – ODEX energy efficiency index (1990=100), years 1990‐2013 Source: ODYSSEE In 2013, the ODEX index for the whole Italian economy was 86.6, almost constant in the last three years, counteracting the constant improvement trend observed until 2011. Sectors have contributed to this trend in a different way: residential sector registered regular and constant progresses under all the period 1990‐2013; manufacturing industry has obtained significant improvements starting from 2005, with a negative result in 2013 associated to a slight efficiency loss in non‐metallic minerals (excluded cement) and textile. Transport sector shows the greatest difficulties in achieving energy efficiency improvements due to the characteristics of goods transport system, based almost exclusively on road transport. In particular, both the number of travels and energy consumption are growing, although with a lower load factor.
4. Monitoring of indicative national objectives of energy saving, effectiveness and efficiency of the adopted measures
Quantitative evaluation of achieved savings has been carried out with reference both to NEEAP 2011 objectives, related to the 2005‐2016 period, and to the National Energy Strategy (NES) objectives, related to the 2011‐2020 period, further revised in NEEAP 2014. In particular, the following measures have been analyzed:
Energy efficiency obligation scheme or White Certificates scheme: in the 2005‐ 2013 period, this tool contributed with a primary energy saving equal to 4.85
70 80 90 100 110 Total Manufacturing Industry Transport Residential
Mtoe/year (equivalent to 3.4 Mtoe/year of final energy). To reach this objective, both analytical and standard projects, and ex‐post calculation have been implemented. Both provided an almost equal contribution, but with a significant reversal trend in the relevance of the latter starting from 2010 (Table 2). Table 2 – Savings from White Certificates (primary energy, toe/year), years 2005‐2013 EE projects Total 2005‐2009 2010 2011 2012 2013 Total 2005‐2013 Standard and analytical 2,046,252 89,957 79,937 87,811 266,952 2,570,909 Ex‐post calculation 270,650 384,779 396,442 924,108 303,180 2,279,159 Total 2,316,902 474,736 476,379 1,011,919 570,132 4,850,068 Source: ENEA elaboration of data from the Authority for Electricity Gas and Water System (AEEGSI) and Gestore Servizi Energetici S.p.A. (GSE). 55/65% tax deductions for the energy upgrading of existing buildings: at 2013, the overall primary energy saving has been slightly higher than 0.91 Mtoe/year, equivalent to little more than 0.85 Mtoe/year of final energy (Table 3). IEA recently mentioned this measure as a best practice at international level, with specific reference to its role in the spreading of an energy efficiency culture at local level. Indeed, between 2007 and 2014, more than two millions of interventions have been realized, and at 2013 households had invested EUR 22 billion, with a cost of EUR 13 billion in terms of foregone fiscal revenue. Table 3 – Savings from 55/65% tax deductions (primary energy, Mtoe/year), years 2007‐ 2013 2007 2008 2009 2010 2011 2012 2013 Total Overall upgrading 0.006 0.014 0.010 0.004 0.003 0.003 0.006 0.045 Thermal insulation of the envelope 0.016 0.043 0.043 0.066 0.052 0.047 0.069 0.335 Electrical water heaters replacement 0.004 0.011 0.010 0.010 0.006 0.005 0.005 0.052 Efficient heating systems installation 0.023 0.053 0.054 0.083 0.055 0.047 0.057 0.371 Multiple actions 0.015 0.034 ‐ ‐ ‐ ‐ ‐ 0.049 Total 0.063 0.155 0.116 0.163 0.116 0.102 0.136 0.852 Source: ENEA
Heating & Cooling Support Scheme: since its implementation in July 2013 until November 2014, eligible beneficiaries submitted around 9,000 applications, among which more than 6,000 in 2014. Earmarked funds have amounted to more than EUR 22 million. Since most of the proposed projects are still in the realization phase, it was not possible to estimate the achieved energy saving.
Transposition of Directive 2002/91/EC and implementation of Legislative Decree 192/05 with reference to Minimum Efficiency Requirements for buildings: the
14
overall final energy saving has been 2.44 Mtoe/year, mainly deriving from the replacement of heating systems in residential buildings (Table 4).
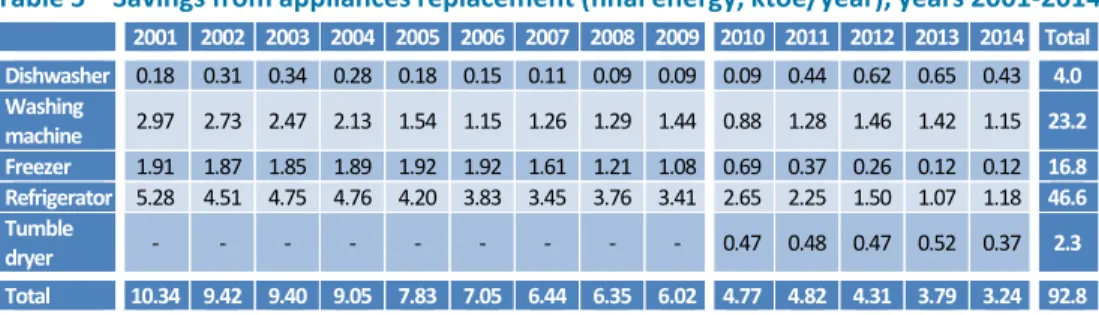
Table 4 – Savings from the implementation of Legislative Decree 192/05 (final energy, Mtoe/year), years 2005‐2013 2005 2006 2007 2008 2009 2010 2011 2012 2013 Total New buildings ‐ Residential 0.008 0.037 0.040 0.034 0.028 0.026 0.027 0.021 0.017 0.236 New buildings ‐ Services 0.019 0.019 0.041 0.031 0.040 0.035 0.027 0.019 0.231 Heating system replacement 0.270 0.277 0.255 0.250 0.237 0.251 0.223 0.207 1.970 Total 0.008 0.326 0.336 0.330 0.308 0.303 0.313 0.271 0.243 2.438 Source: ENEA elaboration on data from ISTAT and Assotermica Appliances replacement: in the 2001‐2014 period, the overall final energy saving associated to the substitution of existing appliances with more efficiency models amounted to about 93 ktoe/year (Table 5). Table 5 – Savings from appliances replacement (final energy, ktoe/year), years 2001‐2014 2001 2002 2003 2004 2005 2006 2007 2008 2009 2010 2011 2012 2013 2014 Total Dishwasher 0.18 0.31 0.34 0.28 0.18 0.15 0.11 0.09 0.09 0.09 0.44 0.62 0.65 0.43 4.0 Washing machine 2.97 2.73 2.47 2.13 1.54 1.15 1.26 1.29 1.44 0.88 1.28 1.46 1.42 1.15 23.2 Freezer 1.91 1.87 1.85 1.89 1.92 1.92 1.61 1.21 1.08 0.69 0.37 0.26 0.12 0.12 16.8 Refrigerator 5.28 4.51 4.75 4.76 4.20 3.83 3.45 3.76 3.41 2.65 2.25 1.50 1.07 1.18 46.6 Tumble dryer ‐ ‐ ‐ ‐ ‐ ‐ ‐ ‐ ‐ 0.47 0.48 0.47 0.52 0.37 2.3 Total 10.34 9.42 9.40 9.05 7.83 7.05 6.44 6.35 6.02 4.77 4.82 4.31 3.79 3.24 92.8 Source: ENEA elaboration on GfK data Transport sector (Table 6): a final energy saving equal to 0.19 Mtoe/year has been achieved by the incentives to the sustainable renovation of car and truck fleet (up to 3.5 ton) in the 2007‐2009 period; the EU Regulation 443/2009 has enabled a final energy saving of 0.6 Mtoe/year, equal to 70% of the total; the commissioning of high speed railways has implied a demand reduction on corresponding flight routes, with a final energy saving equal to 0.09 Mtoe/year up to 2013. Table 6 – Cumulative energy saving in transport sector (final energy, Mtoe/year), years 2007‐2013 2007 2008 2009 2010 2011 2012 2013 2007‐2009 incentives for new cars 0.03 0.06 0.19 0.19 0.19 0.19 0.19 Regulation EC 443/2009 0.15 0.30 0.44 0.60 Modal shift ‐ high speed railways 0.01 0.05 0.07 0.08 0.09 0.09 Total 0.03 0.08 0.24 0.40 0.57 0.72 0.87 Source: ENEA elaboration
For the 2005‐2016 time horizon, as in the 2011 NEEAP, total final energy saving deriving from analyzed measures amounts to more than 7.55 Mtoe/year, equal to 70% of 2016 objective. The main contribution comes from the residential and industry sectors, the latter having already exceeded its objective in 2012 (Table 7). Table 7 – Annual achieved energy savings by sector, 2005‐2013 period, and expected for 2016 (final energy, Mtoe/year) Legislative Decree 192/05 White Certificates 55/65% tax deductions Measures in transport sector Other measures Energy savings Achieved target (%) Achieved at 2013* Expected at 2016 Residential 2.206 1.463 0.790 0.093 4.451 5.161 86.2% Services 0.068 0.116 0.020 0.205 2.114 9.7% Industry 0.163 1.819 0.042 2.026 1.732 117.0% Transport 0.785 0.089 0.875 1.873 46.7% Total 2.437 3.399 0.852 0.785 0.182 7.556 10.880 69.4% * Net of duplications Source: ENEA elaboration
Relative to the objective for 2011‐2020 period as set in 2014 NEEAP, achieved energy savings up to 2013 have been equal to more than 3.2 Mtoe/year, equivalent to around 21% of the 2020 objective (Table 8). Half of such savings derives from the Withe Certificates scheme. At sectoral level, residential sector already achieved one third of the expected objective, industry more than one quarter. Table 8 – Annual achieved energy saving by sector, 2011‐2013 period, and expected for 2020 (final energy, Mtoe/year) Legislative Decree 192/05 White Certificates 55/65% tax deductions Measures in transport sector Other measures Energy savings Achieved target (%) Achieved at 2013* Expected at 2020 Residential 0.75 0.29 0.33 0.01 1.31 3.67 35.7% Services 0.02 0.04 0.01 0.07 1.23 5.6% Industry 0.06 1.28 0.02 1.36 5.10 26.6% Transport 0.45 0.02 0.47 5.50 8.6% Total 0.83 1.61 0.35 0.45 0.03 3.21 15.50 20.7% * Net of duplications Source: ENEA elaboration With respect to White Certificates, the analysis of a sample of ex‐post calculation projects showed a cost‐effectiveness equal to 0.017 €/kWh, seven times lower than the tax deductions average. Within this scheme, global renovation is the most cost‐effective measure (Table 9).
16 Table 9 – Cost‐effectiveness of the implemented incentive measures Investment (M€) Lifetime (years) Annual investment (M€/year) Achieved savings (GWh/year) Cost‐ effectiveness (€/kWh)
White Certificates n.a. 10 n.a 39,530 0.017
55/65% tax deductions Overall upgrading 785 20 39 527 0.074 Thermal insulation 11,800 20 590 3,894 0.152 Heating system 6,417 12 535 4,319 0.124 Weighted average 0.124 Source: ENEA elaboration In recent years, construction sector has benefitted from the positive contribution of building maintenance branch (ordinary, but mainly extraordinary), which has mitigated the economic crisis impacts. Indeed, around 67% of the cumulated value added of construction sector in 2013 is associated to maintenance interventions on the existing building stock, and the percentage is steadily growing.
Relative to the overall renovation of the building stock, energy upgrading was the goal of 26% of the implemented projects within residential buildings, and of 18% of all the interventions within both residential and services buildings. In 2013, such amount of interventions enabled around EUR 4 billion of investments, to which 40,000 direct employees and 60,000 in total are yoked. Taking into account the whole 2007‐2013 period, an employment impact of 271,000 direct employees and 406,000 in total is assessed, having a strong acceleration in the last two years. Such values are even more significant considering that in 2013 the construction sector lost around 163,000 employees.
Moreover, these figures could be underestimated since the total number of incentivized projects in 2013 represented less than half of total building renovation interventions. Besides, the potential related to resources from the 2014‐2020 European funds should be also considered. 5. Renovation of the building stock In order to comply with the EED relative to the renovation of the stock of public buildings, the Legislative Decree 102/2014 foresees sectoral plans for energy efficiency. An important plan is devoted to the Energy Upgrading of Central Public Administration, together with the Strategy for the Energy Upgrading of the National Stock of Buildings, aimed at mobilizing investments, and the National Plan for Nearly Zero Energy Buildings.
In order to elaborate such programming tools, an evaluation of the consistency of the national stock of buildings has been performed, together with an estimation of the energy
saving potential related to a predefined set of energy upgrading measures. This potential would have to be realized through normative tools and incentives, both currently in force and planned, with the aim of reaching national energy saving objectives set in NEEAP 2014. Such evaluation highlighted the need to strengthen existing tools in order to overcome the barrier to investments in building energy efficiency. In particular, thanks to global and partial interventions on different building typologies, an overall potential energy saving equal to 49,000 GWh/year of final energy has been estimated at 2020, equivalent to 3.71 Mtoe/year. To achieve this objective, it would be needed to upgrade more than 170 million m2 of floor area per year (Table 10).
Table 10 – Potential of final energy saving in the residential sector, years 2014‐2020
Building type
Intervention on building Unit energy saving (GWh/year) Total energy savings at 2020
Type Upgraded floor area (m2/year) Roof Facad e W indo ws Heating system Overall upg ra di n g GWh/year Mtoe/year Single family Partial 39,407,808 221 132 83 265 4,907 0.42 Global 26,551,030 2,230 15,610 1.34 Multi‐family Partial 79,141,300 253 475 253 658 11,473 0.50 Global 25,142,222 2,414 16,898 1.45 Total floor area 170,242,360 Total Energy savings 48,888 3.71 Fonte: NEEAP 2014 Concerning the services sector, a mix of the aforementioned interventions was considered, as well as their climatic characteristics, destination of use and cost/benefits ratio. The overall final energy saving can be quantified in 1.5 Mtoe/year, considering a yearly renovated floor area equal to 16 million m2. In particular, it can be foreseen that one third of the energy saving is achieved in public schools (Table 11). Table 11 – Potential of final energy saving in the services sector, years 2014‐2020 Type of building Upgraded floor area (m2 /year) Total energy savings at 2020 GWh/year Mtoe/year Private office 2,880,000 2,858 0.25 Public office 2,640,000 3,881 0.33 Hotel 1,425,000 1,167 0.10 Private school 1,000,000 617 0.05 Public school 4,950,000 5,821 0.50 Bank 782,811 726 0.06 Shopping centre 2,289,163 2,159 0.19 Total 15,966,974 17,229 1.49 Fonte: NEEAP 2014
18
Speaking about energy efficiency of Public Administration buildings, lack of knowledge and scarce use of automation, remote management and control systems, and of proper and efficient lighting have been observed. Table 12 summarizes, for the described technologies, the main technical and economic parameters characterizing investment opportunities. Table 12 – Economic parameters for technological investments in Public Administration
Technology Investment Payback period with NO incentives
Payback period with incentives Building automation EUR 15,000 5 years 3 years
Efficient lighting EUR 70,000 Less than 5 years 2‐3 years
Heat pumps EUR 500,000 More than 10 years 4‐5 years
Source: Energy & Strategy Group
To support building upgrading plans, ENEA recently elaborated the guidelines for implementing national legislation on operation, maintenance and control of building heating systems. The document deals with procedural issues, which involve relevant users and authorities, in particular related to transmission of energy efficiency reports, inspections, behavioral standards and obligations for persons in charge of the heating systems and inspectors.
Besides, Covenant of Mayors (CoM) could play a key role. Indeed, Italy is the first country for number of signatories, coordinators and supporters to this voluntary initiative devoted to local bodies (at March 2015, 3,028 out of 5,714). All Italian major cities are among CoM signatories, and 2,400 Italian municipalities have already adopted a Sustainable Energy Action Plan (SEAP).
As national coordinator, ENEA constituted the Forum of Italian Coordinators of Covenant of Mayors to share best practices and support municipalities in periodic publication of reports on the implementation status of plans and related intermediate results. The goal is to make SEAP not only a long‐term plan able to integrate the most appropriate, efficient and cost‐ effective policies developed in different sectors, but rather a tool to hasten energy transition. To this aim, ENEA has encouraged the elaboration of joint SEAPs, adopting shared and homogeneous frameworks, from the technical, administrative and financial point of view, taking into account also other reference tools such as 2014‐2020 structural funds, Horizon 2020, funds from European Investment Bank and national and regional funds.
6. The energy efficiency market and available financial tools
Together with Confindustria, ENEA has investigates the supply of energy efficiency products and services among Italian enterprises, involving 43,000 employees, 11,000 of which
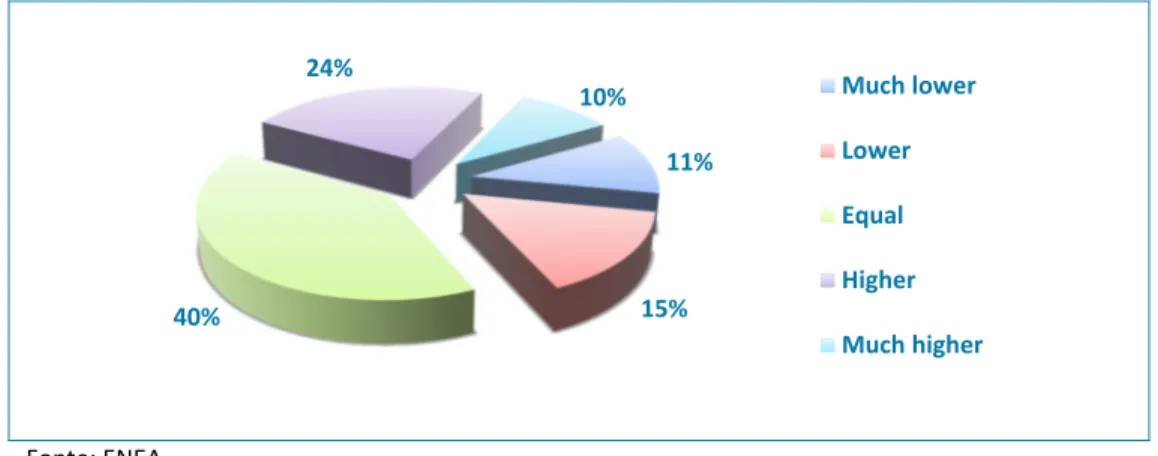
specialized in an energy efficiency activity. The expectations for next triennium seem to be good, namely 33.6% of companies plan to increase their investments with respect to the previous three‐year period (Figure 7).
Figure 7 – Investment expectations for the next triennium, relative to the previous triennium Fonte: ENEA Transparency is a fundamental feature of energy efficiency policies, in terms of clarity of rules, simplification of procedures and stability of available financial resources (Figure 8). Figure 8 – Opinion on policy characteristics and some implemented measures (multiple choice, score from 1 to 5) Source: ENEA
The interviewed ESCOs confirm the relevance of transparency and consider the implementation of the widely used White Certificate Scheme very important. Investment 11% 15% 40% 24% 10% Much lower Lower Equal Higher Much higher 0 1 2 3 4 5 Heating & Cooling Support Scheme Interest subsidies Availability of qualification schemes Capital grants Financial support to training activities 55/65% Tax deduction scheme White Certificates Scheme Awareness and information campaigns Financial stability Bureaucracy simplification Clarity of rules
20
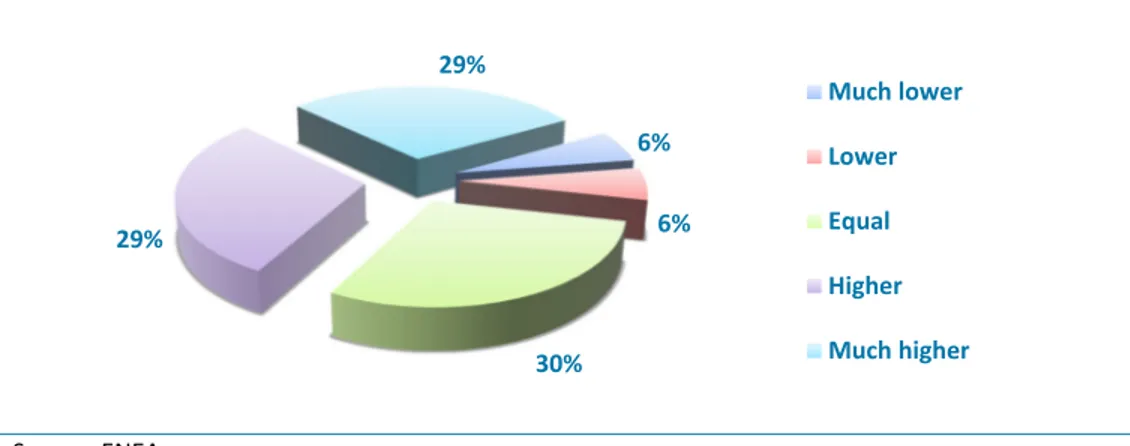
expectations are better than the sample average, showing a growth for almost 60% of them (Figure 9).
Figure 9 – Investment expectations of ESCOs for the next triennium, relative to the previous triennium
Source: ENEA
The AGICI study on utilities highlights that they are widening their supply towards additional post meter services, such as distributed generation, thermal renewables, efficiency of electric and heating systems, energy saving goods and insurance services.
Relative to residential market, the production chain for widening the supply is consistent with the existing energy supply, particularly in the case of energy saving goods such as LED, TV, electric bikes. Other businesses have relatively higher potential and attractiveness, but require specific competences, as in the case of installation/maintenance of electric and distributed generation systems. In the industry market, the most attractive business is certainly the distributed generation, not showing any specific difficulty since the dimension of new installations is comparable to that of installations already managed by most of the utilities for electricity generation. To the aim of fully exploiting such a potential, both on the utilities and companies side, the crucial issue is related to the project financing capacity. According to a study conducted by ABI Lab, 86% of financial institutions proposes specific products for energy efficiency. Notwithstanding this relatively high availability of tools, the adoption of “traditional” loans is still prevailing, showing a wide growth margin for the Italian market.
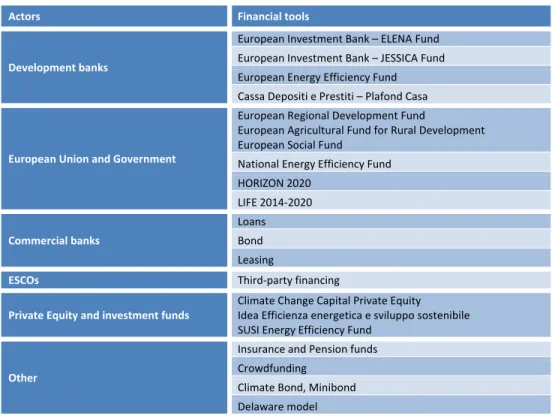
Indeed, a wide range of financing actors and tools is available, and new channels are starting to be adopted beside existing ones, using newly conceived tools, such as crowdfunding
(Table 13). 6% 6% 30% 29% 29% Much lower Lower Equal Higher Much higher
Table 13 – Financing actors and available tools
Actors Financial tools
Development banks
European Investment Bank – ELENA Fund European Investment Bank – JESSICA Fund European Energy Efficiency Fund Cassa Depositi e Prestiti – Plafond Casa European Union and Government European Regional Development Fund European Agricultural Fund for Rural Development European Social Fund National Energy Efficiency Fund HORIZON 2020 LIFE 2014‐2020 Commercial banks Loans Bond Leasing ESCOs Third‐party financing Private Equity and investment funds Climate Change Capital Private Equity Idea Efficienza energetica e sviluppo sostenibile SUSI Energy Efficiency Fund Other Insurance and Pension funds Crowdfunding Climate Bond, Minibond Delaware model Source: ENEA elaboration on data from AGICI Finanza d’Impresa Several barriers hamper to resort to “alternative” financial tools, among which: • Bureaucracy. • The high minimum amount to be requested for public financing: also European funds promote large‐scale projects. • The long time needed for negotiation and market positioning of minibond, as well as management difficulties. • Specific technological conditions excessively linked to leasing granting.
In general, the characteristics of bank loan are little in line with peculiarities of energy efficiency, since the credit worthiness is the main granting criterion. Relative to this issue, the stakeholders very favorably welcomed the National Fund for Energy Efficiency. 7. Information and training Communication certainly has a key role for spreading an energy efficiency culture. A joint effort is needed in order to make energy saving perceived as the first and most important tool, able to extend the lifetime of currently adopted “traditional” systems, and to allow the
22 development of structural renewables‐oriented solutions. Increasing consumer awareness would imply around 20% of energy savings, achievable thanks to behavioral changes; that is without any specific technological installation.
In 2014, the ENEA initiative States‐General of Energy Efficiency has triggered a fruitful debate among institutions, agencies, companies, and public and private actors. More specifically, it highlighted the excellences and the problems of our systems, providing the appropriate environment for exchanging views on the measures that Italy is going to adopt in the European and international context. Besides a positive opinion on the effectiveness of the measures included in the Legislative Decree 102/2014, the initiative also highlighted several priorities: • The simplification of the taxation rules and procedures, in particular relative to labour market and public works.
• The removal of the barriers to investments financeability of energy efficiency projects.
• The fundamental role of communication to provide consumers with more and more complete information. Relative to this last priority, in order to elaborate effective policies, mainly in the residential sector, behavioral economy and psychology principles should be taken into account. Energy efficiency behavioral programmes already embody such principles, on which many utilities, active both in regulated and non‐regulated markets, are investing. These programmes aim to reach different customers profiles: on a percentage basis, low‐income customers save at least the same energy than other customers, in some cases even more (Figure 10). Figure 10 – Energy savings from energy efficiency behavioral programmes Source: Opower
Behavioral economies principles can help both ensuring a good level of customer information, and providing training for real estate operators. Relative to this market, 2014 data show that energy class G is still prevailing; sales of properties belonging to the first four energy class (A+; A; B and C) represent a market share between 10% and 14% (Figure 11). Figure 11 – Properties sold by energy class and typology (%), year 2014 Source: I‐Com elaboration on FIAIP data It is worth mentioning the market signal provided by high quality properties (although they represent a low share of the total), for which the sales of A+ and A class changed from 6% in 2013 to 10% in 2014. The energy efficiency potential is very high: in 2014, almost 90% of sales is constituted by G class properties.
Although the buyers awareness about the energy quality of properties seems to be increasing, data on the Energy Performance Certificates (EPCs) are less encouraging. Indeed, EPCs are not considered a useful tool in 60% of cases, even if EPCs are spreading all over the country. The total number of EPCs in Italy is 3.7 million, 90% of which are relative to Northern regions.
The current EPCs quality is not always satisfying, and a homogenization of both different classifying and compliance check systems adopted in different regions is necessary. A further promotion of EPCs would stimulate a critical analysis of collected data, orienting the definition of national and local policies for energy upgrading. As already highlighted, the potential of energy efficiency renovation in the building sector is high, also in terms of employment effects. Data show that low professional profiles of employees are predominant within the construction sector. Thus, the acquired expertise is often not recognized. This trend could be reversed thanks to specific training and formation programmes, able to qualify new emerging professional profiles. 0% 20% 40% 60% 80% 100% A+ A B C D E F G Studio flat Two‐room flat Three‐room flat Semi‐detached house Detached house Other
24
Labour policies in the energy efficiency sector play a key role: European Commission estimates 9 million employees in the low carbon sectors, and 5 million new employees in 2020. Strengthening current training initiatives would be needed in order to cope with the increasing competitiveness for qualified human resources. Italy has a relatively disadvantaged starting point, being the last country in the EU28 for tertiary education of young people between 30 and 34 years. Moreover, Italy is followed only by Greece and Croatia for the employment rate of young graduates. It is clear that current education and training system would need to be modified, through new learning methods and more coordination among the academic environment, research institutions and companies.
8. Sustainability and competitiveness of the agro‐food system
The challenges of food production are enormous and would become more and more serious due to the steady increase in world population and the corresponding growth in food demand. To increase food production and at the same time, to reduce impacts of agriculture on the environment, new sustainable production methods would need to be identified and adopted. In particular, new technologies need to be applied to increase the efficiency of primary systems, ensuring high quantity, good quality and safety of food, and avoiding environmental pollution mainly caused by the high use of chemicals and fossil energy. The Green Economy paradigm should be used, adopting a multidisciplinary perspective and an integrated approach, considering not only primary food production, associated to agriculture, industrial transformation and distribution, but also energy issues and the environment with its social and cultural values. Furthermore, the food production is more and more linked with the request of healthy food products due to the changing habits of consumers.
Thus, sustainable agriculture, protecting or improving soil fertility, contributing to the recycling and reutilization of food chain waste, favoring renewable energy production and recovering marginal land, is the most appropriate choice to ensure food availability. Sustainability is not only a fundamental requirement, but also a relevant growth opportunity. In this sense, “sustainable competitiveness” is the objective of agricultural policies in the next future.
In order to preserve the competitiveness both on domestic and international markets, environmental sustainability is a fundamental choice for the whole Italian agro‐food system, which represents an economic value equal to EUR 250 billion. In 2013, the food industry had a turnover of EUR 132 billion, with around 400,000 employees and 55,000 companies. After manufacturing, it is the second industry sector in Italy, and one of few sectors having shown an anticyclical trend, thanks both to the high appreciation of our goods on
international markets, and to good significant capacity, elements which allow to provide consumers with competitive, quality and safe products. Agro‐food production is more and more oriented towards quality goods, obtained according to environmental protection rules. The innovation in the agro‐food chain has contributed to the success of Italian products, and companies are subject to rigorous controls to certify their wholly Italian production cycle. Unfortunately, EU legislation on geographic origin of raw materials is still incomplete, and most often it allows import of food products from abroad which uses inappropriately the label “100% made in Italy”. Italy is also the first exporter of biological products at world level, with sales for EUR 900 million, and is also among the first countries in terms of biological cultivations area (almost 1 million of hectares), number of companies (almost 50,000 employees) and production of biological legumes, cereals, citrus, grapes and olives. It is worth mentioning that biological agriculture consumes on average one third less energy per unit of product than conventional agriculture, thanks to the use of less intensive tools and techniques, and to local sales channels. Realizing energy efficiency interventions in the cultivation phase mainly implies a reduction in the utilization of mechanical equipment or a more rational use of technical equipment. Precision agriculture is a technologically advanced technique, where machines allow optimal soil management, and thus play a key role in terms of reducing direct and indirect energy inputs. Several measures can increase energy efficiency in food industry, for example by assessing the potential for cogeneration, tri‐ and poli‐generation or diversification of energy supply, and increasing the amount of renewable energy produced both internally and externally to the system. Another relevant issue is related to waste: in Europe, millions of tons of food are wasted every year, and according to FAO this corresponds to almost one third of the food totally produced and distributed. In Italy, in 2010, considering agricultural production losses of 1.5 million tons (equal to 3.2% of total production), and a total energy consumption slightly higher than 3 Mtoe, the ENEA estimation of energy cost of vegetable products waste is around 0.1 Mtoe, and the one associated to waste in vegetable food industry is around 0.18 Mtoe.
Finally, energy efficiency interventions should involve the Total Retail Market, where transport and storage in a climatically controlled environment imply a large energy consumption. According to ENEA data, electricity consumption related to commercial services surface of 3,100 hectares is equal to 4.5 Mtoe, against a turnover of EUR 116 billion.
26
All these solutions imply a deep change in our way of thinking: the participation process started by the Universal Exposition Expo Milano 2015 around the subject Feeding the Planet, Energy for Life, represents a great opportunity for improving the dialogue, debate and education around nutrition, food, and rational and efficient energy use. Authors Anna Amato, ENEA Mauro Annunziato, ENEA Antonello Antonicelli, Regione Puglia Giovanni Bartucci, Bartucci SpA Rossano Basili, ENEA Massimo Beccarello, Confindustria Ermira Behri, FILLEA Mauro Bellone, ARTI Puglia Ilaria Bertini, ENEA Silvestre Bertolini, GfK Italia Lorenzo Bertuccio, Euromobility Damiano Biagiotti, Tuscia University Enzo Bianco, Mayor of Catania Flavio Borfecchia, ENEA Luigi Bosco, Municipality of Catania Didier Bosseboeuff, ODYSSEE‐MURE Project François de Brabant, Between ‐ Ernst&Young Mauro Brolis, Finlombarda SpA Emanuela Caiaffa, ENEA Giovanni Campaniello, Avvenia Carlo Alberto Campiotti, ENEA Americo Carderi, ENEA Marco Carta, AGICI Piergiorgio Catoni, ENEA Marco Chiesa, Energy & Strategy Group Vittorio Chiesa, Energy & Strategy Group Linda Cifolelli, ENEA Rossella Colletta, ENEA Nicola Colonna, ENEA Valentina Conti, ENEA Ezilda Costanzo, ENEA Stefania Crotta, Regione Piemonte Franco D’Amore, Institute for competitiveness
Giuseppina Del Signore, ENEA Anna Sofia Delussu, Santa Lucia Foundation Pasquale Di Franco, ENEA Alessia Di Gaudio, Italian Federation for Energy Efficiency Gianluca Di Pasquale, Between ‐ Ernst&Young Dario Di Santo, Italian Federation for Energy Efficiency Antonio Disi, ENEA Stefano Faberi, Institute of Studies for the Integration of Systems Gaetano Fasano, ENEA Mauro Fasano, Regione Lombardia Marco Fasciolo, Grandi Navi Veloci SpA Alessandro Federici, ENEA Cinzia Felici, Consul System SpA Simone Franzò, Energy & Strategy Group Enzo Frasio, GfK Italia Carlo Gadaleta Caldarola, ARTI Puglia Giuseppe Garofalo, Tuscia University Agime Gerbeti, Gestore Servizi Energetici SpA Germina Giagnacovo, ENEA Giuliana Giovannelli, FILLEA Giulia Gioffreda, Opower Laura Gaetana Giuffrida, ENEA Alessandra Graziani, FILLEA Giulio Guarini, Tuscia University Micaela Iaiani, Italian Federation for Energy Efficiency Massimo Iannetta, ENEA Marta Iannucci, Between ‐ Ernst&Young Giulia Iorio, ENEA Arianna Latini, ENEA Benoit Lebot, IPEEC Maria Lelli, ENEA Michele Loi, Tholos Roberto Maldacea, Euromobility Laura Manduzio, ENEA Mauro Marani, ENEA Antonia Marchetti, ENEA Amalia Martelli, ENEA Maurizio Martina, Minister of Agricultural, Food and Forestry Policies Chiara Martini, ENEA Marco Mena, Between ‐ Ernst&Young Gabriella Messina, ENEA Andrea Molocchi, ECBA Project Roberto Moncalvo, Coldiretti
28 Roberto Moneta, ENEA Anna Moreno, ENEA Paolo Morgante, ENEA Fabio Musmeci, ENEA Gabriele Nanni, Legambiente Mario Nocera, ENEA Silvia Orchi, ENEA Francesco Pacchiano, ENEA Rosella Panero, Italian National Association for Telematics for Transport and Safety Loriana Paolucci, University Consortium of Managerial and Industrial Economics Emanuela Peruzzi, Gestore Servizi Energetici SpA Emanuele Piccinno, University Consortium of Managerial and Industrial Economics Nicola Piccioni, Institute of Studies for the Integration of Systems Francesca Pietroni, University Consortium of Managerial and Industrial Economics Giuseppe Piscopo, Legacoop Agroalimentare Maurizio Pollino, ENEA Francesca Pozzar, Friuli Innovazione Domenico Prisinzano, ENEA Giorgio Recanati, ABI Lab Chiara Riso, Between ‐ Ernst&Young Dominique Ristori, European Commission Giovanni Riva, Comitato Termotecnico Italiano Sara Romano, Ministry of Economic Development Patrizia Rutigliano, Italian Federation of Public Relations Anna Maria Sàlama, ENEA Domenico Santino, ENEA Matteo Scoccianti, ENEA Luigi Pio Scordamaglia, Federalimentare Monica Tarquini, FORMEZ PA Robert Thaler, European Platform on Mobility Management Giuseppe Tomassetti, Italian Federation for Energy Efficiency Maria Cristina Tommasino, ENEA Gaetano Valenti, ENEA Maria Pia Valentini, ENEA Davide Valenzano, Gestore Servizi Energetici SpA Maria Van der Hoeven, IEA Corinna Viola, ENEA Edoardo Zanchini, Legambiente Printed in Italy by ENEA August 2015