2. ELASTIC SCATTERING
In this chapter will be presented the experiments concerning the 6,7Li+64Zn elastic scattering and the associated data analysis. As mentioned in paragraph 1.7, in collisions involving weakly bound nuclei the trend of the optical potential with the energy can be very different from the usual behavior observed in collision involving tightly bound nuclei. The low binding energy effect on the TA can be studied by measuring the elastic scattering angular distribution at several energies around the Coulomb barrier and fitting the data with an OMP. The experimental setup used for the angular distribution measurement and the relating OM analysis will be described in this chapter. The elastic scattering is also used to extract the total reaction cross-section that, compared with the complete fusion cross-section, allows the evaluation of the non-fusion processes relevance in the collision.
2.1 Experimental setup
The measurements for both the 6,7Li+64Zn systems have been performed using the CT2000 scattering chamber at LNS with the 6Li and 7Li beams delivered by the SMP Tandem Van de Graaff accelerator. The experimental setup is shown in fig. 2.5 – 2.6 and it is the same for the measurements of both systems apart from small differences that will be discussed in this paragraph.
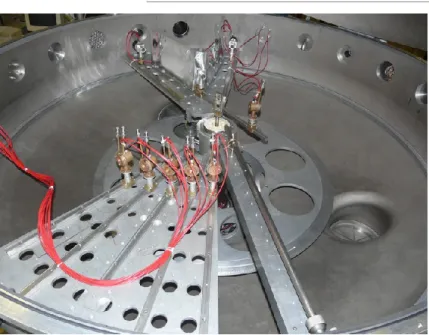
Fig. 2.5: The experimental setup schematically represented for
the elastic scattering angular distribution measurement for both 6,7Li+64Zn systems. Two monitors are placed at small angles for normalization purposes and an array of five telescopes rotates around the 64Zn target. See the text for details.
Fig. 2.6: The experimental setup for the elastic scattering angular
distribution measurement for both 6,7Li+64Zn systems. Two monitors are placed at small angles for normalization purposes and an array of five telescopes rotates around the 64Zn target. See the text for details.
A multiple target holder vertically movable has been placed at the center of the scattering chamber. At four different positions have been mounted: an empty frame for beam focusing, a 425 μg/cm2 thick 64Zn target, a 145 μg/cm2 197Au target to detect the Rutherford scattering and extract the relative solid angle for the detectors and a 120 μg/cm2 thick 64Zn target evaporated onto a 20 μg/cm2 C backing. The 64Zn target thickness in the case of 7Li projectile has to be smaller with respect to the one used in the case of the 6Li. In fact, contrary to the 6Li which do not have bound excited states, the 7Li nucleus has a bound excited state at E = 478 KeV, therefore the energy spread introduced by the target thickness must be reduced in order to separate the inelastic scattering events leaving the 7Li in its first excited state. To allow measurements at angles close to 90°, the target has been tilted by ±45° depending on the detectors positions. The beam energies were in the range 11<Elab<23 MeV and have been corrected for the energy loss in half the target. These corrections, in the center of mass system, were in the range ΔECM=0.13÷0.20 MeV, depending on the beam energy and target thickness. The beam has been defined by a circular collimator with a diameter of 1 mm and a rectangular aperture variable from 2×2 mm2 to 3×3 mm2. This rectangular aperture has been created by a system of slits located 156 cm upstream of the target. The circular collimator has been placed 7.3 cm upstream the target.
Outgoing charged particles have been detected and charge identified by an array of 5 silicon telescopes. Each of them consists of a 10 μm ΔE stage followed by a 300÷450 μm
E stage. Using telescopes it has been possible to discriminate the scattered 6Li and 7Li ions from lighter particles (mainly He ions) produced by other reaction channels. In addition, events corresponding to the excitation of the target, the excitation of the bound 478 KeV state of 7Li, the scattering on the Carbon backing and all other non-elastic reactions have been separated from the elastic scattering events.
The telescopes have been mounted on a rotating support with an angular separation of 10° between adjacent detectors and a distance of 350÷450 mm from the target. For angular definition, circular collimators with diameters of 6÷7 mm, corresponding to an angular aperture of 0.7°÷0.9°, have been placed in front of each telescope. As already mentioned in the paragraph 1.7, measuring the elastic scattering angular distribution at very backward angles is important to extract the energy trend of the OMP. In fact, at low energies only in this angular region the elastic cross-section presents a deviation from the pure Coulomb one. For this reason the experimental setup has been arranged to reach a maximum angle of θlab≤170° with an overall covered angular range of 15°≤ θlab ≤170°.
The measure of the elastic scattering angular distribution is a difficult task because at low energies even at very backward angles the pure Coulomb contribution is dominant so it is necessary a precision of the order of 1%. Slight changes in the beam spot position or beam angle can lead to significant errors in the elastic scattering data. For normalization purposes, two additional telescopes have been mounted symmetrically at θlab=±15° and at a distance of 770 mm from the target. Each of them had an angular opening of ~0.15°, defined by 2-mm-diameter collimators.
The acquisition electronic chain is sketched in fig. 2.7. The E and ΔE signals from the telescopes and from the monitors have been treated by charge preamplifiers then shaped and amplified by the programmable 16-channels amplifiers. These last ones also provided a timing signal for each channel.
Fig 2.7: The electronic chain used to process and acquire the signals from the
detectors. See the text for details.
All timing signals from the seven E stages have been discriminated and a total OR of the outputs has been built to give the valid event signal for the acquisition. Two discriminator outputs, corresponding to the E signal from monitor1 and telescope1, have been also used to monitor the rate by two counters. A scaler has been used to check the acquisition dead time by the difference between the total number of valid events and the acquired ones. The scaler has been furthermore used to count the output of the current integrator, which has been set at 10 Coulomb/pulse. A latch in manual mode has been used to start the acquisition and the scaler at the same time by vetoing both of them.
2.2 Extraction of the elastic scattering angular distributions
As already mentioned in the previous paragraph, the use of telescopes in the elastic scattering measure is important to distinguish the elastic events from the other ones. Each ΔE-E matrix built using data from the telescopes shows the elastic peak and the distributions from all the other non-elastic reactions in localized positions. An example ΔE-E matrix is shown in fig. 2.8.
Fig. 2.8: An example on-line ΔE-E matrix for the elastic scattering of
the 6Li+64Zn collision. The two lower regions corresponds to H and He ions and have been neglected. The upper curve corresponds to 6Li ions. In the right extreme of this curve there is the elastic peak followed, moving to the left, by peaks corresponding inelastic events.
At small angles, where the monitors have been placed, the scattering is assumed to be purely of the Rutherford type. In this case the known value of the Rutherford cross-section can be used to renormalize the measured data to the absolute values.
Performing a Rutherford scattering on the Au target it is possible to determine the ratio between the solid angle of each telescope and the monitor one. The ratio obtained in this way can be used to renormalize data in order to take to account the solid angles. Summarizing these procedures, the ratio between the elastic scattering on 64Zn target and the Rutherford cross-section is obtained by the expression
d
eld
Ruth
tel
N
tel
telN
mon
mon
dRuthmon d dRuth tel d
N
mon Au
mon
N
telAu
tel
dRuth tel d
Au dRuthmon d
Au (2.1) where
N
monAu
mon
N
telAu
tel
dRuth tel d
Au dRuthmon d
Au
mon
tel (2.2)Nmon(θmon) and Ntel(θtel) are respectively the number of events detected in the monitor
detector at angle θmon and the number of events detected in the telescope at angle θtel.
ΔΩmon and ΔΩmon are the solid angles corresponding to the monitor and the telescope
respectively. The superscript Au refers to the Rutherford scattering on gold target 6,7Li+197Au. The normalization run (Rutherford scattering) has been performed for each position of the rotating plate immediately after (or before) each elastic scattering run, without moving the telescopes between the two operations. The beam position has been monitored by comparing the spectra at θlab=±15°. To minimize the effects of the systematic beam misalignment, the measurements at the lowest energies have been performed twice, mounting the telescopes on opposite sides (left and right) with respect to the beam direction. The number of events Nmon(θmon) in equation (2.1) is the average value between
the left and right monitors.
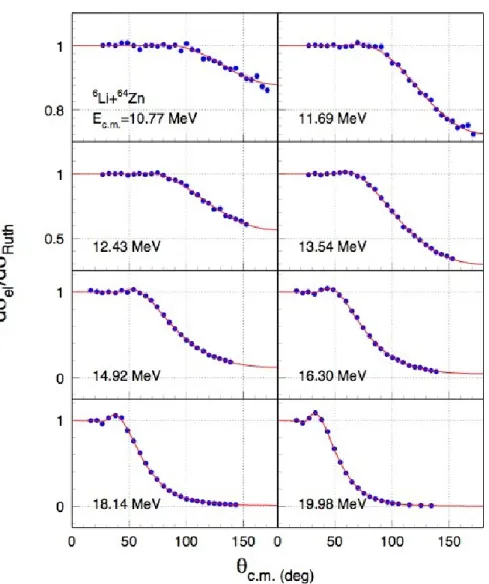
The elastic scattering angular distributions for the system 6Li+64Zn obtained following the above described procedure are shown in fig 2.9.
Fig. 2.9: Elastic scattering angular distributions for the 6Li+64Zn collision for several beam energies. The curves have been obtained by integrating the elastic peak in the ΔE-E matrix for each angle and energy then renormalizing the results by the procedure explained in the text. The solid line is drawn using the best-fit parameters as described in paragraph 2.4.
2.3 Optical model fits and results
The elastic scattering angular distribution best fit has been performed using two different model potentials:
(a) The renormalized Double Folding (DF) potential of eq. 1.19 for both real and imaginary part of the OMP.
(b) The renormalized double folding potential of eq. 1.19 for the real part of the OMP and the Woods-Saxon potential of eq. 1.18 for the imaginary part of the OMP. The calculations have been carried out using the code FRESCO [72] with a OMP of the form:
VOM
r VC
r N
R i NI
V r
(2.3) in the case (DF) whereas in the other case is of the form:
VOM
r VC
r NRV r,...
V0VIWS
r (2.4)In the above equations VC(r) is the Coulomb potential, NR and NI the normalization factors
for the real and the imaginary part of the Double Folding potential V(r), V0 the Woods-Saxon potential depth and V0VIWS(r) the imaginary Woods-Saxon potential.
For the effective nucleon-nucleon interaction VNN of the eq. 1.19 has been used the M3Y-Reid interaction [73]. The densities of 6Li and 64Zn have been computed from their charge distributions by assuming that the neutrons and the protons are similarly distributed [48]. The Coulomb potential VC(r) has been evaluated by folding directly the charge
distributions. The charge distribution for 6Li and 7Li has been taken from refs [74,75] whereas for the charge distributions two different charge distributions have been used for 64Zn:
(DF1) a two-parameters Fermi (2pF) distribution [76,77] (DF2) a three-parameters Gaussian (3pG) distribution [77]
Hence, in the data analysis, four different fitting procedures have been performed using the potentials:
(a)-DF1 where both the real and the imaginary part of the OMP are double folding potentials with the 2pF distribution.
(a)-DF2 where both the real and the imaginary part of the OMP are double folding potentials with the 3pG distribution.
(b)-DF1WS where the real part of the OMP is a double folding potential with the 2pF distribution whereas the imaginary part is a Woods-Saxon potential. (b)-DF2WS where the real part of the OMP is a double folding potential with the 3pG
distribution whereas the imaginary part is a Woods-Saxon potential. As a first step of the (b)-DF1 and (b)-DF2 analysis, data for the three highest energies (18, 20 and 22 MeV) where analyzed fixing the radius parameter of the imaginary potential at the value RI = 1.3(61/3+641/3) = 7.56 fm and the diffuseness parameter at a = 0.715 fm. Subsequently, the fits for different energies have been performed using this fixed geometry of the WS imaginary part.
In the calculations with the DF1 and DF2 potentials the normalization factors NR and NI
fits with the DF1WS and DF2WS potentials the parameters NR and V0 were free. The results for the DF1 calculations are shown in fig. 2.9.
The Coulomb barrier for the considered system has been calculated using the best-fit parameters of the optical potentials for the highest measured energy, Elab = 22 MeV, as the maximum of the real nuclear potential plus the Coulomb potential. This value has been found to be VB = 13.22 MeV.
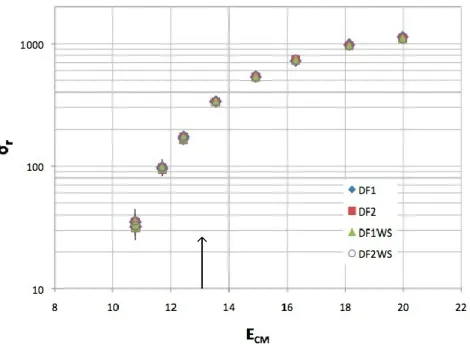
Fig 2.10 shows the total reaction cross-sections extracted from the optical model analysis by the four used OMPs. The resulting total reaction cross-sections from the four best-fit procedures agree within 4% at the higher energies and up to ~ 10% for the lowest energy. The total reaction cross-sections values are therefore almost the same independently by the used potential.
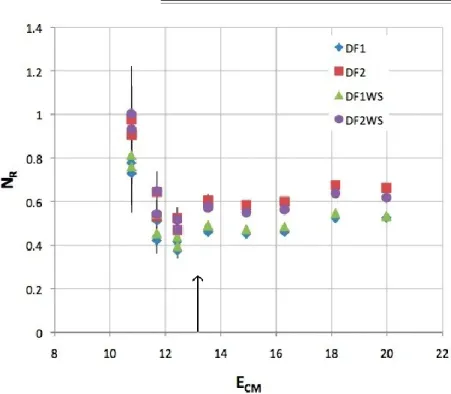
Figures 2.11-a and 2.11-b show the energy dependence of the real NR and imaginary NI renormalization factors (in the case of DF1 and DF2) and the potential depth W0 (in the case of Woods-Saxon potential). The error bars represent the change in the parameter value that produces a variation of the 2 value by one unit: 2 2+1.
Fig. 2.10: Total reaction cross-section derived from the elastic
scattering data using all the optical model potentials. DF1WS and DF2WS are referring respectively to the potentials DF1 and (b)-DF2. The arrow indicates the position of the calculated Coulomb barrier.
Fig. 2.11-a: Normalization factor for the real part of the OMP
derived from the elastic scattering data using all the optical model potentials. DF1WS and DF2WS are referring respectively to the potentials (b)-DF1 and (b)-DF2. The arrow indicates the position of the calculated Coulomb barrier.
Fig. 2.11-b: Normalization factor NI and potential depth V0 for
the imaginary part of the OMP derived from the elastic scattering data using all the optical model potentials. DF1WS and DF2WS are referring respectively to the potentials (b)-DF1 and (b)-DF2. The arrow indicates the position of the calculated Coulomb barrier.
Observing figure 2.11-b one can notice that at energies near the Coulomb barrier the imaginary potential increases slightly as the projectile energy decreases and then starts to decrease. In figure 2.11-a in the same energy region the real potential shows a small dip and then increases. This behavior is in contrast to the usual TA found in the case of tightly bound nuclei and is consistent with the presence of the break-up TA observed for 6Li scattering on different targets.
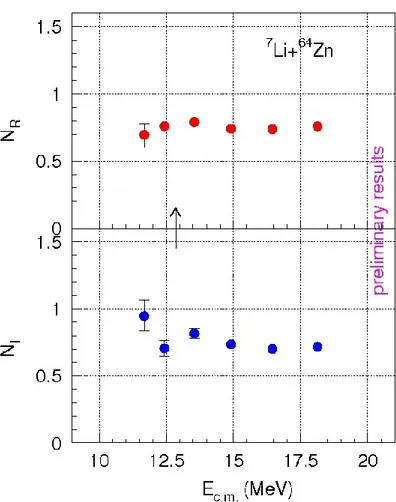
The data analysis for the 7Li+64Zn scattering is still in progress. In fig 2.12 is shown the preliminary trend of the real and imaginary renormalization factors NR and NI of the DF
potential. Again, these preliminary results apparently show absence of the usual TA for the 7
Li+64Zn collision.
Fig. 2.12: preliminary trend of the real NR (up) and imaginary NI (down) normalization factors of the double folding potential for the 7Li+64Zn system.
2.4 Conclusions
The elastic scattering for the 6Li+64Zn system has been measured at energies around the Coulomb barrier and the energy dependence of the optical potential has been studied. The extracted interaction potential at sub-barrier energies is very sensitive to the shape of the elastic scattering angular distributions. Therefore data with high accuracy are needed. In order to minimize the errors due to normalization factors a normalization run has been performed after of before each experimental run. Possible uncertainties in scattering angles coming from beam misalignment and/or beam wandering and/or imprecisions in the determination of detector angles have been minimized.
The analysis has been performed using four different fitting procedures and the results are qualitatively similar for all the potentials used. The reaction cross-sections obtained from the different optical potentials agree within 4%. The energy dependence of the real and imaginary parts of the potential shows that no usual TA is present for the 6Li+64Zn system and suggests the presence of the break-up TA. The absence of the usual TA in the elastic scattering of weakly bound nuclei is usually explained by the strong coupling to the break-up channel [8,71]. Preliminary results for the 7Li+64Zn system also show the absence of the usual TA.
The total reaction data in this chapter will be compared with the fusion data in order to clarify the role of the break-up channel in the 6Li+64Zn collision.