ALMA MATER STUDIORUM - UNIVERSITÀ DI BOLOGNA
SCHOOL OF ENGINEERING AND ARCHITECTURE DICAM
(Department of Civil, Chemical, Environmental and Material Engineering)
MASTER THESIS in
Road Safety Engineering
ROAD SAFETY INVESTIGATION OF THE INTERACTION BETWEEN DRIVER AND THE CYCLIST
CANDIDATE SUPERVISOR
Muhammad Faisal Usman Prof. Ing. Andrea Simone
CO-SUPERVISOR
Dott. Ing. Claudio Lantieri Dott. Ing. Navid Ghasemi
Academic year 2017/2018 Session III
Road Safety
Video analysis
Surrogate measures (PET & TTC)
Time to reaction on signals
Abstract
With growing global concern to reduce CO2 emissions, the transportation modal shift from
car to bicycle is an encouraging alternative, which is getting more popular in Europe and North America, thanks to very low impact on the environment.On the other hand, the infrastructure for cyclist should be improved, since cyclists are vulnerable road users and with increase in number of cyclists, the concern for their safety also gets increased.
In this thesis, the analysis of accidents in which cyclists have been involved and understanding the reason for these accidents have been discussed, then the requirements to design and implement a safe bicycle network is introduced.
The study focuses on the drivers’ behaviour in terms of interaction with cyclists when there is a presence of a cyclist crossing. Therefore the road safety investigation on cyclist infrastructure was made with observing drivers’interaction with cyclists.
Then the time-based surrogacy measures used to investigate the safety level of the cyclist, in particular PET (Post Encroachment Time) and TTC (Time to Collision) between driver and bicyclist were determined keeping in mind the right-angle collision.
Furthermore we tried to find the reaction time of the drivers especially on signals and also with the presence of cyclist on the crossing to understand the time which is needed for the driver to stop the car. All of this data could be later useful for the reconstruction of the accidents. Understanding the instants at which driver applies the brakes was made possible by installing a V-Box device inside our test vehicle which also used to determine measures such as speed, distance and other relevant variables.
Finally by using mobile eye tracker the driver visual behaviour when arriving the crossing point where observed and results showed that at a number of situations driver’s gaze was distracted and only cyclist became an important focus only when he was at a considerable length from the crossing.
Contents
1. Introduction ... 1
1.1 MOTIVATION Sustainable transportation mode ... 1
1.2 PROBLEM STATEMENT Cyclist Safety-Vulnerable User ... 1
1.3 OBJECTIVE Cyclist Road Safety Investigation... 2
1.4. Benefits of cycling as a transportation mode through an EU report ... 3
1.4.1. Environment and climate ... 4
1.4.2. Energy and reSource: s ... 4
1.4.3. Health benefits ... 4
1.4.4. Road Safety Benefits ... 5
1.4.5. Micro-economic benefits ... 6
1.4.6. Social benefits ... 6
1.5. Growing number of cyclists & reasons ... 7
1.5.1.Cargo delivery ... 8
1.5.2. Bike sharing ... 9
1.5.3. For earning extra-income... 10
1.6. CYCLISTS SAFETY ... 11
1.6.1. Cyclist accidents ... 11
1.6.2. Types of bicycle accidents ... 11
1.6.3. Overall road safety for cyclists ... 13
1.6.4. Time of the year for accidents ... 14
1.6.5. Accident causation analysis ... 15
1.6.6. Road Safety ... 16
1.7. Infrastructure and Bicycles ... 18
1.7.1. Main requirements of a cycling network ... 20
1.7.2. Characteristics of a bicycle network ... 21
1.7.3. Road signs ... 23
1.7.4. Bicycle Track pavement ... 25
2. Literature Review ... 29
2.1. Role of driver’s behaviour in road safety investigation ... 29
2.1.1 Driving behaviour ... 29
2.1.2. Visual perception ... 29
2.1.3 The visual perception of space ... 30
2.1.4 The visual perception of movement ... 30
2.1.6 The colour contrast ... 33
2.1.7 visual field in the dynamic scene ... 34
2.1.8 Road environment and visibility of the elements ... 35
2.2. Main features of a human eye ... 36
2.3. Eye Movements ... 39
2.3.1 Review of eye movements during visualization of scenes ... 39
2.3.2 Fixation of Eye Movements ... 40
2.3.3 Patterns of eye movements ... 41
2.3.4 Benefits of recording eye movements ... 41
2.4. Reaction time of the driver ... 43
2.5. Surrogacy Measures ... 45
3. Methodology ... 49
3.1 Aim of study ... 49
3.2 Participants familiarization ... 49
3.3. Mobile Eye XG (ASL) Instrumentation ... 50
3.3.1. Mobile eye tracking components ... 52
3.3.2. Eye Tracking calibration and recording ... 55
3.3.2.1. Recording the image of the eye and scene image ... 55
3.3.2.2 Reproduction of the recording of the eye image and scene image... 56
3.3.2.3 Copy recorded video of the eye ... 57
3.3.2.4. Compute the gaze in real time ... 57
3.4. The V-Box instrumentation (Vehicle Trajectory) ... 57
3.4.1. Installation of the V-Box system ... 59
3.4.2. Available parameters from the V-Box system ... 60
3.5. Synchronization ... 61
3.6. Driver performance measure and surrogacy measures ... 62
3.6.1. REACTION TIME... 62
3.6.1.1. Reaction time between traffic signal getting red and application of brakes. ... 62
3.6.1.2. Reaction time between signal opens( turned green ) and application of accelerator. ... 63
3.6.2. Post Encroachment Time (PET) ... 64
3.6.3. Time to Collision (TTC) ... 68
4. Experimentation ... 71
4.1. Participants ... 72
4.2. Vehicles used for experimentation ... 73
4.3.1. Cycle and pedestrian crossing at Via Azzurra ... 76
4.3.2. Cycle and pedestrian crossing in Via Pietro Mainoldi ... 77
4.3.3. Main Differences between Cycle and pedestrian crossing in Via Azzurra & Via Mainoldi ... 78
4.4. Stages of data collection ... 79
4.5. Analysis of the data collected from the experimentation ... 79
5. Data Analysis and Results ... 81
5.1. Premises ... 81
5.2. Surrogacy Safety Measures results ... 82
5.2.1. Post Encroachment Time (PET) Results ... 82
5.2.2. Time to collision (TTC) results ... 83
5.3. Reaction Time Results ... 86
5.4. Attention – Disattention Analysis ... 88
5.4.1. Via Azzurra without cyclist eye tracking results ... 92
5.4.2. Via Azzurra with cyclist eye tracking results ... 93
5.4.3. Via Mainoldi without cyclist ... 94
5.4.4. Via Mainoldi with cyclist ... 95
5.5. Result of frame by frame analysis ... 96
6. Conclusion ... 97
Bibliography ... 99
List of Figures ... 102
1 | P a g e
1.
Introduction
1.1 MOTIVATION Sustainable transportation mode
Cycling is probably the most sustainable urban transport mode, accessible not only for short trips but for medium-distance trips too long to cover by walking. Cycling causes no damage to environment, promotes health through physical activity and saves public infrastructure costs. In small words, cycling is economically, environmentally and socially sustainable. It has been noticed that cyclist hold a large share of all traffic-related accidents and can be considered as a vulnerable group among the other groups having their share on the roads. However, it has been claimed that number of benefits (for instance health and economic) can be achieved through cycling and it outweigh the risk being posed to the cyclist. Increased cycling is of great importance for the cities strive to enhance sustainability and to make the bicycle competitive to other means of transportation. The cycle infrastructure must be efficient regarding travel time and distance, as well as being safe.
A good insight into the problem provides an opportunity to improve the road safety of this cheap, convenient and environmentally friendly mode of transport.
1.2 PROBLEM STATEMENT Cyclist Safety-Vulnerable User
In almost all European countries, including Italy, there has been an increase over the last decade considerable use of the bicycle, as it is used to go to work, and to move around in free time, for sports, etc. Therefore, appropriate spaces are necessary for it, but unfortunately the quality of these places is not always adequate, meaning that the design of the slopes and road crossings take place without any planning of cycling and mobility. Also have an incorrect dimensioning and a bad maintenance. Furthermore, the increase in cyclists in our cities has led to an increase in accidents, therefore the bicycle is currently the means of transport it has recorded in the last decade the greatest number of accidents (compared to a significant decrease of the other users of the road) and therefore the cyclist, are among the weak road users, and are the one that needs the most attention to safety. The causes of this high accident rate are many and cannot be traced back only to the irresponsible action of the cyclist or to the poor quality of the road spaces dedicated to the circulation of bicycles, but also depend on a lacking and dated national regulation, and to non-homogeneous and confusing regional
2 | P a g e
rules and / or directives. Therefore, the rules and construction techniques do not fully meet the safety expectations of all the individual types of users, leading the streets to be a place of probable and daily conflicts.
The problem of road safety in urban areas is therefore of great relevance the growing trend road accidents can no longer be treated with solo dependence on limits of circulation and speed.
1.3 OBJECTIVE Cyclist Road Safety Investigation
The objective of this work was to find the interaction between vehicular flow and mobility of the cycle by focusing on vehicle-cycle interaction on particular locations (bicycle-pedestrian crossing) in our case and looking for the correlation between location of intersections and behaviour of drivers inside the car. Firstly, the most important tools to achieve our task were to determine surrogacy measures (including Time to collision (TTC) and Post encroachment time (PET) which explains in terms of values the interaction between cyclist and driver and also the threat of collision one location might have for the cyclist. Among other tasks carried out in this thesis were to understand the driver’s reaction time (Tr) both to apply brakes when signal becomes red and also to accelerate the vehicle when it gets green to understand how well different drivers would behave in case an unfavourable event might occur on our locations of interest. Lastly, we determined attention/disattention of our drivers by frame by frame analysis in order to fully understand what the major elements of attention are or disattention at both locations.
3 | P a g e
1.4. Benefits of cycling as a transportation mode through an EU report
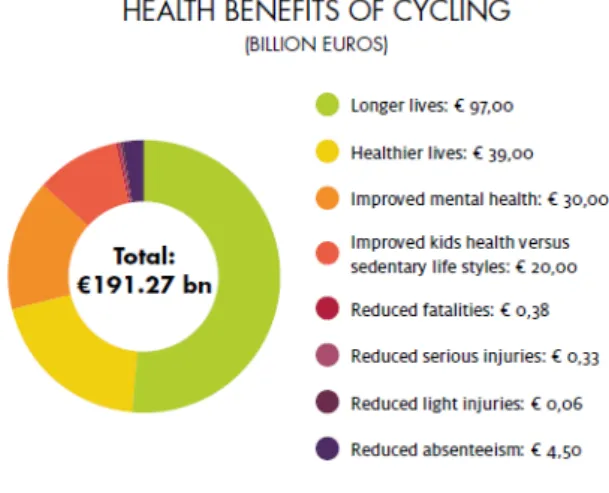
Before going to the literature review we would like to mention an EU report enlightening not only the role of cycling in the transport sector but also touching its positive effect on Industrial, health, employment and social policy. It also makes an effort to convince investors to invest in cycling and aid governments in EU to make a more cyclist-friendly policy (federation). It explains how a cyclist-friendly policy, if implemented, can move the burden of spending a big amount of budget on transport sector to other sectors and unleash the full potential of active mobility. Components of the active mobility agenda can be seen in the following figure
Figure 1-1 Benefits of cycle usage
4 | P a g e
1.4.1. Environment and climate
The calculations in above report under ECF study “Cycle more often too cool down the planet” considered reduced amount of CO2 emissions and thus a saving of worth 2 Billion euros. Some of the other uses were reduction in air and noise pollution along with environmental asset development as cycling infrastructure need less space than infrastructure for cars causing reduced building cost and more resource savings. Along with that it will also lead to less pollution of groundwater.
1.4.2. Energy and Resources
In the above-mentioned report, a fuel saving of 32% of car traffic was replaced by cycling. Another noticeable point in the above report is the use of E-bikes as they require less input by the user and hence more distance can be travelled (3 times more) than normal bikes. Moving on to the manufacturing of the bikes, it was noticed that building bikes require considerably fewer resources than cars so much so that building a bike requires only 2% of the resources of the resources needed to manufacture a car. From a civil engineering point of view it is also economical as only less amount of material such as concrete and asphalt is needed reducing the amount of money to be spent on infrastructure building.
1.4.3. Health benefits
To consider the health benefits a report from World Health Organization was considered where cycled kilometres /year = 264 km (reference: Austria) was kept consideration showing number of death prevention by this level of cycling was 27,860. Also 40% decrease in morbidity was also noticed in this report.
Moving forward to the benefits of cycling on brain health some of the other studies mentioned in this report were
A Dutch study showed increase in white matter (due to cycling) and better connection of brain network both in healthy and patients with schizophrenia.
A meta-study showed that regular physical exercise like cycling increased concentrations of peripheral brain-derived neurotrophic factor (BDNF), a protein
5 | P a g e
supporting healthy brain function and helping to avoid diseases like Parkinson’s or Alzheimer’s.
A healthy brain is important for a healthy body, considering both are important. Active mobility and cycling can be recognised as an excellent way of improving both.
Figure 1-2 Health benefits of cycling in terms of amount of spending
Source: (Neun)
1.4.4. Road Safety Benefits
From this report, it was noticed that every death on Europe’s roads there are an estimated four permanently disabling injuries such as damage to the brain or spinal cord, eight serious injuries and 50 minor injuries.
Figure 1-3 Fatality and injury statistics
6 | P a g e
1.4.5. Micro-economic benefits
The direct benefit through this policy as mentioned in report was fruitful for manufacturers and repairers of bicycle hence direct benefit to bicycle production sector. Another sector which got benefit from this was bicycle tourism based on 2.3 billion cycle tourism per year in Europe. Another point to be noticed was that since there would be a smaller number of automobiles on the road due to increase in bicycling, material damage could be avoided from car accidents as there would be lesser number of cars on the roads.
1.4.6. Social benefits
Improving social and gender equality was also noticed in this report, as bicycle is easily affordable even by most disadvantaged population groups improving their social equality was noticed as they can participate more now in their social life less reluctantly. With regards to gender equality as it can still be noticed that kids and older adults could move more easily with less dependence on women who have to still take care of them providing more free time to these responsible women and furthered their emancipation. Lastly with regards to social affairs an improvement in social safety was noticeable as more people will be outside making it difficult for criminals to commit crime on roads who had an ease of doing their activities as less amount of people were there to notice their activities.
7 | P a g e
1.5. Growing number of cyclists & reasons
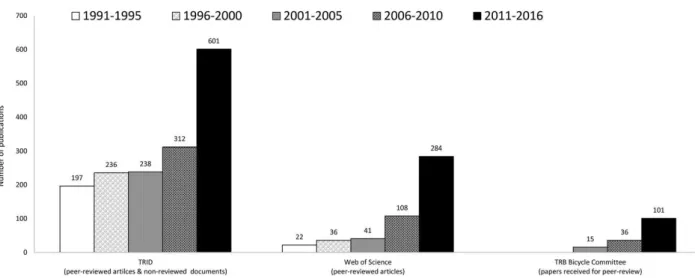
The Transportation Research International Documentation (TRID) index showing an increment from an average of 197 cycling-related publication per year in 1991-1995 to 610 per year in 2011-2016 demonstrating a 3-fold growth as can be seen in the (Figure 1-4).
Figure 1-4 Average annual number of publications about cycling by five-year periods, 1991–2016.
Source: https//www.bikeleague.org/content/what-can-rise-cycling-tell-us-about-its-future
In addition to booming academic research on cycling, there has been a proliferation of professional and academic conferences on cycling; increasingly influential, widespread and interconnected local, state, national and international cycling organisations; Internet sites devoted to sharing knowledge about best practices; various other information-sharing forums, including social media. The growing worldwide network of researchers, planners, advocates, and cyclists has inspired, enabled and actively promoted cycling.
8 | P a g e
1.5.1. Cargo delivery
The increasing demand for delivery of goods increases the problem of congestion, air and noise pollution and decreases the quality of living in the inner cities of Europe. Urban areas of the future are likely to look very different from today’s with conflicts over urban space putting increasing pressure on logistics companies to do things differently.
Global transport body the International Transport Forum (ITF) is predicting that passenger mobility will increase upwards of 300% by 2050. With up to 18% of road traffic represented by goods transport, this statistic suggests that delivery fleets will be competing with passenger transport for access to road infrastructure and parking. If current low emission zones, restricted access areas and congestion charges are anything to go by movement with vans and lorries in city centres will only get harder and more expensive. Combine this with the ease and increase in on-line ordering by both organisations and individuals and the resulting exponential rise in the volume of packages, parcels and packets requiring delivery on a day to day basis, viable and practical alternative delivery options are required.
Figure 1-5 Potential to deliver cargo through cycles
Source: Cycle Logistics D7.1 A set of updated IEE common performance indicators including their baseline assumptions for extrapolation
9 | P a g e
1.5.2. Bike sharing
Bike sharing is growing at a high-speed rate and is now available in over 70 countries. Mostly Asian operators have been expanding fast. On the downside, authorities are alarmed by the excessive growth and severe acts of vandalism to the public property as well. Overall, the bike sharing market is expected to grow continuously by 20% in the years ahead.
In Italian cities especially Milan, Rome and Bologna there have been an increase in trend of bike sharing as many people feel comfortable in using app to unlock bikes and after their use park them on the street. Other benefits of bike sharing are that its cheaper than taxis and car sharing, it is more flexible than public transport and can be combined with other means of transport
Figure 1-6 Typical easy to use shared bike
Source: http//www.manchestersfinest.com/shopping-in-manchester/our-guide-to-manchesters-new-mobike/
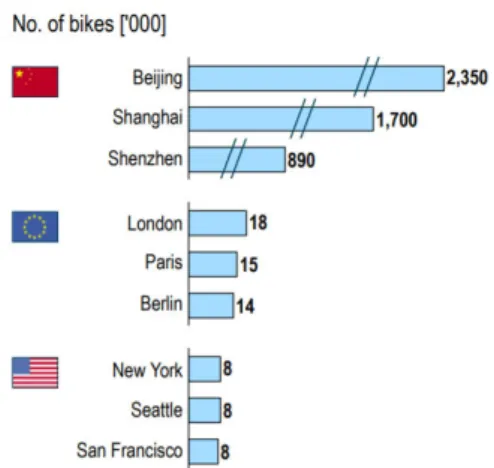
Figure 1-7 Largest bike sharing cities by region Source: Press research; Roland Berger
10 | P a g e
1.5.3. For earning extra-income
Many of the students and other low earners who are not satisfied by their income utilise bicycles to earn extra income and could be very vulnerable to accidents since they spend much time on roads..
Figure 1-8 Bicycle food delivery guy
11 | P a g e
1.6. CYCLISTS SAFETY
1.6.1. Cyclist accidents
Cyclists, while relatively small in proportion with respect to motorized vehicles, have a high level of vulnerability, creating a significant need to better understand the characteristics specific to this user group. A good insight into the problem provides an opportunity to improve the road safety of this cheap, convenient and environmentally friendly mode of transport. In 2013, more than 2.000 cyclists were killed in road traffic accidents in 27 EU countries, constituting almost 8% of all road accident fatalities for that year. Although a considerable decrease by 32% in the total number of bicycle fatalities in noted within the decade 2004–2013, it is still smaller than the respective reduction of the overall road fatalities by 45%. (Petros Evgenikos)
1.6.2. Types of bicycle accidents
The typical conflict situations for cyclists as show in above figure are as follows
Incident 1. Right crossing
It is the most widespread accident. A car exits a side road or a parking lot or a step car on the right. There are two different cases, where
- the cyclist is in front of the car and the driver hits the front wheel.
- the car enters the road in front of the cyclist and the front wheel slams against it, without being able to brake.
Incident 2. Sudden opening of the door
A parked car suddenly opens the door to the cyclist while he is passing. If the front wheel have crossed the visualization point and the reflections are not visible, the impact is unavoidable.
12 | P a g e
Incident 3. Red light
The cyclist stops at an intersection with a red light (or a STOP) immediately to the right of a car, waiting for the same light. By introducing the green, the motorist, not seeing the cyclist start crossing the intersection to go straight, turn right and hits the front wheel of the bicycle. This type of incident is very frequent with buses and trucks as they have the guide top left and have a dead angle that prevents you from watching cyclists (even pedestrians, motorcycles) from the right-side rear-view mirror.
Incident 4. Sudden turn to the right
A car passes and turns right in front of and / or against the cyclist. Incident 5. Cross on the left
A car comes from the opposite direction of the cyclist, suddenly turned on his left and, not seeing the front wheel, he hits it.
Incident 6. Posterior impact
The cyclist, skidding slightly to the left to avoid a parked car or an obstacle suddenly, he risks being hit by a car coming up behind him.
13 | P a g e
Figure 1-9 Typical risk situations for cyclists
Source: (Maternini)
1.6.3. Overall road safety for cyclists
Comparing the data for amount of fatalities on roads it was found that in the year 2013 , 2017 cyclists were killed in road traffic accidents in 27 different EU countries where as in US only 743 cyclists died accounting for 2 % of all traffic fatalities. ((NCSA))
14 | P a g e
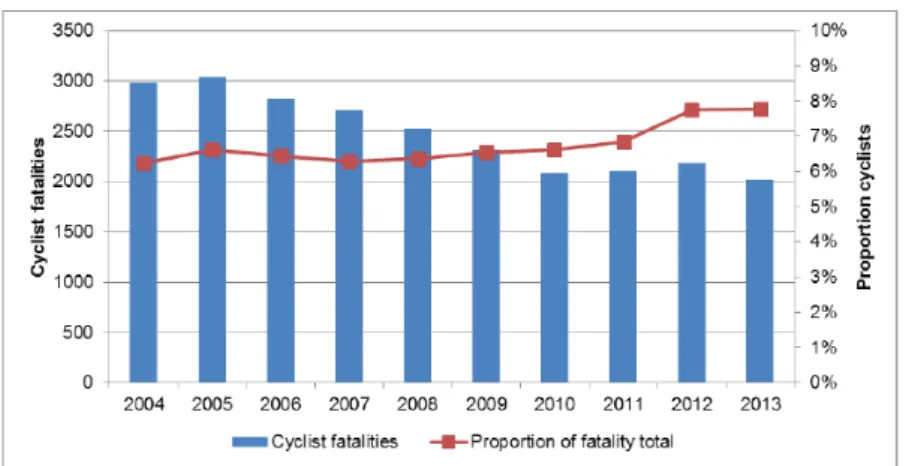
Figure 1-10 Number and proportion of cyclist fatalities in the EU, 2004–2013.
Source: CARE database
Looking at the above figure It could be noticed that although the number of cyclist fatalities has decreased by 32% over this period, the overall number of road accident fatalities has fallen faster (reduction by 45%) and the share of bicycle fatalities of all road fatalities in the EU increased from about 6% to almost 8%, especially from 2010 to 2012.
1.6.4. Time of the year for accidents
From the Figure 1-12 it was analysed the peak for EU countries occurred in August (13% of cyclist fatalities) and the fewest fatalities occurred in January and February (4% of cyclist fatalities). Also the number of cyclists on the road could be associated more to the bicycle accidents than indication of risk of injury per cyclist.
Figure 1-11 Proportion of cyclist fatalities and total road fatalities per month in the EU, 2013.
15 | P a g e
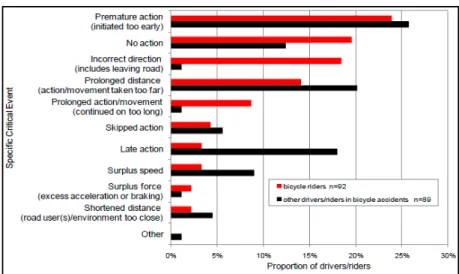
1.6.5. Accident causation analysis
As shown in the figure 1.133, the most frequently noticed cause for both drivers and riders involving in the accident was ‘the premature action’ which describes a critical event with an action started too early before any signal was given or required conditions established. In combination with prolonged distance and prolonged action/movement – movements taken too far and manoeuvres that last for too long (for example, not returning to correct lane).
Figure 1-12 Distribution of specific critical events – bicycle riders and other drivers/riders in bicycle accidents.
16 | P a g e
Figure 1-13 Ten most frequent links between causes – bicycle riders.
Source: SafetyNet Accident Causation Database 2005 to 2008/EC. Date of query 2010.
The above figure mentions the frequent links between causes for injury accidents involving bicycle riders. For this group 74 such links were there in total. Importance of causes could be noticed from their number of appearance (frequency).
1.6.6. Road Safety
Risk posed to bicycle users on roads considering a cyclist-only crash shows that there was just a small amount of energy transfer between both the cyclists due to small masses and low speeds but if it was the case of cycle vs car the results are incompatible as a car have a huge mass in comparison to a bicycle. For one car casualty there are 150 bicycle casualties in car-bicycle crashes. Therefore, vulnerable road users such as cyclists run an even higher risk of getting injured in a crash with a ‘disproportionally strong crash opponent’. Measures to ensure bicycle safety on roads
Through helmets
One of the protective devices available for cyclists is the bicycle helmet. It is widely accepted that a properly designed helmet provides protection for the most vulnerable part of the body, the head, against being severely injured in a crash (SWOV). SWOV has calculated the maximum effect of a bicycle helmet to be approximately a 45% reduction of the risk of head
17 | P a g e
and brain injury when a good helmet is worn correctly. However, if one needs to use ‘controlled trials’ as the only way of finding proper scientific evidence, some doubts remain. Whereas the helmet generally is compulsory for participants in sporting events, wearing a helmet for bicycle touring or bicycle rides in general is still optional in most countries. This introduces another heavily debated issue how conclusive are studies that evaluate the safety effects of introducing helmet legislation?
Some cyclists are opposed to the helmet as it conflicts with their feeling of freedom that goes with riding a bicycle, or because it is unsightly, uncomfortable, or unnecessary over short distances. Others are strongly in favour of it as it provides good head protection. One of the often-heard arguments is the negative impact of compulsory helmet use on the use of bicycles, and this is supported by an unmistakable decline in the use of bicycles after the introduction of compulsory helmet use in provinces in Australia and Canada. Presently, the conclusion must be that deciding on helmet legislation is a political decision, given that such a decision will have positive and negative effects on cycling and cyclist safety.
Through noticeable jackets
A review study from The Cochrane Library (Kwan) studied randomised controlled trials (RCT) to assess the effects of increasing pedestrian and cyclist visibility. The study found 42 studies comparing the visibility with and without visibility aids. These studies showed that fluorescent materials improved drivers’ detection during the day, while lamps, flashing lights and retroreflective materials improved the detection at night. This randomised controlled study delivered strong evidence that cyclists are protected against multiparty accidents when wearing a bright-coloured jacket.
18 | P a g e
1.7. Infrastructure and Bicycles
Starting with the question “why is cycling infrastructure needed?”. A simple answer to this question could be because of ignoring the bicycle users in planning cities when there has always been an approach to have a distinct path for pedestrians to move. Since bicycle users are faster than pedestrians there is in no way; they can be compared to the speed of other moving vehicles which have more intensity and speed than bicycles. If we want to facilitate the use of cycling as an environmental friendly transport mode used by masses, adaptation in infrastructure will be needed. Two approaches are needed to be understood when designing cycling infrastructure
-Taking cyclists seriously.
- Integrating cycling infrastructure.
To make sure that above both approaches are completely respected we are of the philosophy namely “The network/segregation philosophy” which is a strongly technical engineering approach making sure that cycling infrastructure is considered as an additional network in its own right, consisting of separated, dedicated infrastructure having its own technical design norms. But the above-mentioned philosophy is quite expensive when it comes to practical implementation so we might have to be flexible on some places for instance an area with less traffic or where speed of cars is of less intensity (areas with a speed limit 30km/h) so that bicycles can integrate with the cars.
Cyclists’ needs
It is important to keep in mind that bicycles are in general used for short distances of less than 5km as could be seen in the table below which is from the research conducted in Flemish region in Belgium.
19 | P a g e
Figure 1-14 Share of bicycle trips per distance
Source: OVG Flanders 2001 (Travel behaviour survey)
Now the question which arises is what makes cyclists want to get on their bikes, and some of these essential needs could be
Safety Direct route
Good connections to public transports Attractive pathways
20 | P a g e
1.7.1. Main requirements of a cycling network
For a cycle network, three out of five main requirements (see above) are very essential safety, directness and cohesion. The other two are important on the level of specific design of routes and road sections.
The most important among these three important requirements is cohesion meaning good connections without it there would be only a bunch of single routes. Cohesion is the extent to which cyclists can reach their destination through the route of their choice.
To make a network cohesive, a clear understanding of major origins and destinations is important. By drawing in lines of desire between those, we can get an idea of potential travel flows. Using computer models to calculate travelling patterns is only feasible for CHAMPION CITIES with sufficiently large numbers of cyclists to provide meaningful data. Apart from the internal cohesion of a cycle network, the cohesion with other networks also plays a role. Especially the intermodal connection for the cycle network to public transport points is very relevant as cycle trips are an import means of transport to and from public transport.
The network directness concerns the distance or time you need to cycle between points of departure and destination. In terms of policy, the bicycle should have more direct routes than the car in the built-up area. This way cycling is quicker than taking the car. Directness in the distance can be determined by calculating the detour factor which is the relationship between shortest distance over the network and distance as the crow flies. The lower the detour factor the higher the directness of the network.
Moving on to the third important factor “safety” which is not just a factor of physical design. Much work could be done to ensure safety on the network level. Below are given some guidelines to ensure network safety
Avoid conflicts with crossing traffic. Separate different types of road users. Reduce speed at points of conflict. Ensure recognizable road categories.
21 | P a g e
1.7.2. Characteristics of a bicycle network
However, what exactly is a cycle network? Here is a working definition a cycle network is an interconnected set of safe and direct cycling routes covering a given area or city. It is worth stressing once again that a network consists of routes, not tracks or lanes. The quality of a route or a network does not depend on one particular type of infrastructure, such as segregated tracks. A quality cycling route is an uninterrupted itinerary fitting as closely as possible the criteria outlined above safe, direct, cohesive, comfortable and attractive. The physical shape may vary from route to route and even within one route. A route may start in a residential 30 km/h area mixed with light traffic, move onto a cycle lane where traffic is slightly heavier, run through a dedicated cycling tunnel under a ring road, continue as a segregated track along a main road, cut through a park as a short-cut and through a pedestrianized shopping area reach to the railway station. The quality of the network as such depends on its structure how well does it fit together; how easily does it make urban destinations accessible; how well does it avoid or manage risky situations?
Keeping under consideration the physical characteristics of the activity of bicycling we need to have the following things in our mind when designing a bicycle network
Stability
Bicycles are unstable vehicles. Crosswinds, lorry slipstreams, bumps and holes in road surface and involuntary low speeds determine the stability of the bicycle network. A speed of at least 12km/h is required to maintain balance otherwise the bicycle will start wobbling, which could be due to pulling away from a stationary position, slowing down in the narrow bends and riding uphill.
Zigzagging
When riding, cyclists continuously have to maintain their balance. That is why they always move slightly from side to side, even when riding fast. This is called zigzagging. Apart from the speed, zigzagging also depends on age, experience, physical capacity, disruptions in the road surface and cross winds. At normal cycling speeds in normal conditions, the zigzagging movement is about 0.20 m. In situations where cyclists are forced to travel at less than 12 km/h, more free space is required. This is the case at traffic lights, for example, where cyclists have to pull away from stationary position and when cycling uphill. In that kind of situation, zigzagging may require a track width of up to 0.80 m.
22 | P a g e
Fear distances from obstacles
Designers also have to take the fear of obstacles into account cyclists will want to keep their distance from kerbs, edges and walls. The Dutch Design Manual indicates the following obstacle distances for green verges and low kerbstones, the obstacle distance is 0.25 m; for higher kerbstones 0.50 m, for closed walls 0.625 m.
Section of free space
Now we can calculate the pavement width required for one cyclist take the width required by the bicycle and its rider (0.75 m) and add to that the zigzagging margin and fear distances from obstacles (these margins may overlap). The most common situation is that of a cyclist riding along a high kerb on one side an absolute minimum pavement width of 0.9 m is required.
Whenever possible, we should provide room for side-by-side riding this makes cycling amore enjoyable social activity, allows adults to drive next to children and allows faster cyclists to overtake slower ones. This means we should go for a recommended minimum width of 1.5. For comfortable driving in tunnels, provide minimum 0.75 m headroom.
Figure 1-15 Section of free space
23 | P a g e
1.7.3. Road signs
Indication signs are intended to provide users with the necessary information for the correct and safe circulation, as well as for the identification of itineraries, locations, services and road installations. As for the recommended cycling routes, it is necessary to integrate the road signs standard with compound signals that recall this preferential and recommended condition.
Horizontal signs for cycle paths
The cycle lanes on a reserved lane from the roadway are separated from the lane of vehicles driven by two continuous horizontal signal strips side by side, a white one of 12 cm of width, and a yellow one of 30 cm of width, space between them is 12 cm (Figure 1-16). The yellow strip must be placed on the side of the cycle path (Regulations for the implementation and implementation of the New Highway Code, DPR 16.12.1992 n 495); the symbol of the bicycle, in white, will be repeated repeatedly along the development of the track.
With a correct application of the road markings, a proliferation becomes superfluous repetitive of vertical signals at each intersection with side roads. Horizontal signage it clarifies by itself the presence and the continuity of a cycle route.
Figure 1-16 Horizontal signals for cycle paths
24 | P a g e
Vertical signage for cycle paths
The Italian Highway Code provides three prescriptive signals to indicate the existence of a structure specifically designed for cycling the "cycle path" sign, to be used at the beginning of a track, lane or itinerary reserved for the circulation of bicycles; the signal "cycle lane adjacent to the sidewalk", which identifies a track or lane always reserved for bicycles but parallel and contiguous to a path reserved for pedestrians; the signal "Pedestrian and cycle path", which identifies a path intended for a promiscuous use of pedestrians and bicycles (Figure 1-17).These signals indicate that the road, or part of it, is reserved for the single category of users expected, that is cyclists and in the last case, cyclists and pedestrians, while it is forbidden to others categories.
Figure 1-17 Vertical signals obligatory for cycle paths
Source: (Maternini)
The signals in the above figure could be explained as
Figure 1. Cycle lane indicates the beginning, or continuation, a track, a lane, a path, reserved only for bicycles.
Figure 2. End of cycle track indicates the end of a track, a path, reserved only for the bicycles.
Figure 3. Cycle lane adjacent to the sidewalk indicates the beginning or continuation of a track or lane, reserved for bicycles, contiguous and parallel to a sidewalk or in
25 | P a g e
any case of one path reserved for pedestrians. The symbols can be inverted to indicate the real layout of the track and sidewalk
Figure 4. Pedestrian and cycle path indicate the beginning or continuation of a route, a itinerary, or an avenue, reserved promiscuously to pedestrians and bicycles.
Figure 5. End of the cycle lane next to the sidewalk indicates the end of a cycle path next to the sidewalk
Figure 6. End of the pedestrian and cycle path indicates the end of a location, route or itinerary, reserved promiscuously to pedestrians and velocipedes.
1.7.4. Bicycle Track pavement
The paving of a cycle path is the element that absolutely characterizes the track, through its discreet recognition, comfort, environmental inclusion.
The design definition of a cycle path paving cannot be separated from one careful study of the context in which the track develops, of the prevalent type of user expected, construction and maintenance costs. In some cases, not competent designers are good administrators and can’t fulfil make the design a good reality. A knowledge of the construction techniques of the roads (a cycle path is still a road), and in particular the basic elements of hydraulic protection of road foundations, it is a necessary and sufficient prerequisite for building economic cycle paths which can last a good amount of time.With this essential prerequisite, the cycle plan must have adequate capacity carrier that can be obtained with crushed stone materials with controlled granulometry and adequately compacted, even without the use of hydraulic binders or hydrocarbons. Similarly effective are the preparations of the foundations and even of the same cycle surfaces with land stabilized with lime or lime / cement in relation to the type of land present in place. Cycle loads and occasional loads of light motorized vehicles to maintenance services, they do not generate solicitations of such magnitude as to require important superstructures. On the other hand, it is essential to avoid water stagnation or to leave surface portions uncovered not compacted and yielding which, among other things, are prejudicial to the stability of the cyclist. More the tangential surface actions are significant and therefore the type is very important for them and also the durability of coating surfaces is of equal importance.
The cyclist prefers a compact surface with good adherence, regular and without roughness of a closed bituminous conglomerate, hot microtapes or stone pavement or in perfectly laid and maintained concrete slabs (limited drainage, stability of the single element and control of the
26 | P a g e
dimensions of the rolling plan), and this is the case of paving solutions for bicycle lanes in reserved lane on carriageway or on sidewalk and generally solutions in urban and sub - urban circulation.The same levels of comfort and lower running costs, especially for long runs tracts of slopes in green areas, parks, rural areas, can be obtained through treatments surfaces of cold dedusting by bitumen emulsions.
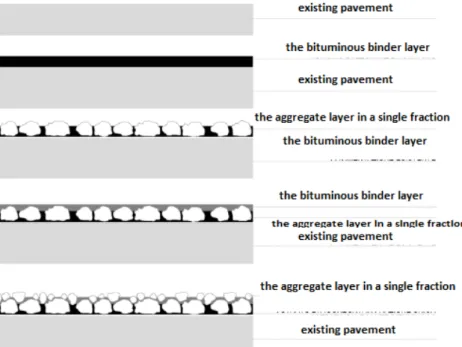
Among these solutions, very interesting for speed of execution and cost-effectiveness of the process, there are single layer treatments with double shot blasting (grades of 6/10 mm + 2/4 mm grit), double-layer to double-layer treatments and "sandwich" treatments (Figure 1-18).
Figure 1-18 Surface treatment of cold dedusting (Double - Layer)
Source: (Maternini)
The dosage of grit and bituminous emulsion per unit area varies according to the type of treatment to be carried out and of the granulometric classes of the stone aggregates used. At the Source: of potentially very positive outcomes, the treatment project is still very much delicate and passes from a careful evaluation of the shape and lengthening of individual grains and by a good organization of the installation works. The spreading temperature and reopening times traffic are decisive for the final result with processes that take place at temperature environment and therefore completely eco - compatible.
For areas of environmental and landscape protection, when we do not want to derogate from the maximum comfort in the cycle path, the evolution of the technologies of the bituminous
27 | P a g e
conglomerates allows for some years to be able to conceive and realize road surfaces colored in the mixture that, for the design of the cycle paths in the regime of "traffic calming ", can also highlight specific destinations of the urban roadway (tracks cycle paths in their own or on a reserved lane, intersection areas, etc.). Such conglomerates, from structural and functional point of view, they are identical to traditional bituminous mixtures being packaged asphalted bituminous binders or with polymeric resins transparent with any colors that are obtained with the addition of specific pigments introduced in production plant (Figure 1-19).
Figure 1-19 Laying of transparent bituminous conglomerates
Source: (Maternini)
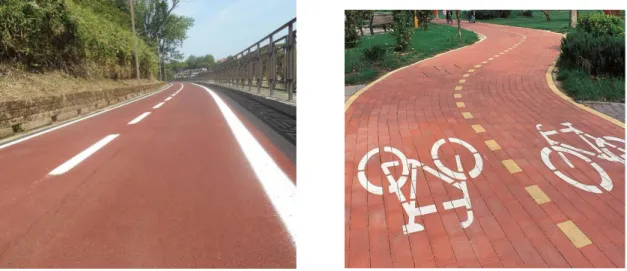
The colouring in paste guarantees the maintenance of the essential characteristics of adherence between the tire and the flooring, which can be less when the colours road surfaces are made with inadequate paints or paints on bituminous surfaces traditional. More effective is the colouring, always in paste or with specific paintings, of streets and bicycle tracks in concrete blocks, generally self-locking, that identify in a way explicitly the partition the way for each user (Figure 1-20).
28 | P a g e
Figure 1-20 Cycle tracks in coloured bituminous conglomerate and self-locking blocks
Source: (Maternini)
The approach is different if the colour of the track bottom is made in correspondence of the cycle crossing using paints. In this case, it falls into all effects in field of horizontal road signs and therefore this practice is prohibited. Emerge in fact the contrast with the provisions of art. 137 paragraph 5 of the Execution Regulation of the Italian Highway Code, which lists the colours that can be used for signalling horizontal and specifies its use. Technically, less than an objective sense of recall given by the chromatic contrast, the cycle or cycle-pedestrian crossing made on backgrounds coloured (red, blue, green) is not visible better than normal white stripes on a black background, with the latter combination that has the optimal ratio contrast and which is more effective in night time or during one meteoric precipitation. Therefore, the best perception by users is obtained creating a cycle or cycle path crossing with white stripes on a black background.
29 | P a g e
2. Literature Review
2.1. Role of driver’s behaviour in road safety investigation
2.1.1 Driving behaviour
Driving may be described as a control task in an unstable environment created by the driver’s
motion concerning a defined track and stationary and moving objects. The task includes requirements for route choice and following, coordination of manoeuvre in support of navigational objectives, and ongoing adjustments of steering and speed.
One way to observe the behaviour of driver is analyse the eye movement . The theme of visual perception is one of the strengths of scientific psychology; not by chance precisely in this field psychology has made its most significant scientific progress, thanks also to the collaboration with other disciplines, such as neurophysiology or computer science.
2.1.2 Visual perception
The term perceives means "learning with the mind" and derives from the Latin "percìpere", which means "gather"; our brain, collects, records, organises, reworks and memorises the data of sensory perceptions. When you see an image, the brain registers the forms, colours and movements that have captured, processed and classified the information received and, therefore, defines the displayed object allowing to become aware of his identity, its shape, its colour, its position in space, its movements etc. In short, the brain allows us to see and know the perceived object. Visual perception is, therefore, an essentially mental activity; however, the brain does not it intervenes only to define an image but also to connect a visual perception to others sensory impressions (tactile, gustatory, olfactory, auditory) so that we can know one object from the sum of these perceptions.
Moreover, the activity of the mind allows to associate an image with other information present in memory in this way, thanks to the memory and the association of ideas, an image can be easily cataloged (recognized and compressed). From this set of components finally comes the "judgment" that, linking a given perception to feelings, feelings or memories, determines a psychological and emotional reaction for which an image can get consensus and interest or to arouse repulsion and rejection, can evoke feelings and memories, can be judged
30 | P a g e beautiful or ugly, pleasant or unpleasant and so on. Visual perception, therefore, is based on a set of mental operations (memorization, cognition, learning) that allow us to perceive, catalogue and process information and that determine their attitude and their reactions to him.
2.1.3 The visual perception of space
Perception of space means the perception of geometric and spatial characteristics of individual objects (their size, volume, orientation, etc.) and all those characteristics that make it possible to locate objects that are variously arranged in space, beyond at the distance between the object and the observing subject (absolute distance) and between the various objects themselves (relative distance). Depth cues provide information only on the distances between one medium and another (the relative distance), not on the distance between the vehicle and the observing person (the absolute distance). The perception of spatial contrast is the ability to recognise the objects that constitute its visual scene. Constancy is a perceptive compensation, i.e. a visual phenomenon in which the object it remains relatively constant when it is perceived by the observer regarding his property, despite the fluctuations of its physical characteristics.
2.1.4 The visual perception of movement
The movement of an object not only indicates some properties dynamics such as direction and speed, but also some spatial properties such as position and the distance. The perception of movement is not always due to a real shift of the image on the retina, but to a mental interpretation of what the eye sees. Which set of conditions is enough in the physical environment to be able to perceive one movement. You can see a movement if a dot moves on a stationary background at speed of 0.2 radians of visual angle per second (rad / s). For example, when a pawn moves by night, in a dark place, wearing bright shoes. Many objects in the world that surround us move, and road traffic is an example explicit, or transform, while our behavior is characterized by movements of the body, head and eyes. Because of this it is good to talk about a flow of stimulations always changing at an optical level. The optical flow is the set of rays of light that comes from the environment to the eyes and comes focused on the retina, while the individual moves in the environment. It refers exposure to the type of repetitive movement that adapts when, for example, you drive or ride a bike. The
31 | P a g e optical flow can provide information that specifies one possible imminent collision with a moving object approaching. The flow component optical is the consequence of locomotion, it represents a perspective transformation keep it going. The optical flow that hits the retina during locomotion takes precedence over all other information since the outside world is perceived as a stationary entity e the observer as a moving unit.
During locomotion, the components of the visual environment are interpreted as structures rigid in the relative movement since "people perceive the environment as an entity rigid. " It should be remembered that visual information about locomotion by the cyclist or pedestrian does not it is a single isolated entity, it interacts with the signals that come from other sense organs present in the joints, muscles, inner ear, etc., which report on the bodily movements. The apparent movement refers to any illusory movement that takes place when no real movement or object is corresponding to the perception of movement. It includes various phenomena, such as the stroboscopic movement, which is at the basis of a perception of movement in the cinema or on TV. In the if in A the lights (or) light up later with constant time, it is perceived a movement that goes from t1 to tn. In B, if the lights t1 and t2 are
switched on and off at precise time intervals, there is a perception of movement from the moment t1 to the moment t2. This is called the "phi" phenomenon, which has effects more
convincing than the real movement indicated in A.
Figure 2- 1 Perception of movement
Source: (Maternini)
The perspective of movement is the set of variations of the perspective projections produced from the observer's movement. When a rider looks in the direction he is moving, the field of view expands from one focal point located on the horizon; in the length of the arrows indicates the different flow velocity of the various parts of the visual field. These perspective contractions of expansion, sliding and contraction of the field become very visible when you are there moves at high speed in cars or trains as shown in Figure 2-1.
32 | P a g e
Figure 2- 2 Flow velocity of the visual field parts
Source: (Maternini)
2.1.5 Visual perception of colours
Colour is not a physical property of objects, but a subjective experience. The colour is an incredibly engaging appearance in the world around us; although many visual functions they could be carried out by simple detection of light / dark reports, others behaviours strongly depend on the properly chromatic aspects of what we see. Colour has direct effects on people's perception, mood and behavior. The constancy of colour is above all a rational phenomenon given that the things we see do not know they are isolated and suspended in nothingness, but they are normally surrounded by other things, at least stand out against a background. The colours are differentiated based on 3 different perceptive qualities the colour, the clarity and the saturation. To draw colors in eurpean languages only 11 terms is being used; white, black, red, orange, yellow, green, blue, brown, pink, purple and gray. Table 2-1 shows the sequence percentual- norm of colors - base in normal adults (male and female).
33 | P a g e
Basic -Colours % noticing in adults
Blue 20.2 Red 17.6 Green 16.4 Yellow 12.6 Orange 10.0 Viola 7.3 Brown 6.9 Black 6.0 White 2.0 Gray 1.0
Table 2- 1 Basic Colours- Noticing in adults by percentage
Source: (Maternini)
Not all people have a correct perception of colors, like those that come used in road signs, including traffic lights. Total or partial insensitivity to red or green is relatively frequent (about 8% of the total population), in males (6 - 7%) more than in females (1%). The colour-blind they perceive two fundamental colors yellow and blue, and this leads them to confuse the red, the blue - green and grey. the colors of the road signs are established by the Highway Codes.
2.1.6 The colour contrast
Figure 2.2 shows a research conducted by the Institute of Psychology of the University of Bologna, on the readability of a biochromatic signal, using the letters XYZ and the
background color. The following readability order has been obtained Black on yellow;
Yellow on black; Green on white; White on blue; Black on white; White on black; Orange on black; White on Green; Green on orange.
34 | P a g e
Figure 2- 3 Order of readability of a biochromatic signal
Source: (Maternini)
2.1.7 visual field in the dynamic scene
Perception is a process of sensory organization and unification of events sensitive, closely linked to experience what perceives us does not correspond necessarily to the physical reality of objects. In fact, there may be discrepancies between the real data and perceived data as, for example, the distance, shape or size of the eye human perceives does not always correspond with distance, form or objective size. "The physical world is not the world of physics". The visual system has the function of constructing a model of the visual scene it takes into account environmental lighting, its effects on various types of surfaces and distribution of spatial shadows. The visual scene is seen in an instant by an ideal observer who photographs it, but who in reality explores it by focusing its vision mainly on only some details of the same, on which he then reconstructs the scene in a unified way. The visual field and therefore the visual scene are different for a pedestrian, a cyclist or a driver of a vehicle. In 2.29 the visual field of a pedestrian or a cyclist, of a motorist travelling at 30 km / h and a motorist who travels at 50 km / h.
Figure 2- 4 Field of vision of a motorist (speed 10- 45+ km / h) of a pedestrian / cyclist
35 | P a g e Peripheral vision orients our foveal vision on one object rather than another to allow identification. If, for example, a cyclist, traveling by day, passes from an external road to a tunnel unenlightened can see that the adaptation to darkness in the transition from an exposure in bright light in the dark it implies a certain time in which the cones and the first are involved subsequently, with a longer time, the rods. In cyclists belonging to different age groups, i.e. the youngest and the oldest, adaptation to the obscurity it is a lot slower for the latter.
2.1.8 Road environment and visibility of the elements
The fact that a road has been well designed does not necessarily imply that all users will feel the limits that the course of the road imposes to their behavior or even warn them. Insecurity, sometimes, is attributable to the system (man, vehicle, Street). The surfaces of the environment, both natural and artificial, usually have a grain of weaving, both for their colour that is not uniform, and because they are not perfectly smooth, they are grainy, wavy, pitted or otherwise irregular. Some road surfaces are visibly made up of many parts put together so that their texture is more evident. The texture gradient is the modification of the appearance of visual objects, depending on their distance, important in the perception of this. The texture gradient constitutes a depth indication for example, the paving stones of a road gradually appear smaller hand that the observed point is farther. A study conducted in France, on over a thousand drivers, ascertained that speed used seems to be strictly dependent on the characteristics of the first roadway of the intersection, i.e. the layout and the lining of the road pavement.
Visibility intervenes in the more general framework of the setting process and treatment information that is a fundamental aspect for choosing the behavior to be held. Visibility is different at night, during the day, with fog and mist or with rain and snow. This requires those who manage the streets to implement tools that promote a level of coherent visibility in relation to the road, as indicated in the Highway Code, and to his displacement, and possibly in all the different situations found. Those interested in the traffic safety problem must be able to use any a means that can help people to make a correct assessment of what they must face.
36 | P a g e
2.2. Main features of a human eye
The eye has the function of capturing the light signals and transforming them into nervous signals. The illuminated objects reflect the luminous radiations that strike them; the reflected radiations they reach the receptors in our eyes, which send electrical impulses to the brain. The eye works like a camera. The entire orbital cavity is enveloped by a very resistant white fabric, the sclera it is the so-called "white of the eye" which, in the front part and central, to let the light pass, it becomes transparent, curves into glass with time and shape the cornea. The light passes through a hole, the pupil, which be the diaphragm of the camera expand or shrink by muscle fibers arranged circularly "donut" around to it, so as to regulate the amount of light that enters. When, for example, we enter one dark room coming from an enlightened environment, the pupil expands. These fibers, together with connective tissue that unites them, form the iris, the part that gives color to the eyes. More internally there is a real lens, the crystalline lens. The crystalline is curved or gets flatten to focus on the retina the image, turned upside down like in a camera.
The space between the crystalline lens and the retina is occupied by a gelatinous liquid, which maintains the shape of the eye ball. In people with hypermetropia the eye ball is shorter than normal and the image is focused behind the retina (Fig 2-4). In the short-sighted people, instead, the globe is longer and the image is focused in front of the retina. The retina, which records the image as a photographic film and transmits it to the brain, is a membrane consisting of two types of light receptors or photoreceptors the cones and the rods.
37 | P a g e
Figure 2- 5 Structure of the eye
Source: http//www.optics.arizona.edu/sites/optics.arizona.edu/files/alexander_lyubarsky_ms_report.pdf
The light follows the following path before reaching the retina
Light → Cornea → Pupil → lens → Retina
The rods, sensitive to light of low intensity, are about 120 million. They are distributed fairly evenly over the entire retina, except in the area, called the fovea centralis, where the concentration of the cones is maximum. The cones, sensitive to intense light, are also responsible of color vision. In a smaller number of rods, about 6 million, the cones are not in fact all equal. Some of them are sensitive to red light, others to green light, others to that one blue variously stimulated, they allow us to perceive colors. Color blindness, a disease genetics which involves the inability to distinguish certain colors, is generally due to the lack of red or green receptors. The light that arrives on the photoreceptor "impresses" them because it determines the rapid and complex reactions of the photosensitive pigments (i.e. sensitive to light) contained in them.
In rods, for example, there is a red pigment, the rhodopsin, which is formed starting from vitamin A. When light hits the rhodopsin molecules, they change generating nerve impulses which, through the optic nerve, reaching the brain. Unlike the photographic film, the pigment of the eye does not end. In fact, in the eye there is a complex chemical system that continuously returns the pigment to the original structure if it would not be like that we could not see anymore. During the time necessary for the reconstitution of the pigment the eye is
38 | P a g e not sensitive to light it is what happens when we are dazzled. It is usual to make the mechanism of optical perception clear and understandable by comparing it to that of analogue photography. In fact, the camera was built following the functions of the eye. Visual rays penetrate through the lens of the photographic lens, which performs the same function as the lens, making the visual and intersecting rays cross projecting the image upside down on the back of the machine, the latter consists of a photosensitive surface on which, thanks to the chemical reactions, the inverted and negative image is recorded (in which, in other words, the relationships are reversed between light and dark). Subsequently, during printing, the image is projected onto a sheet of sensitive paper, rectified and recomposed (becoming a positive image), similar to what happens in our brain. The view is able to focus on an object, or to fix the gaze on an object placed at a certain distance and distinguishing it with greater clarity from the surrounding environment, the perception of which will remain more confusing and less defined, i.e. blurred. This is firstly due to the possibility of modifying, thanks to the action of a muscle, the curvature of the crystalline lens through which the visual rays penetrate inside the eye; this effect is similar to that of focusing a photographic lens when it comes adjusted according to the distance of the object to be shot. Secondly, the ability to distinguishing an object with greater clarity is due to the greater sensitivity of the central retina, called fovea the images that affect the fovea will therefore result more defined as those that will affect the peripheral areas of the retina. Therefore, it will result clearer the vision of the objects on which the gaze is projected directly, because their rays visuals will be in line with the hole of the pupil and the fovea; on the contrary, the images that they are displayed sideways, i.e. with the corner of the eye, they will remain blurred and less clear. Like other organs of the human body, the eyes also present themselves in pairs and collaborate in the realization of visual perceptions giving a sense of spatial depth to images two-dimensional that are formed on the curved surface of the retina. In fact, the eye globes have a certain possibility of movement so they can converge to capture the visual rays coming from an object (the convergence will be greater, the less is the distance from the object observed); in each of the eyes a slight image is then kept at a distance from the same object and our brain can convert this inequality of the two images in the perception of relief, or spatial depth. This vision, called stereoscopic, can be reproduced with a device (stereoscope) which allows the simultaneous viewing of two slightly different, related photographic images to the perception of the right and left eye, causing an illusion of spatial depth ( Fig 2-6 )
39 | P a g e .
Figure 2- 6 Stereoscopics or binocular vision
Source: https//airfreshener.club/quotes/capuchin-monkey-life-span.html
2.3. Eye Movements
There are at least three important reasons to understand eye movements in scene viewing. First, eye movements are critical for the efficient and timely acquisition of visual information during complex visual-cognitive tasks, and the manner in which eye movements are controlled to service information acquisition is a critical question. More generally, the interaction between vision, cognition, and eye movement control can be seen as a scientifically tractable testing ground for theories of the interaction between input, central, and output systems . The vast majority of our current knowledge of eye movement control in complex visual-cognitive tasks derives from studies of reading, but a complete theory will require generalization to other ecologically valid tasks like scene viewing. Second, how we acquire, represent, and store information about the visual environment is a critical question in the study of perception and cognition. Visualization is a dynamic process in which representations are built up over time from multiple eye fixations. The study of eye movement patterns during scene viewing contributes to an understanding of how information in the visual environment is dynamically acquired and represented. Finally, eye movement data provide an unobtrusive, online measure of visual and cognitive information processing.
2.3.1 Review of eye movements during visualization of scenes
Eye movement behavior during scene viewing can be divided in two relatively discrete temporal phases namely