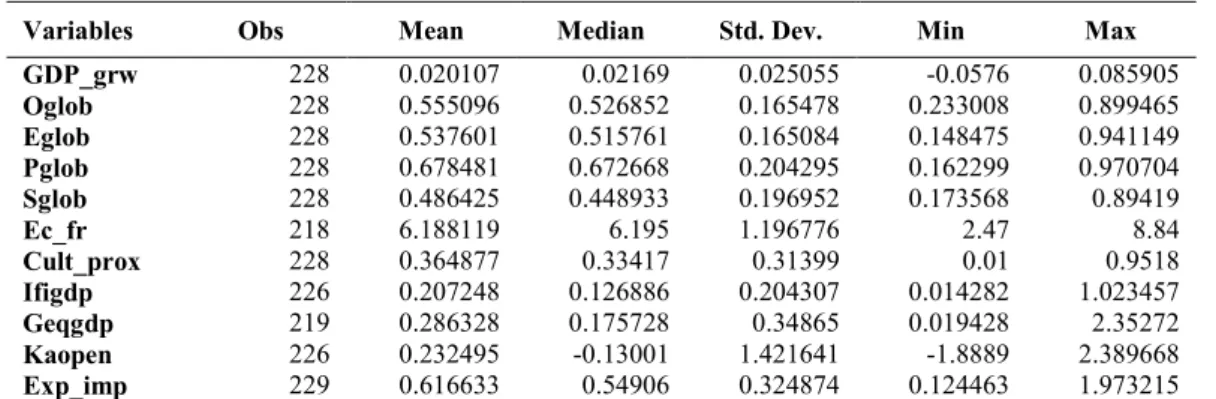
1
UNIVERSITA’ DEGLI STUDI DI MESSINA
DIPARTIMENTO DI ECONOMIA
Ph.D in Economics, Statistics and Management
XXX ciclo
____________________________________________________________________
Essay on Growth and Globalization
Tesi di Dottorato di:
Vincenza Testa
Tutor
Chiar.ma Prof.ssa
Silvia Rita Angilella
Co-Tutor
Chiar.ma Prof.ssa
Annalisa Russino
__________________________________________________________
ANNO ACCADEMICO 2016/2017
3
Contents
Introduction - Essay on Globalization and Growth ... 6
Chapter 1 - A survey of globalization indices ... 13
1 Complex Globalization indices ... 14
1.1 Dreher’s indices ... 14
1.2 Economic Freedom Index ... 19
2 Simple Globalization indices ... 24
2.1 Kaopen index ... 24
2.2 The Lane and Milesi-Ferretti’s indices ... 26
2.3 Trade Openness index ... 29
3 Review of the indices ... 29
Chapter 2 - Economic growth and Globalization ... 33
1 Introduction ... 33
2 Literature review ... 36
3 Methodology ... 41
4 Data ... 48
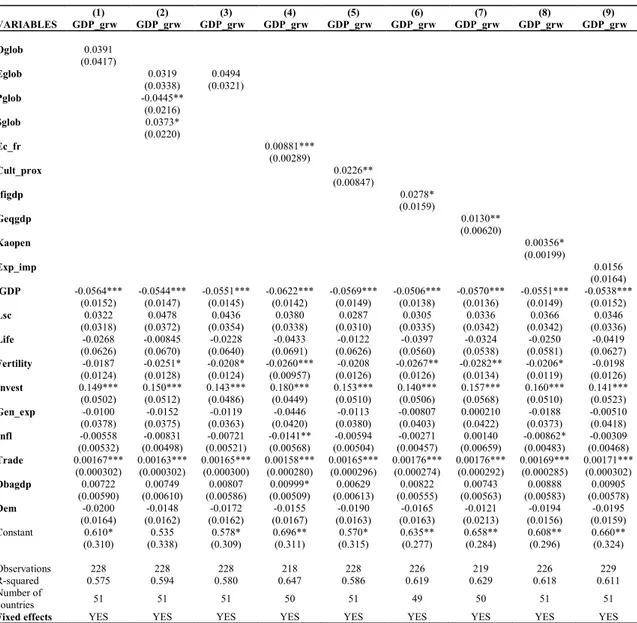
5 Empirical Results ... 52
5.1 Descriptive and preliminary analysis ... 52
5.2 Results ... 55
6 Conclusions ... 67
Appendix A ... 69
Appendix B ... 74
Chapter 3 - Macroeconomic Volatility and Globalization ... 80
1 Introduction ... 80
2 Literature review ... 82
3 Methodology ... 86
4 Data ... 91
5 Empirical Results ... 92
5.1 Descriptive and preliminary analysis ... 92
5.2 Results ... 95
6 Conclusions ... 104
4
APPENDIX B ... 115 APPENDIX C ... 116 References... 121
6
Introduction - Essay on Globalization and
Growth
Globalization process can be defined as the worldwide growth of the relationships among countries that regards all the aspect of their connexions: economic, financial, legal, social and cultural systems are involved in this process of change. It is an aggregate concept that denotes increasing global linkages created through cross-border flows. More integration among countries depends on different factors: a strong reduction of transportation and communication costs, a removal of barriers and tariffs on goods, services and capitals, and a reduction of geographical restrictions on knowledge, people and cultural environment (Samimi et al. 2011).
For three decades, globalization seemed to be an unstoppable and persistent trend. There has been not only an increasing volume of transactions between developed countries, but also an increasing stream of financial flows from companies situated in developed countries to developing countries to ensure new and potential resources. This is the results of a combination of pull factors, like changes in policies and liberalizations of capital accounts and markets, and push factors like business cycle conditions and macroeconomic policies (deregulation and disintermediation) (Prasad et al. 2003).
Globalization has generated a wide debate around benefits and costs derived from it. The benefits highlighted are multiple. The perceived isolation of emerging countries reduces thanks to the circulation of new knowledge and communication media. The current level of interconnection would be impossible without a globalized system. Domestic savings may rise; capital-rich countries invest in capital-poor countries taking a higher return on capital. Cost of capital may be lower since a better global allocation of risk allows diversifying risks and encouraging firms to take more investments. As a consequence of the increasing of capital flows, the stock market would be more liquid, reducing the equity risk premium and the cost of capital. The financial sector is more developed than before; the access to international markets is easier, new instruments of investment are introduced and an improvement in domestic markets is realized in a
7
context with more regulation, new supervisory authorities and transparency rules. Barriers, tariffs and restrictions to the international markets are eliminated, allowing a better circulation of goods, services, financial instruments, workers and knowledge (Prasad et al. 2003). The costs of globalization are mainly related to its influence on growth volatility and effects on developing countries. Emerging countries can have problems in managing the capital inflows and the shifts of international capital flows. For this reason, many policymakers from developing countries have questioned the choice of entering into a financial integrated system, casting doubts on the fact that the benefits deriving from the higher long-term growth can overcome the costs deriving from larger financial instability (Lane and Milesi-Ferretti, 2008).
International organizations and more developed countries have written the rules of this process and applied them to all countries, not considering the original situation and costs that globalization can cause to developing countries (Kose et al., 2011, Stiglitz, 2002, Dowrick and Golley, 2004). In many cases, the benefits of globalization have been lower than expected. The unstoppable trend of change has not left enough time for countries to adapt their political, cultural and social environment to the new situation. Crises developed in the entire world cast doubts on the benefits of globalization generating the suspicion that the connections between countries may lead to instability and macroeconomic and market volatility (Dellas and Hess, 2002).
The last decade represented a new era of globalization. From the Eighties, most of the countries, especially the emerging ones, are moving quickly towards an opened system. The concern about the issues related to the globalization phenomenon increases accordingly (Samimi et al. 2011). The growing gap between rich and poor has impoverished an increasing number of people in developing countries; poverty rates are constantly rising. In Africa, after the independence from the European countries, the living expectations, that improved in the past, start to decrease. Most of emerging countries are unable to attract foreign investments. Asian and Latin American crisis of the past decades have been a threat for all the emerging economies end their political stabilities and the risk of a currency collapse could have affected the entire economy. Countries coming from the communist model hoped that the new globalized system would have led prosperity and growth. However, the reality showed that the globalized economy might be worse (Stiglitz, 2002). Specifically, entering in a globalized system
8
may produce risks. The costs deriving from low stability and high volatility are shown in the years of economic crises and may overcome the benefits. Opening to capital flows and trade flows without the right initial conditions may lead to potential risks (Kose et al., 2011). Even controlling for particular initial characteristics of the countries, globalization may not contribute to speed up the growth process (Edison et al.,2002).
As mentioned above, globalization, as a complex phenomenon, affects the
economic, financial, legal, social and cultural systems. The effects are evident in the different environments, but they are also related, creating effects in the overall system interacting with each other. From the complexity of globalization derives the difficulty of measuring it (Samini et al. 2011). Over the years, several measures have been developed to capture the effects of the globalization phenomenon. In this thesis, I try to consider all the different aspects involved in the globalization process and all the sub-dimensions that can affect economic growth and macroeconomic volatility. I will provide a comparative analysis, starting from the existing literature, of the different globalization indices to verify whether overall globalization is able to influence growth or whether there are some specific aspect of globalization having an impact on it.
The thesis is structured as follows. The first chapter is an updated review of literature focused on globalization measures. The aim of this chapter is to consider all the different aspects involved in the globalization process and all the sub-dimensions that can affect economic growth and macroeconomic volatility. In particular, I analyze the different types of globalization measures, starting from the complex measures and arriving to specific sub-dimensions, identifying the different approaches used in the literature to find a proxy that well represents globalization. Different aspects of the globalization phenomenon may have distinct impacts on growth and affect differently the relationship leading to different conclusions. Comparing the alternative indices, it is possible to capture the dynamics between a specific aspect of the globalization phenomenon and growth. I will provide a comparative analysis of the different globalization indices proposed by the literature to verify whether a measure of overall globalization is related to growth or whether the relationship between growth and globalization is better captured by indices measuring specific aspects of globalization.
The second chapter provides an empirical analysis of a panel of countries to study the relationship between growth and globalization using both a static and a dynamic
9
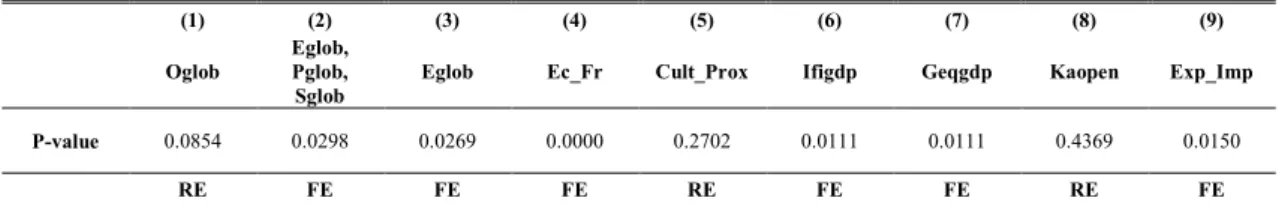
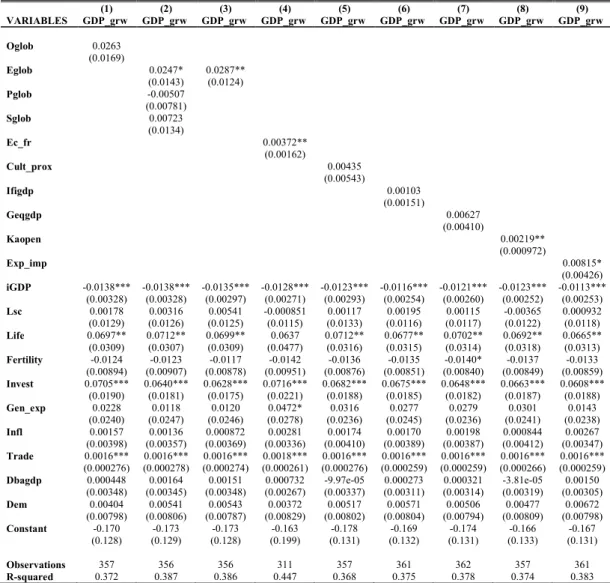
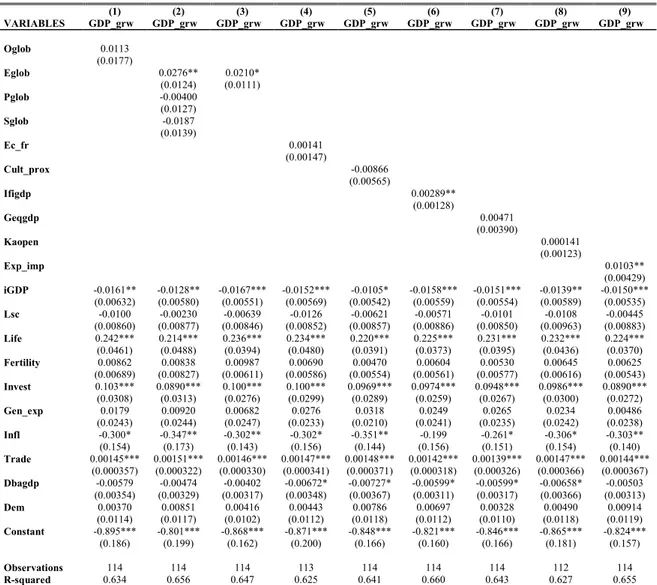
approach. I focus on a 5-years panel of 183 countries from 1970 to 2014 in order to capture the impact that different indices of globalization may have on growth. Focusing on indices capturing different aspects of the globalization phenomenon is useful to understand how a specific sub-dimension may go along with the others or go to different directions. Firstly, I develop a static approach starting from the Barro (2003) growth model adapted by Dreher (2006) to focus on economic integration. I take into account the different globalization indices stressed in Chapter 1: a capital openness index, a financial integration index, a trade openness index, social and political globalization indices, a cultural proximity index and an economic freedom index. I run a Pooled OLS (POLS) model and then I include Fixed Effects (FE) if appropriate. The results highlight that generally the most complex measures, fail to capture the relationship between globalization and growth while simple indices, focused on specific sub-dimensions of the globalization phenomenon, are positively related to growth. Secondly, I take into account the possible endogeneity of the globalization measures in the static analysis. To address this problem I develop two different settings: a IV model in which the globalization indices are instrumented using different instruments, and a dynamic model using the Arellano-Bond estimator in which the endogenous variables are instrumented by their lags. The results are in line with those obtained in the static analysis. Furthermore, I introduce the hypothesis that the initial economic development can be crucial in the relation between globalization and growth. Firstly, I introduce an interaction between globalization indices and the initial level of GDP per capita to verify the hypothesis that globalization may affect growth in a different way depending on the level of economic development. This setting assumes that the general underline structure of the model is the same for all countries. Secondly, I develop an approach based on a stronger assumption: the level of economic development may affect all the slope coefficients of the estimated regression model. I focus on two sub-samples, developed and developing countries. I split the original sample using the average level of the initial GDP per capita; countries with initial average GDP level below the overall average initial GDP are classified as developing, otherwise as developed. The results show that the initial level of economic development is important to capture the benefits deriving from the globalization process in terms of growth. Countries with higher initial level of economic development catch more benefits from the globalization with respect to the poorer countries.
10
The third chapter is an empirical analysis of the relationship between macroeconomic cycle volatility and globalization in European countries. In that chapter, globalization is measured from a financial point of view using the financial integration indices stressed in the first chapter. Firstly, I focus on a sample of European countries to verify if financial integration developed during the decades affect macroeconomic volatility. Secondly, introducing some control groups, I compare countries that are part of the Euro zone with those that are not. That is, in my setting, the financial integration is represented by the fact of being part of the Euro zone. I aim to verify if being part of the Euro zone may affect the macroeconomic cycle volatility.
I analyze output volatility using two different measures: the standard deviation of the growth rate of GDP per capita and the standard deviation of the cycle of the same measures, obtained applying the Hodrick-Prescott filter. I try to address the problems highlighted by the literature explaining the difficulty in finding significant results in empirical analyses. The first issue is related to the fluctuation of volatility over the years. This may make difficult to find a significant relationship between globalization and macroeconomic volatility. The descriptive analysis on my sample confirm the presence of fluctuations over the considered periods. The second issue is represented by a possible non-homogeneity of the sample. Countries belonging to the same macro-region are affected by the same cyclical conditions. Thus, in a non-homogeneous sample, it is difficult to detect a significant relation between globalization and cycle volatility. To capture the effect due to regionalism, I collect a panel of European countries with similar features. The third issue is the different nature of the shocks, temporary or permanent, that may affect output volatility differently (Razin and Rose, 1992). Using a Hodrick-Prescott filter allows focusing on the temporary shocks. I start the analysis on 41 European countries from 1970 to 2014. I firstly apply the POLS and then, if fixed effects are detected, I use the within estimator. I start from the regression model by Kose et al. (2003). As regressors, I use the financial integration indices highlighted in the first Chapter. This general analysis does not provide significant results. Then, to verify if the regionalism phenomenon affects the dynamics between globalization and growth volatility, I develop alternative specifications. Firstly, I introduce in the previous model a dummy identifying the countries that are Euro members and I interact it with the financial integration indices. The aim is to estimate the change in cycle macroeconomic
11
volatility caused by globalization in the Euro zone. Secondly, I develop a Difference in Difference (DD) estimator in which I assume that, in the absence of an entry in the Euro, volatility would have had a parallel path in treated and not treated countries. The results show that globalization affect positively output volatility. In order to check the robustness of the results I develop two alternative settings. Firstly, I re-run all the previous model, POLS, FE and DD using as dependent variable the private consumption volatility. In the European countries the household final consumption expenditures represents 55% of the GDP. Thus, consumption volatility may provide a robustness check to the output volatility. All the previous results are confirmed. Secondly, in order to provide a strong DD model, I reduce the sample to the countries that are part of the European Union (EU) in which the parallel path assumption is more robust due the fact that these countries represent a more homogeneous sample. The analysis strongly confirms that globalization affect positively both output and consumption volatility.
13
Chapter 1 - A survey of globalization indices
Globalization is a complex phenomenon that affects the economic, financial, legal, social and cultural systems. The effects related to the global linkages are evident in the different environments, but these tend to be connected between them, creating effects in the overall system, interacting with each other and generating a network of people, ideas, data, goods and capitals (Clark, 2000).
Due the complexity of the connections involved in the globalization process, it becomes difficult to measure them empirically. Over the years, several measures have been proposed to capture the effects of the globalization phenomenon. Some scholars focus on complex indices obtained using statistical procedures that combine in only one index all the sub-dimensions related to the globalization process (Dreher, 2006, Gwartney and Lawson, 2003). Others prefer to concentrate specific aspects of globalization creating indices focusing on them (Chinn and Ito, 2008, Lane and Milesi-Ferretti, 2003). The aim of this chapter is to introduce different measures of globalization, to understand the differences among them, and to provide a preliminary descriptive analysis of the indices that are used in the next chapters. To this end, in the following sections, I present a descriptive analysis based on the sample of countries used for the analyses in this thesis. The sample covers the period 1970-2014 and includes 183 countries. The whole sample is split into two sub-samples on the basis of the average initial level of GDP per capita. Countries with an initial GDP per capital greater than the average level are labelled as
Developed, while countries with an initial GDP per capital lower than the average level
are considered as Developing.
In this thesis, I focus on both the overall measures of globalization and measures related to the sub-dimensions of the globalization phenomenon to provide a comparative analysis of the different indices used in the literature.
I analyze the different types of globalization measures, starting from the complex measures and arriving to the measures related to specific sub-dimensions, discussing the
14
different approaches used in literature to find a proxy that well represents globalization. Different aspects of the globalization phenomenon may have different impact on growth and affect the relationship in ways that may lead to different conclusions. Comparing the different indices, it is possible to capture the dynamics between a specific aspect of the globalization phenomenon and growth.
1 Complex Globalization indices
I start dividing the globalization indices used in the empirical analysis based on the method employed to construct them. The first group of indices are complex indices constructed using statistical procedures like Principal Component Analysis, PCA, that combines different sub-indices in order to synthetize in a single measure many aspects of a complex phenomenon.
The second group of indices used in the empirical analyses are simple indices. They are proxies representing specific dimensions used to capture defined aspects of the globalization process.
1.1 Dreher’s indices
Dreher (2006) considers the overall impact of globalization on economic growth, highlighting that the effect of a single sub-dimension of globalization on growth can lead to misunderstanding the real relationship leaving aside some important aspects. The Overall Globalization Index he proposes aims to capture the complexity of the phenomenon.
He starts from three different indices that measure single aspects of globalization: economic, social and political globalization. These are obtained combining other related sub-indices.
To construct the proxies, each variable is transformed to an index from zero to ten using the transformation ((𝑉𝑖− 𝑉𝑚𝑖𝑛)/(𝑉𝑚𝑎𝑥− 𝑉𝑚𝑖𝑛) ∗ 10); the higher the value, the more globalized is the country. All the indices are obtained through a PCA appropriately weighting the single measures to account for the data variability.
15
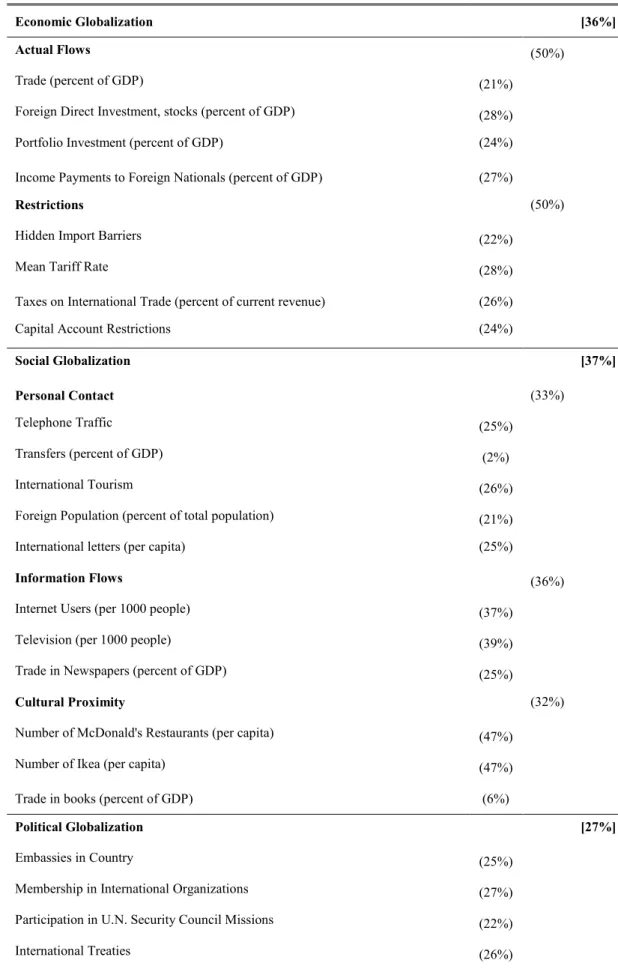
To measure Economic Globalization, he constructs two sub-indices. The first one measures the Actual Flows in percent of GDP. It contains variables like Trade, Foreign Direct Investment, Portfolio Investment and Income Payments to Foreign Nationals. The second one is Restrictions on trade and capital. It contains variables like Hidden Import Barriers, Mean Tariff, Taxes on International Trade in percent of current revenues, and Capital Account Restrictions. Figure 1 shows how Economic Globalization Index is higher in developed countries and it constantly increases.
Figure 1. Economic Globalization Index
Economic Globalization Index in Developing and Developed Countries
The second index of Social Globalization, is obtained from three measures. The first one is constructed using data on Personal Contacts and it is based on variables like Telephone Traffic, Transfers in percent of GDP, International Tourism, Foreign Population in percent of total population, and International Letters per capita. The second one measures the Information Flows and it uses data on Internet Users, Televisions and Trade in newspapers. The last one represents the Cultural Proximity measured as the dominance of products consumed all over the world. It is constructed using the Number of McDonald’s restaurants per capita, the Number of Ikea per capita and Trade in books in percentage of GDP. In the empirical analysis, I will use both the overall Social Globalization index and the Cultural Proximity sub-index.
0 .2 .4 .6 .8 Eco n omi c G lo ba liza tio n In d ex 1970 1975 1980 1985 1990 1995 2000 2005 2010
Economic Globalization Index by Countries
16
Figure 2. Social Globalization Index
Social Globalization Index in Developing and Developed Countries
Figure 3. Cultural Proximity Index
Cultural Proximity Index in Developing and Developed Countries
As it is shown in Figure 2, for the Developed sample the Social Globalization index is increasing while for Developing sample it is constant in the first periods until 1990 and then it grows. As before, from Figure 3, the Cultural Proximity index constantly increases in Developed samples, while for Developing ones increases between 1990 and 1995, in the other periods the index is almost constant but the gap between the two sub-samples is more emphasized.
The last index, measuring the degree of Political Globalization, is constructed using the Number of Embassies in a Country, the Number of International Organizations of which the country is a member, the Number of Participations in U.N. Security Council
0 .2 .4 .6 So ci al G lo ba liza tio n In d ex 1970 1975 1980 1985 1990 1995 2000 2005 2010
Social Globalization Index by Countries
Developing Developed 0 .1 .2 .3 .4 .5 C u ltu ra l Pro xi mi ty In d ex 1970 1975 1980 1985 1990 1995 2000 2005 2010
Cultural Proximity Index by Countries
17
Missions, and the number of International Treaties signed. Figure 4 shows that Political Globalization has been steadily increasing over the years in both the developed and the developing sub-samples.
Figure 4. Political Globalization Index
Political Globalization Index in Developing and Developed Countries
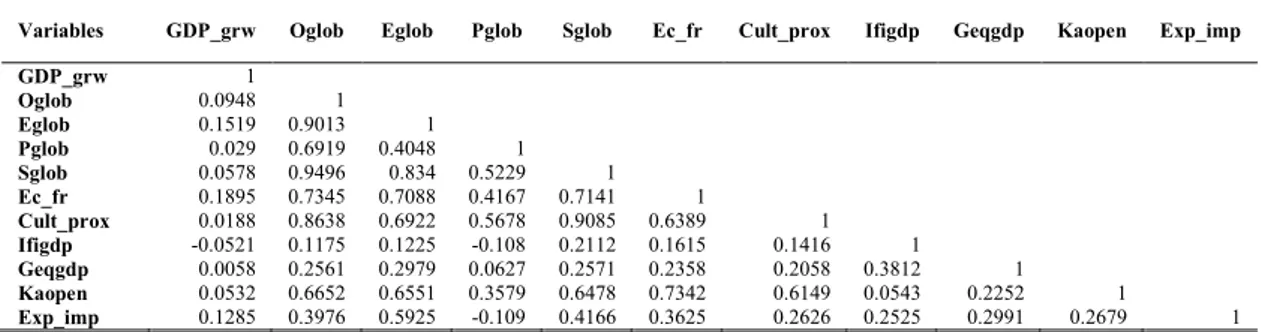
Table 1 reports the last version of the Dreher’s indices released in 2017, the results of the PCA, and the weights of the single variables. We can observe from the table that the most important component are the Social and the Economic measures accounting, respectively, for the 37% and the 36% of the total variability. The Political sub-dimension is less relevant to determine the Overall index. In the following analyses I use the Overall index and the Economic, Political and Social indices, but also the sub-index Cultural Proximity to capture a specific aspect related to the consumption habits of people.
0 .2 .4 .6 .8 Po lit ica l G lo b al iza tio n In de x 1970 1975 1980 1985 1990 1995 2000 2005 2010
Political Globalization Index by Countries
18
Table 1. Dreher’s Globalization indices
Economic Globalization [36%]
Actual Flows (50%)
Trade (percent of GDP) (21%)
Foreign Direct Investment, stocks (percent of GDP) (28%)
Portfolio Investment (percent of GDP) (24%)
Income Payments to Foreign Nationals (percent of GDP) (27%)
Restrictions (50%)
Hidden Import Barriers (22%)
Mean Tariff Rate (28%)
Taxes on International Trade (percent of current revenue) (26%)
Capital Account Restrictions (24%)
Social Globalization [37%]
Personal Contact (33%)
Telephone Traffic (25%)
Transfers (percent of GDP) (2%)
International Tourism (26%)
Foreign Population (percent of total population) (21%)
International letters (per capita) (25%)
Information Flows (36%)
Internet Users (per 1000 people) (37%)
Television (per 1000 people) (39%)
Trade in Newspapers (percent of GDP) (25%)
Cultural Proximity (32%)
Number of McDonald's Restaurants (per capita) (47%)
Number of Ikea (per capita) (47%)
Trade in books (percent of GDP) (6%)
Political Globalization [27%]
Embassies in Country (25%)
Membership in International Organizations (27%)
Participation in U.N. Security Council Missions (22%)
19
Figure 5 shows that the Overall globalization index, has been increasing reflecting the increase of its sub-components. The gap between the two sub-samples is almost constant
Figure 5. Overall Globalization Index
Overall Globalization Index in Developing and Developed countries
Dreher (2006) studies the relationship between globalization and growth. He uses a sample of 123 countries and he finds that globalization is positively related to growth. The dynamic analysis shows that the Overall Globalization index is positive and significantly associated with growth. When he tries to identify which component is more important specifying models including the three different sub-indices, he finds that only the Economic Index is significantly related to growth, while the Social and Political indices have no influence on the GDP growth rate.
1.2 Economic Freedom Index
The index proposed by Gwartney and Lawson (2003) is also a complex index; it is
an attempt to revise previousindices of Economic Freedom enlarging the structure of
the component in order to have a more comprehensive index that reflects also the legal and regulatory structure. It is not a pure proxy of the globalization phenomenon but it
0 .2 .4 .6 .8 O ve ra ll G lo b al iza tio n In de x 1970 1975 1980 1985 1990 1995 2000 2005 2010
Overall Globalization Index by Countries
20
contains a specific section that describes freedom to exchange and trade openness. It has elements that measure specific aspects of the international trade environment as taxes, mean tariffs, hidden import barriers, international capital. Generally, economic freedom and globalization seem to be closely related. Empirical studies suggest that economic freedom affects globalization rather than the opposite (Macedo et al. 2007). Following this result, I choose to use this complex variable as a proxy of the globalization phenomenon.
The economic freedom index is constructed collecting data in five key areas as shown in Table 2. The variables used are important to define the level economic freedom in a country in terms of personal choices, voluntary exchange, freedom to compete, protection of property rights and persons. If a country presents a high level of economic freedom, personal choices of the consumers are important to define which goods and services are produced and traded. In this context, the legal environment promotes economic freedom providing a system able to guarantee voluntary exchange, protection for consumers and of property rights. Moreover, the monetary system should promote access to sound money, money that has a purchasing power determined by markets and
is independent of governments and political parties, to remove obstacles to trade.
International trade and taxes, mean tariffs, hidden import barriers, international capital controls affect economic freedom and more generally globalization (Gwartney and Lawson, 2003). Economic freedom comprehends also political and civil liberties and the possibility to trade with foreign countries. The components of the index are the following,
Table 2. Economic Freedom index
Area I: Size of government: expenditures, taxes, and enterprises
A. General government consumption spending as a percentage of total consumption B. Transfers and subsidies as a percentage of GDP
C. Government enterprises and investment as a percentage of GDP D. Top marginal tax rate (and income threshold to which it applies)
Area II: Legal structure and security of property rights
A. Judicial independence: the judiciary is independent and not subject to interference by the government or parties in disputes (GCR)
B. Impartial courts: a trusted legal framework exists for private businesses to challenge the legality of government actions or regulation (GCR)
C. Protection of intellectual property (GCR)
21
E. Strength and impartiality of the legal system and popular observance of the law (ICRG)
Area III: Access to sound money
A. Average annual growth of the money supply in the last five years minus average annual growth of real GDP in the last ten years
B. Standard deviation of annual inflation in the last five years C. Annual inflation in the most recent year
D. Freedom of citizens to own foreign currency bank accounts domestically and abroad
Area IV: Freedom to exchange with foreigners
A. Taxes on international trade
i. Revenue from taxes on international trade as a percentage of exports plus imports ii. Mean tariff rate
iii. Standard deviation of tariff rates B. Regulatory trade barriers
i. Hidden import barriers: No barriers other than published tariffs and quotas (GCR)
ii. Costs of importing: the combined effect of import tariffs, licence fees, bank fees, and the time required for administrative red-tape raises costs of importing equipment by (10 = 10% or less; 0 = more than 50%) (GCR)
C. Actual size of trade sector compared to expected size
D. Difference between official exchange rate and black market rate E. International capital market controls
i. Access of citizens to foreign capital markets and foreign access to domestic capital markets. (GCR) ii. Restrictions on the freedom of citizens to engage in capital market exchange with foreigners—index of capital controls among 13 IMF categories
Area V: Regulation of credit, labor, and business
A. Credit Market Regulations
i. Ownership of banks: percentage of deposits held in privately owned banks ii. Competition: domestic banks face competition from foreign banks (GCR) iii. Extension of credit: percentage of credit extended to private sector
iv. Avoidance of interest rate controls and regulations that lead to negative real interest rates
v. Interest rate controls: interest rate controls on bank deposits and/or loans are freely determined by the market (GCR)
B. Labor Market Regulations
i. Impact of minimum wage: the minimum wage, set by law, has little impact on wages because it is too low or not obeyed (GCR)
ii. Hiring and firing practices: hiring and firing practices of companies are determined by private contract (GCR)
iii. Share of labor force whose wages are set by centralized collective bargaining (GCR)
iv. Unemployment benefits: the unemployment benefits system preserves the incentive to work (GCR) v. Use of conscripts to obtain military personnel
22
C. Business Regulations
i. Price controls: extent to which businesses are free to set their own prices
ii. Administrative conditions and new businesses: administrative procedures are an important obstacle to starting a new business (GCR
iii. Time with government bureaucracy: senior management spends a substantial amount of time dealing with government bureaucracy (GCR)
iv. Starting a new business: starting a new business is generally easy (GCR)
v. Irregular payments: irregular, additional payments connected with import and export permits, business licenses, exchange controls, tax assessments, police protection, or loan applications are very rare (GCR)
Economic Freedom Index: sub-indices. GCR= Global Competitiveness Report. ICRG = International Country Risk Guide.
The components of the Area I are representative of how much consumer’s choices and markets affect the production and distribution process. As Government size increases, the economic freedom decreases. Area II is representative of the legal system: protection of property rights, the independence and impartiality of the judiciary system, the security of the enforcement of the contracts are crucial elements to improve economic freedom (Gwartney and Lawson, 2003).
Area III focuses on sound money defined as money that has a purchasing power determined by markets, and is independent of governments and political parties. Economic freedom is linked to the possibility that consumer have to access to sound money. It is also included the role of the inflation phenomenon in the pricing of goods (Gwartney and Lawson, 2003).
Area IV is an important component regarding the globalization phenomenon. Trade openness is a crucial element of economic freedom. In recent times, free movement of the capitals has given an important push to international trade: a large amount of the consumed products comes from abroad modifying the habits of the people. However, countries have retained some kind of restrictions limiting the global transactions in order to protect domestic trade from the foreign competition. This area measures the restrictions, such as tariffs, barriers, and capital controls, charged to limit international trade (Gwartney and Lawson, 2003).
Area V includes measures related to restrictions on credit, labor and business. In particular, restraints on credit can affect the possibility to access to a foreign bank and the competition between domestic and foreign banks. While restrictions on business (like price controls, bureaucracy, additional payments related to the authorization to import
23
and export, and licenses) can limit the activity of the firms at national level but also the possibility to enter in globalized markets (Gwartney and Lawson, 2003).
To construct the Economic Freedom Index, Gwartney and Lawson try different strategies to aggregate the components of the overall index that synthetize all related sub-indices. Firstly, they assign equal weights to each component. Secondly, they construct the weights inversely with respect to the standard deviations distribution of the components. Thirdly, they follow a reasoned economic analysis, index by index, discussing the single weight should be assigned to each measure. Finally, in their most recent paper, they use a PCA to define the weights of each sub-indices. The authors discuss the problems found to construct the final index. Despite they have tried different methods, none of them seems completely acceptable. The last version of the index uses a PCA. This strategy is satisfactory from the statistical point of view, but can have the weakness of not considering the advices of the economic theory about the importance that some areas should have with respect to others.
Figure 6 shows the temporal pattern of the Economic Freedom index obtained through PCA. The index is decreasing until 1980 and then it increases over the years; in the three last periods, it is almost constant in the Developed sample, while in the sample of Developing countries it is constantly increasing from the Eighties.
Figure 6. Economic Freedom Index
Economic Freedom Index in Developing and Developed Countries
0 2 4 6 8 Eco n omi c F re e do m In de x 1970 1975 1980 1985 1990 1995 2000 2005 2010
Economic Freedom Index by Countries
24
2 Simple Globalization indices
The following indices aim to represent a specific dimension of the globalization phenomenon. As stressed before, complex indices may create problems in the empirical application since they use a lot of information. The reason that leads to the use of more specific indices is that different aspects of the globalization phenomenon may have different impact on growth and affect the relationship between globalization and growth in a different way. Thus, an overall measure of globalization may fail to detect a relationship with growth because of the impact of counterbalancing forces.
The alternative is to focus on specific sub-dimensions of the globalization phenomenon. In this thesis, I use a simple index describing financial integration and trade openness.
2.1 Kaopen index
Chinn and Ito (2008) develop a new index of Capital Openness in order to overcome the previous measures unable to capture capital controls and their intensity. They criticize the binary variables based on the Annual Report on Exchang+e Arrangements and Exchange Restrictions (AREAER) made by the IMF and other aggregate measures that cannot allow to capture all the aspects of capital controls. They start from binary dummies described in the AREAER representing restrictions on foreign financial transactions; in particular, the above-mentioned variables indicate
the existence of multiple exchange rates (𝑘1);
restrictions on current (𝑘2) and capital account transactions (𝑘3);
the obligation of the submission of export profits (𝑘4);
This classification was valid until 1996, afterwards the IFM modified the categories
in order to capture the complexity of the capital control policies; especially for 𝑘3 was
indicated a list of 13 variables to take into account the capital account transactions (Chinn and Ito, 2008). They used this classification and the subsequent changes to construct the Kaopen index inverting the dummies in order to emphasize the financial openness rather
25
To capture the effect of capital controls they consider a 5-year period, including the years in which there were not controls, to construct the following index
𝑆𝐻𝐴𝑅𝐸𝑘3,𝑡 = (𝑘3,𝑡+ 𝑘3,𝑡−1+ 𝑘3,𝑡−2+ 𝑘3,𝑡−3+ 𝑘3,𝑡−4
5 )
To construct the Kaopen index they use a PCA, extracting the first standardized component of 𝑘1,𝑡, 𝑘2,𝑡, 𝑆𝐻𝐴𝑅𝐸𝑘3,𝑡 and 𝑘4,𝑡.
The aim of this index is to measure the intensity of capital controls taking into account the different types of restrictions that are related to foreign transactions (Chinn and Ito, 2008).
Figure 7. Kaopen Index
Kaopen Index in Developing and Developed Countries
Figure 7 shows that Kaopen in Developed countries is constantly increasing; it starts negative and then it becomes positive. For the developing sample, the index is always negative; it has his minimum in the Eighties and then it increases until 2005.
-1 -. 5 0 .5 1 Ka o pe n In de x 1970 1975 1980 1985 1990 1995 2000 2005 2010
Kaopen Index by Countries
26
2.2 The Lane and Milesi-Ferretti’s indices
Lane and Milesi-Ferretti (2003) study the dynamics of the increasing links among countries due to the financial integration. They provide a set of measures representing the composition of the Flows of Capital using foreign assets and liabilities considering them as drivers of the growth of international financial integration. They study the relation between rates of return on foreign investments and others returns and the relation between national and international rate of returns and the fluctuations of the exchange rate. Foreign assets and liabilities are used to measure global linkages of the countries. They can take advantages from this flow of capitals hedging the domestic investment risk, but, on the other hand, they could also cause an increase in volatility. Assets and liabilities are provided using the methodology of IMF and divided into categories
foreign direct investment (FDI), portfolio equity investment, portfolio debt investment, other investment,
derivatives,
official reserves (provided just for assets)
The first measure of international financial integration that I use in this thesis is a measure based on the stocks of external assets and liabilities,
𝐼𝑓𝑖𝑔𝑑𝑝𝑖𝑡 =𝐹𝐴𝑖𝑡+ 𝐹𝐿𝑖𝑡
𝐺𝐷𝑃𝑖𝑡
where 𝐹𝐴𝑖𝑡 represents total external assets and 𝐹𝐿𝑖𝑡 represents total external liabilities.
Total assets contain portfolio equity assets, FDI assets abroad, total debt assets, reserves, and derivatives assets. Total liabilities contain portfolio equity liabilities, FDI liabilities abroad, total debt liabilities and derivatives liabilities. These variables represent transitory capitals and are quite high for financial centers (Lane and Milesi-Ferretti, 2003)
27
Figure 8. Ifigdp Index
Ifigdp Index in Developing and Developed Countries
Figure 8 plots the evolution of the Ifigdp index over the period considered in the empirical analysis. Until 1985 the index is substantially constant in both samples, afterwards it starts to increase. Starting from 1990, it dramatically increases in the developed sample highlighting how much globalization and capital openness allow making investments abroad. For emerging countries after a peak in 1990, the index starts to decrease slowly. The figure shows a remarkable difference between them.
The second index I used is a measure that involves the equity market and capitals abroad,
𝐺𝑒𝑞𝑔𝑑𝑝𝑖𝑡 =
(𝑃𝐸𝑄𝐴𝑖𝑡+ 𝐹𝐷𝐼𝐴𝑖𝑡+ 𝑃𝐸𝑄𝐿𝑖𝑡+ 𝐹𝐷𝐼𝐿𝑖𝑡)
𝐺𝐷𝑃𝑖𝑡
where 𝑃𝐸𝑄𝐴𝑖𝑡 is the stock of portfolio equity assets, 𝑃𝐸𝑄𝐿𝑖𝑡 is the stock of portfolio
equity liabilities, 𝐹𝐷𝐼𝐴𝑖𝑡 is the stock of foreign direct investment asset and finally 𝐹𝐷𝐼𝐿𝑖𝑡
is the stock of foreign direct investment liabilities. It is a measure of the level of equity considering both foreign investments and portfolio investments (Lane and Milesi-Ferretti, 2003) 0 2 4 6 8 Ifi g dp In d ex 1970 1975 1980 1985 1990 1995 2000 2005 2010
Ifigdp index by Countries
28
Figure 9. Geqgdp Index
Geqgdp Index in Developing and Developed Countries
Figure 9 shows the temporal pattern of the index. The 1990 period marks a significant difference with the past in the developed sample. With respect to the Ifigdp
Index the growth is larger and faster, more than tripling its value. In emerging countries,
there is a slight increase over time.
Lane and Milesi-Ferretti (2003) analyze the features that can influence international asset exchanges and possible costs and benefits deriving from it. As the account openness grows, the international assets cross-holdings grow. Secondly, they examine the relationship between trade in assets and trade in goods and services. Trade in goods may affect directly assets trade since it involves financial transactions and consumers who accept to buy foreign goods that produce cross-border financial transactions may accept to invest in foreign assets reducing the home bias present in equity markets.
Summarizing their results, they found that variables like trade openness, the level of GDP per capita, and variables measuring financial market's depth, like Stock Market Capitalization, are positively associated to international financial integration.
0 1 2 3 4 G e qg dp In d ex 1970 1975 1980 1985 1990 1995 2000 2005 2010
Geqgdp index by Countries
29
2.3 Trade Openness index
It describes how much a country is open to Foreign Trade. It is used in many papers (Barro, 2003, Dreher, 2006) to simply describe the trade openness. It is obtained from the World Bank database. It is the sum of exports and imports of goods and services measured as a share of GDP.
Figure 10. Trade Openness Index
Trade Openness in Developing and Developed Countries
Figure 10 shows that the Trade openness is constantly increasing since 1985 in both Developed and Developing sample.
3 Review of the indices
The indices highlighted before represent attempts to measure the globalization phenomenon. Simple and complex indices have both advantages and disadvantages.
Through complex indices scholars try to capture the different sides of the globalization synthetizing them in one single index. In order to evaluate this kind of indices, several aspects should be considered. Firstly, the number of sub-indices involved. When many sub-indices are used, the complexity of the obtained index increases and it becomes difficult to understand the meaning of the constructed index and which aspect,
0 .2 .4 .6 .8 1 T ra de o pe nn ess In de x 1970 1975 1980 1985 1990 1995 2000 2005 2010
Trade openness index by Countries
30
among the different components, is relevant. Some variables can be redundant and they may add complexity to the analysis without giving relevant extra information. Thus, in this case it is recommended to discard some of them (Jolliffe, 1972). At the same time, a large number of information may be not available for some countries and for some periods and this may reduce the temporal and spatial extent of the index (Samimi, 2011).
Secondly, the method used to establish the weight of the sub-indices. The complex index presented in this thesis are constructed using a PCA. The main purpose of the PCA is to reduce the size of data that are closely related to each other, trying to preserve as much as possible the variations between them. This is accomplished transforming the data into a new set of variables, the Principal Components (PCs), using weights obtained maximizing the variance of these components. The advantage of the PCA is due to the fact that PCs are able to capture the variability among the variables reducing the dimension and keeping as much variation as possible. However, this statistical technique has been criticized in the empirical work since it can be difficult to interpret the PCs (Zou et al., 2006). In addition, it is important to consider just the sub-indices that are really necessary. Adding sub-indices with insignificant weights may increase complexity and it may lead to weak indices (Samimi, 2011). This issue is not present in the construction of the Dreher’s index and of the Economic Freedom Index. Those indices are built using a lot of sub-indices but all of them have an important weight in the final index. The general advantages and disadvantages related to the PCA may be attributed to the complex indices used in the following analysis. However, the proposed indices have distinct levels of complexity depending on the initial number of variables used to obtain the final index.
Thirdly, the geographical adjustment. It may be important to control for the geographical features of the countries to better understand the globalization process (Samimi, 2011). For example, geographical features influence trade intensity and transportation costs. Panama’s trade intensity is much higher than that of the United States due its geographical position, but that does not mean that the globalization level of Panama is much higher than that of the United States (Dreher et al. 2009). Correcting for the geographical factors may increase the efficiency of the index to measure globalization. Dreher’s index does not make any geographical adjustment.
Finally, the dimensions of globalization involved. The first important dimension is the economic one. Usually it covers the flows of capital and goods and the restriction on
31
them. The second is the social dimension that typically involves data about culture and information flows among people. The last dimension is the political one. It considers the participation to international treaties and organizations. Considering all these aspects, the Dreher’s index is a very complete index (Samimi, 2011).
Single indices are constructed in order to capture a specific aspect of the globalization phenomenon. With respect to the previous indices, they do not suffer from the weaknesses deriving from the PCA. The trade and financial openness indices analyzed before may be divided into de jure and de facto measures. For instance, measures of stock of capital flows usually try to capture the de facto financial openness, while measures of legal restrictions, indicating how much a country is closed to the foreign markets by law, represent de jure measures of financial openness (Prasad et al., 2003). However, since they are specific measures, they may not contain all the information needed to define the whole openness degree, and they may not be able to capture precisely the real level of globalization (Samimi, 2011). For instance, financial openness measures based on restrictions on foreign transactions may not grasp the degree of openness. It may be inappropriate to use them as proxy of the globalization phenomenon considering them as overall measures of globalization.
33
Chapter 2 - Economic growth and Globalization
1 Introduction
From the Eighties, many changes have happened in the international economic context: national economic policies aimed at increasing the level of integration, advance the technological progress, access new markets, reduce transportation and communication costs and financial innovations stimulated cross-border capital flows.
In this scenario, globalization becomes a growing phenomenon with a persistent trend. From an economic and financial point of view, the potential benefits that globalization may allow to achieve are many. Firstly, the augmentation of domestic savings. Capital-rich countries can invest in capital-poor countries getting a higher return on capital. Secondly, the possibility to incur a lower cost of capital. A better global allocation of capital allows risk diversification and encourage firms to take more investments. Because of the capital flows increase, the stock market would be more liquid, reducing the equity risk premium and the cost of capital (Prasad et al. 2003). Thirdly, the transfer of knowledge and technology. People movements and new technology related to the information flows make easier the diffusion of knowledge across countries. The integration generates an improvement of management practices and production processes even in those countries that do not have the appropriate basic skill but, through the circulation of knowledge, they became able to develop them. This process may have positive implications on productivity growth, (Grossman and Helpman, 2015). Fourthly, the development of the financial sector makes the access to international markets easier. New instruments of investment are introduced and improvements in domestic markets are realized in a context with more regulation, new supervisory authorities and transparency rules. Finally, the elimination of barriers and tariffs, or other restrictions to international transactions, allows a better circulation of goods, services, financial instruments, workers and knowledge (Prasad et al . 2003).
Besides the benefits that countries can achieve entering in a global financial system, there are costs that they can expect to pay. The greater interconnection between countries
34
can lead to economic fluctuations generated by the economic crises alternated with growth period. When the system is globalized the effects of these instabilities are propagated in an endemic way. The volatility of the economic performances can be related to it. Furthermore, the single markets are pushed to achieve certain standards and adopt precise rules in terms of regulation and transparency, giving up their peculiarities and losing autonomy (Prasad et al. 2003).
Scholars have discussed about the relationship between globalization and growth; the literature section reports the different point of views related to the topic. One important step discussed by scholars and stressed in the first chapter of this thesis is the difficulty to find a proxy to measure the globalization process. As a complex phenomenon that influences many aspects of the modern society, it needs different measures that capture all the aspects. As emphasized in the previous chapter, many studies focus on a single sub-dimension of globalization like trade openness, capital account openness, financial integration, social and political globalization. Others focus on an overall concept of the globalization that comprehends all the single ones. I try to overcome this partial point of view considering the effects of globalization on economic growth providing a comparative analysis of the different indices used in the literature taking into account one by one the economic, financial, social and political aspect. Each of these features may be related to growth differently and may have a distinct impact in terms of increase of the growth rate.
Some scholars have developed measures obtained by statistical procedures that, starting from a high number of globalization components, reduce the data and obtain a synthetic index that summarizes all the components. Others have used measures aimed to capture single aspects of integration. Using these different indices representing distinct aspects of the integration process, I will provide a general overview of the phenomenon trying to understand how growth and globalization interact and which aspect is crucial for this interaction.
This work aims to study globalization as a complex phenomenon that has changed the links among countries; it tries to understand the effects of globalization on developed and developing countries and to establish a possible relationship between globalization and economic growth. Considering globalization as a complex phenomenon that affects financial, economic, social, political and cultural aspects, I start from the debate about the
35
contribution that globalization may provide to increase the performance of a single country. The existing empirical evidence suggests that is difficult to establish a strong causal relation between economic growth and globalization due to the complexity of the relationships involved (Rodrik, 1998, Kose et al., 2011, Stiglitz, 2002). I try to provide a more complete representation of the relationship between globalization and growth with respect to studies focusing on single aspects. Moreover, I provide a comparison of results across single measures and countries.
I start from the Barro (2003) growth model in the new version developed by Dreher (2006) more focused on economic integration. I analyze the relationship between globalization and growth taking into account all the different sub-dimensions of the globalization process and their effects on growth. Globalization is a long-term phenomenon and it needs a few years to give a significant contribution to the economic environment. As Barro suggests, I use a 5-years panel database that is extended from 1970 to 2014 and it covers 183 countries. With respect to the Dreher’s analysis, I extend the time-period and the number of countries to compensate the lack of data due to data availability. I take into account different globalization indices: a capital openness index, a financial integration index, a trade openness index, social and political globalization indices, a cultural proximity index and an economic freedom index. All the above mentioned indices capture a specific feature of the globalization process and can be linked up to growth differently. In order to capture these possible influences, the indices have been used one by one in different regressions.
Furthermore, I introduce the idea that the initial level of economic development can have a key role to explain the relationship between globalization and growth. The initial GDP per capita, used as a control variable in the general model, helps to capture this assumption considering that the underlying relationship of the model is the same for all the countries. In this setting, the initial level of GDP per capita will only change the intercept of the estimated model. Nevertheless, the initial economic development may also affect the slope coefficients of the estimated regression model. That is, different level of initial economic development may change the underlying relationship of the model. Under the hypothesis that only the slope coefficient of the globalization variable is affected, the effect of the initial level of GDP per capita can be estimated including an interaction between the globalization variable and the initial level of GDP per capita. In
36
the more pervasive case where the entire model is affected it is necessary to identify separate sub-samples. I follow both strategies. In the last part of the paper I analyze two sub-samples, developed and developing countries, obtained splitting the overall sample by the average initial level of GDP per capita. Using the two sub-samples, I verify if economic growth is affected by globalization in a different way for countries with different levels of economic development and countries with higher levels of GDP per capita can benefit more from globalization, with respect to countries with a lower level of GDP per capita. One of the problem often blamed on developing countries is that they enter into a globalized market without the right initial conditions that can ensure stability and then they are unable to capture the benefits from the integration process, only bearing the costs arising from it (Kose et al., 2011). The response of developed and developing countries may be different and may depend on the features of the countries. Developed countries may catch more benefits than the developing ones, because they have infrastructures (economic, social, markets etc.) able to adapt to the changes coming from the integration process. This analysis allows figuring out differences across countries and capturing the different reaction of the GDP growth rates that could be lost analyzing one large sample containing all the countries. In this further analysis, the aim is twofold. On the one hand, I aim to show that the initial level of economic development is essential to understand the relationship between globalization and the GDP growth rate. On the other hand, I want to verify if entering in a globalized system could be an important step in developing markets that aspire to reach the higher levels of economic development and stability achieved by developed economies. In other words, I try to understand whether globalization can be a key factor to promote growth when a country has a low level of economic development.
2 Literature review
As a complex phenomenon, globalization may affect many aspects of the economy like trade, economic development, financial sector, monetary and macroeconomic policies and so on. Many economists and policymakers have been interested in the characteristics and implications of the globalization process. Some of them study the effect of globalization on inequality (Beer and Boswell, 2001). Rogoff (2006) and Bernanke
37
(2007) are interested in the implications of globalization for the conduct and effectiveness of monetary policy. Heinemann (2000) showed as globalization affects also government budget policies.
The literature on the relationship of globalization and growth is wide. Due the complexity of the phenomenon, the choice of the variable used as a proxy of globalization becomes important. On the one hand, scholars have been using proxies like imports and exports, foreign assets and liabilities, restrictions on payments for capital transactions, taxes on international trade, portfolio investment and so on. Each of these proxies is an attempt to measure a specific sub-dimension of the globalization process. On the other hand, complex measures of globalization have been created, using a large number of sub-indices, with the aim to describe the complexity of the phenomenon.
Foremost, this kind of literature moves from an extensive literature about economic growth and its determinants. Differences about growth rates across countries are huge and, consequently, also the living standards of inhabitants from different countries. The neo-classical growth model supports the idea of an absolute convergence in the growth rates. Countries with access to the same technology, with the same population growth rate and savings propensity, and only differing in terms of their initial capital-labor ratio, should converge to the same steady-state. This means that poor countries will grow relatively faster than rich ones since the first ones are more distant from the common steady-state. The conditional convergence hypothesis points out that countries having the same technology and population growth rates but differing in savings propensities and initial capital-labor ratio, should converge to the same growth rate, but not necessarily to the same capital-labor ratio. In other words, it is not claimed that economies farther than a common steady-state grow faster, but that an economy grows as fast as it is farther away from its stationary state (Barro, 2003). The model used in this paper starts from a growth model à la Barro (2003), where the negative association between growth and the initial level of per capita GDP supports the conditional convergence hypothesis. In the original model, Barro considers a set of regressors (life expectancy, educational level, trade openness and others) representing the features of the countries that clarify the conditional nature of the relationship.
I group the literature according to the specific sub-dimension of globalization analyzed. Firstly, I discuss the literature about financial integration and capital account
38
openness. Secondly, I focus on trade openness and import-export flows with foreign countries. Afterwards, I discuss the literature about economic globalization as a whole.
Finally, considering the importance of the stage of economic development in the
relationship between globalization and growth, I present papers focused on the trade-off between benefits and costs deriving from the globalization process, some of which are specific of the developing countries.
Many studies focus on financial integration and its effect in terms of economic development. They usually measure globalization using foreign assets and liabilities. The path of financial integration of a single country depends on its financial system, economic development, and trade openness. When a financial system is developed, that is when its financial market is open to the other markets, it attracts foreign assets and liabilities. However, financial integration involves risks. Emerging countries can have problems in managing the capital inflows and the shifts of international capital flows. For this reason, many policymakers from developing countries have questioned the choice of entering into a financial integrated system, casting doubts on the fact that the benefits deriving from the higher long-term growth can overcome the costs deriving from larger financial instability (Lane and Milesi-Ferretti, 2008).
After the last financial crises of 2007, cross-border financial flows start to decrease in relation to the overall GDP. This is the results of two factors. Firstly, it is diminishing the flow of capitals from and to developed countries, which reflects the decrease of banks cross-border capital flows. Secondly, developing countries have increased their weight in the overall GDP since they have lower foreign assets and liabilities comparing to the developed ones (Lane and Milesi-Ferretti, 2017)
Analyzing financial globalization some economists focused on the capital account and capital market liberalization and its relationship with the economic performances of the countries. Entering in a globalized system produces risks linked to the rising in liquidity to which borrowers have access that tends to increase the negative effects of any shift of the international markets. The costs deriving from low stability and high volatility are shown in the years or economic crises and tend to overcome benefits. The empirical evidence does not suggest the existence of a causal relation between the removal of existing capital control and the rate of growth (Rodrik, 1998). Opening of capital flows without the right initial conditions may lead to potential risks (Kose et al., 2011). Edison
39
et al. (2002) do not support the idea that financial integration can contribute to speed up the growth process even controlling for particular initial characteristics of the countries.
From a macroeconomic point of view, when developing countries liberalize their stock market, the total factor productivity and investments increase and the cost of capital decreases (Henry 2003). Chari and Henry (2002) provide evidence that liberalization does increase the possibility to share the risk globally.
Other scholars focus their attention on trade openness, a sub-dimension of globalization. Trade promotes growth: scale economies, comparative advantages and technology transfer are benefits associated to trade openness. Growth rates post liberalization are larger than the previous ones; trade openness policies have a positive effect on economic growth (Wacziarg and Welch, 2008). There is also a controversial argument about the presence of restrictions on trade. Part of the literature suggests that trade barriers may promote growth especially in emerging countries (Yanikkaya, 2002). The level of growth and the benefits of openness depend also on features of the single country like the level of economic development, the trade specialization, and the time-period. The evidence suggests that these benefits are different in countries at a different development stage. Over the 1980s the effect of trade openness starts to be smaller than the previous decades and the most evident benefits are observed in developed countries (Dowrick and Golley, 2004).
Due to the complexity of the globalization phenomenon, scholars have started to create indices summarizing distinct aspects of integration. Gwartney and Lawson (2003) have constructed an index of economic freedom that includes different concepts like human interaction, political freedom, capital and trade openness, and civil liberties. This index offers a good measure to compare the economic freedom and to highlight differences across countries. Using a PCA, they create an aggregate index representing all the sub-dimensions of the economic freedom.
Dreher (2006) considers globalization as a complex phenomenon to be measured using many indices. He acknowledges that limiting the attention on a specific sub-dimension can lead to biased estimations and to detect a relationship with growth that can be just apparent since important aspects of globalization are omitted from the regression model. He starts from three sub-indices. An economic globalization index constructed starting from flows of goods, capital and services, restrictions on trade and tariffs. A social