Chapter 6: Material Parameters Analysis
6.1. Introduction
The first step of this study was the definition of the joints in terms of direction of the materials and position in respect to the welding line, as explained in the chapter 4.
The decisions about the problems exposed have been taken including only the specimens obtained with the conventional FSW process. This judgment was taken considering that FSW is the process, in comparison to SSFSW, that is affecting more the materials microstructure, reaching highest peak temperatures.
In order to proof which was the best combination of parameters, the joints have been investigated from a metallurgical and mechanical point of view and a final decision for the proceeding of the work has been taken.
6.2. Macrograph Investigation
6.2.1. Position of the materials
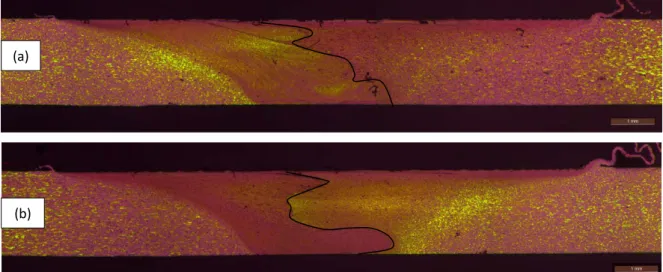
In all the images of the samples (figure 6.1-6.5) the AS is on the left and the RS on the other side. The images are identified indicating the technology of welding, the welding speed, the material that is positioned in the AS and the direction of the material, where R stays for rolling direction and P for perpendicular to the rolling direction.
(a)
(b)
Figure 6-1: Cross section of: (a) FSW-WS=3-AA7050 -R; (b) FSW-WS=3-AA2024-R.
It is possible to notice that in the AS the border between the SZ and the TMAZ is more defined for both the configurations. This difference is due to the asymmetry of the process in which the heat transferred to the AS is always higher than the one in the RS. In the case of AA 2024-T3 in the RS it is almost impossible to distinguish this to zones at this level of magnification. This implies a more homogenous transition from the SZ to the TMAZ, but more important that the dynamic recrystallization that generate a grain size reduction in the SZ is less marked [1]. This problem can be explained by the highest strength of the AA 7050-T7651, positioned in the AS, during the weld that increase the friction on the probe reducing the flow of the material and the effect of the shear forces on the RS at the end of the probe rotation.
Another aspect to be considered is related to the sticking phenomenon that with increasing strength causes a higher amount of material to be transported by the probe rotation causing an increase in the SZ, but more important under a mechanical point of view an increase of the HAZ, that is the weakest zone of the weld. The conclusion is that the more homogeneity in the RS does not bring a reduction of the HAZ in the weld, causing no advantages from a mechanical point of view.
Another noticeable feature that can be observed from the images is the difference of the mixture of the material in the SZ. The “onion rings”, the concentric rings in the SZ that are marked in the figure, are almost symmetric in respect to a longitudinal axis in the case of AA 2024-T3 in the AS and asymmetric in the other case. Symmetry of the material mixture is a factor of merit implying better distribution of the heat through the thickness that brings a more homogeneous structure of the weld.
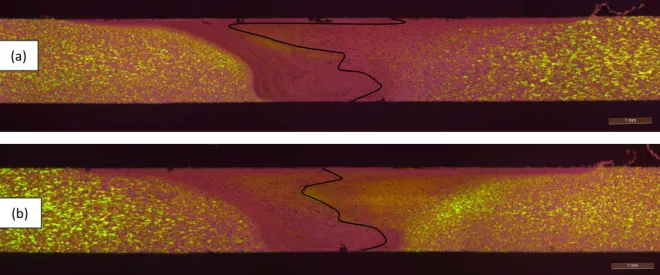
Similar observations also apply in the case of an increased welding speed for the macrographs shown in the figure above. In this case the increase of the HAZ for the AA 2024-T3 is even more marked than before when we compare the different material position. It is important to notice that increasing the welding speed the material homogeneity for the case of AA 7050-T7651 is improved following the idea that increasing the WS, consequently decreasing the HI, there is a more homogeneity of the heat distribution through the sample thickness.
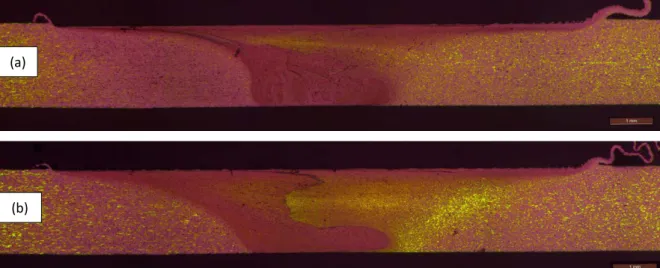
With an additional increase of the welding speed is possible to notice a decrease of the HAZ in both the cases reported in the figure 6-3. The HAZ in the AA 2024-T3 is still wider when this material is positioned in the RS.
(a)
(b)
Figure 6-2: Cross section of: (a) FSW-WS=5-AS=AA7050 -R; (b) FSW-WS=5-AA2024 -R.
(a)
(b)
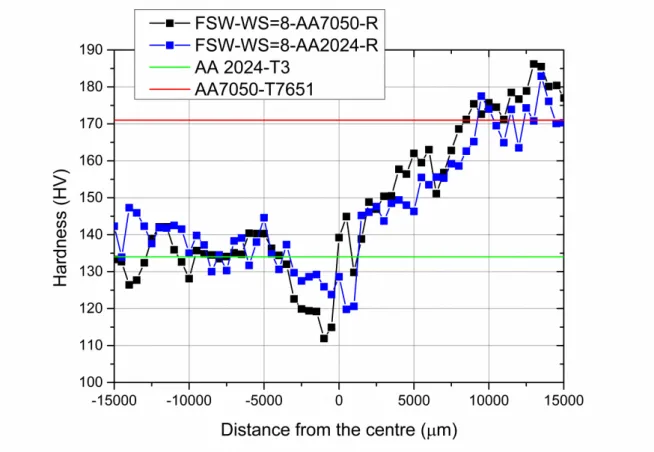
Figure 6-3: Cross section of: (a) FSW-WS=8-AA7050-R; (b) FSW-WS=8-AA2024-R.
The shape of the onion rings is really similar in both cases confirming that increasing the WS the window of parameters, from a material point of view, that can be used for the process is increased and that the process results are less influenced by the postion of the two materials.
6.2.2. Direction of the materials
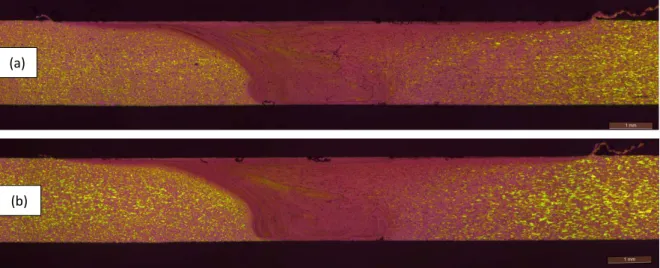
In the figure 6-4 is possible to notice again the difference from the RS where is present a diffuse interface between the SZ is present and the TMAZ and the AS where there is a sharp interface.
In the case of material disposition perpendicular to the rolling direction, the zone affected by the shoulder seems to be more limited and the shape of the SZ is parallel to the probe in the root side of the weld. With the material disposed in rolling direction the slope of the borders between SZ and TMAZ is less steep.
The two HAZs in both the sides of the SZ have comparable dimension with no noticeable difference in the shape.
In the case of AA 7050-T7651 there are no remarkable differences between the two macrograph pictures, figure 6-5, indicating that the rolling or perpendicular to rolling directions are not influencing the welds under a microstructural point of view.
(a)
(b)
Figure 6-4: Cross section of: (a) FSW-WS=3-AA2024-P; (b) FSW-WS=3-AA2024-R.
(a)
(b)
6.3. Bending Test
As remarked in the Chapter 4 the bending test is a qualitative test performed in order to show which welding parameters can be used for further investigation. In this study the minimum angle that the specimen should reach in order to pass the test was considered 80°, considering that the base material AA 7050-T7651 broke with an angle of around 90°.
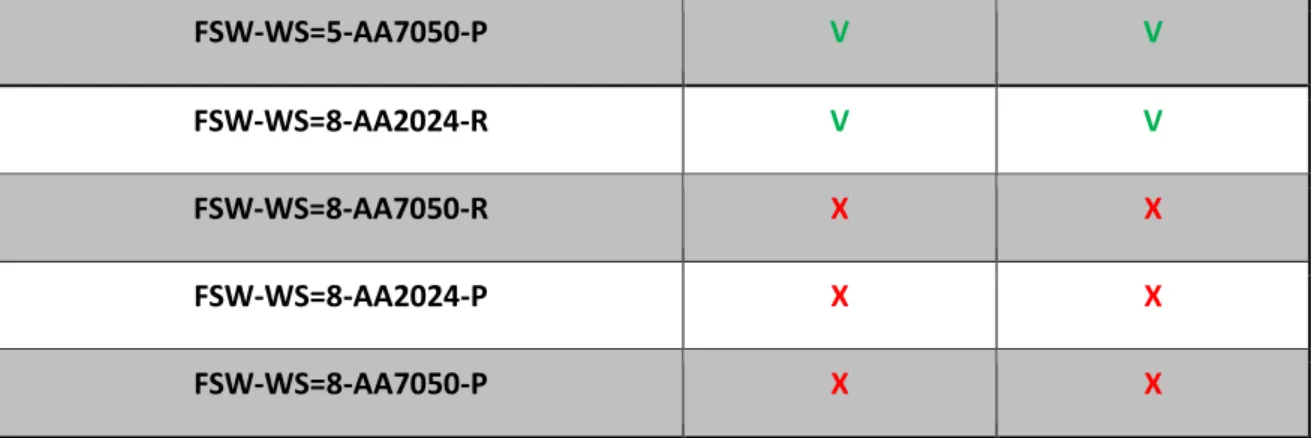
In the table below is possible to see the results obtained, changing the position of the materials, from the conventional FSW process, the welds have been called using the same procedure used in the previous paragraph.
Specimen ID
Bending Test Results Begin of the Weld
(B1) End of the Weld (B2)
FSW-WS=3-AA2024-R V V FSW-WS=3-AA7050-R V X FSW-WS=3-AA2024-P V X FSW-WS=3-AA7050-P X V FSW-WS=5-AA2024-R V V FSW-WS=5-AA7050-R X X FSW-WS=5-AA2024-P V X
Figure 6-5: Cross section of: (a) FSW-WS=5-AA7050-P; (b) FSW-WS=5-AA7050-R.
FSW-WS=5-AA7050-P V V
FSW-WS=8-AA2024-R V V
FSW-WS=8-AA7050-R X X
FSW-WS=8-AA2024-P X X
FSW-WS=8-AA7050-P X X
Table 6-1: Results of the bending test for conventional FSW.
The results of the bending test can be evaluated splitting again the problem between the characterisation of the materials position and the one of the materials direction.
The first observation is that all the specimens, except one, with the AA 7050-T7651 in the AS and in rolling direction have not passed the test. This result is even more valuable considering that the entire set of specimens with the material in rolling direction and AA 2024-T3 have brilliantly overcome this step of 80°.
Considering the direction of the materials the results are more ambiguous. No one of the specimens in direction perpendicular to the rolling direction has passed the when welded with the highest WS. For the other welding speeds the behaviour of the AA 7050-T7651 in the AS seems to be slightly better even if there is a divergence between the specimens extracted from different positions in the weld line.
From the interpretation of the results the most solid condition, as constancy of the properties along the weld line and bending angle, is the one with the AA 2024-T3 disposed in rolling direction and positioned in the AS. The better behaviour of the material in rolling direction can be explained by the more elongated grains that implies a better ductility to the weld.
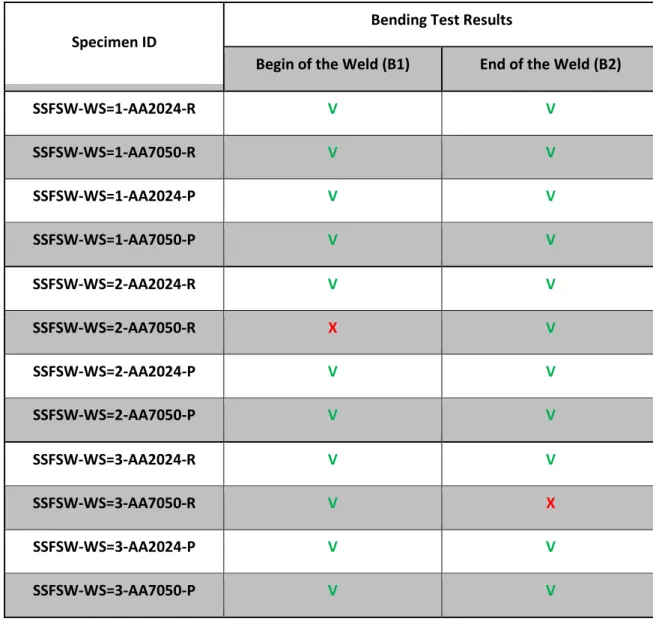
Due to the simplicity and the short time necessary to perform the procedure, also the welds obtained by SSFSW have been tested. This test have been done also to confirm the reduced effect that the SSFSW technology has on the materials structure and justify the decision to compare the material parameters just for the standard FSW. The results can be seen in the table below.
Specimen ID
Bending Test Results
Begin of the Weld (B1) End of the Weld (B2)
SSFSW-WS=1-AA2024-R V V SSFSW-WS=1-AA7050-R V V SSFSW-WS=1-AA2024-P V V SSFSW-WS=1-AA7050-P V V SSFSW-WS=2-AA2024-R V V SSFSW-WS=2-AA7050-R X V SSFSW-WS=2-AA2024-P V V SSFSW-WS=2-AA7050-P V V SSFSW-WS=3-AA2024-R V V SSFSW-WS=3-AA7050-R V X SSFSW-WS=3-AA2024-P V V SSFSW-WS=3-AA7050-P V V
Table 6-2: Results of the bending test for SSFSW.
In the case of SSFSW the 92% of the specimens tested has passed the test and there are no complete failures for any of the process parameters. The hypothesis of testing the different materials parameters just for the conventional FSW results in this case fully justified.
6.4. Microhardness evaluation
In the first part of the discussion the materials are both in rolling direction and will be investigated regarding the effects of a changing in the position of the materials between the AS and the RS changing the welding speed. In the following paragraph two examples of the effect of a change in the direction of the materials will be shown, for two different WS and two different positions of the materials.
6.4.1. Position of the materials
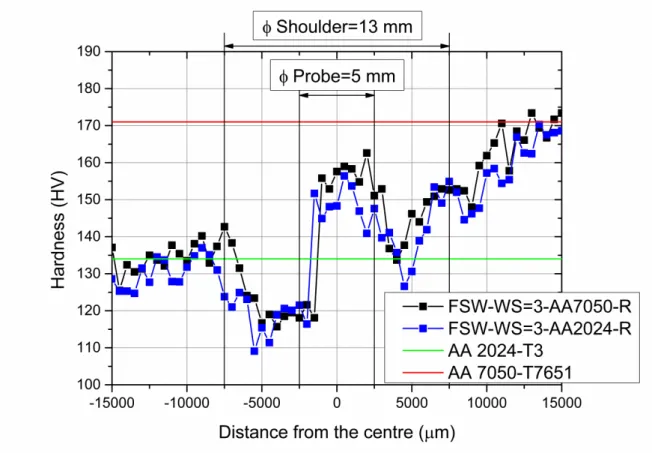
The figure below shows the hardness profile for a WS=3 mm/s. The black line and the blue line represent respectively the case of AA 7050-T7651 and AA 2024-T3 in the AS of the weld. On this figure are also represented the diameter of the shoulder and of the probe in order to correlate the variation of the hardness profile with the tool used for the process.
Figure 6-6: Microhardness test results for WS=3 mm/s and different positioning of the materials.
In both of the cases represented is possible to see an increase of hardness in the proximity of the probe, where the SZ of the weld is located. This increment is due to the combined actions of the shear forces applied by the probe on the material and the dynamic recrystallization that cause a grain refinement in the SZ.
In the space included between the probe and the shoulder the hardness drops significantly, especially in the AS. In this part of the graphic is possible to recognise two different zones of the weld, the TMAZ and the HAZ. These areas are characterised by the fact that there are no direct actions of the probe on the material, while the heat generated by the weld reach is still affecting them. In the TMAZ are present the mechanical effects that the shear layers of plasticised material in direct contact with the probe and the shoulder are applying on the surrounding material. On the other hand in the HAZ there is no mechanical action introduced in the material and the modification of the structure is only due to the transmission of heat in the three dimensions. Further information of how the different type of processes and the parameters involved in them influence these zones will be given in the next chapter.
At the lower WS there are small differences in the hardness profile between the two material positions; the only difference that is possible to notice is that both the materials reach their original hardness faster when they are positioned in the AS. This consideration is important considering that the weaker material that is the AA 2024-T3 is the one with higher probability to fail under a static load and the faster comes back to its original properties the best it is for the mechanical performance of the joint.
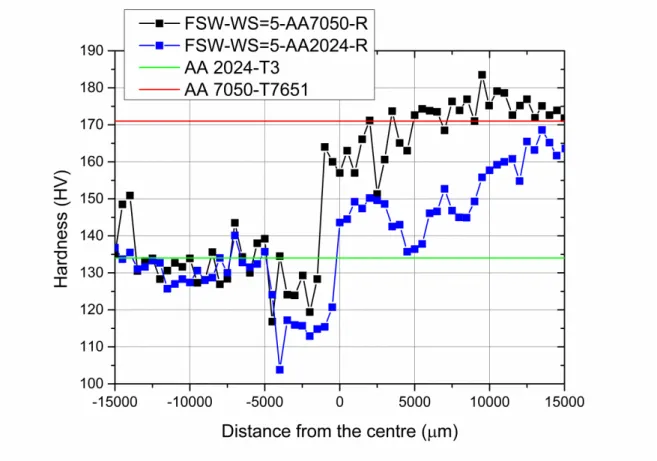
Increasing the WS is possible to notice a divergence between the material positions in the side of the AA 7050-T7651. The behaviour of the material is again as before, better when it is positioned in the AS in respect to the RS.
In any case in the weaker part of the weld, on the border between the SZ and the HAZ from the side of the AA 2024-T3 is not possible to notice a significant dissimilarity. The difference in the two cases between the minimum values reached by the hardness profiles is around 5 HV that according to the equation 4-2 should lead to a difference of the yield stress of 18 MPa; this will be verified in the next paragraph.
Figure 6-7: Microhardness test results for WS=5 mm/s and different positioning of the materials.
In the picture 6-8 is shown the last case in exam when the WS is increased until 8 mm/s. The general performance for both the cases under the point of view of the hardness profile is improved. Especially in the case of the AA 2024-T3 in the AS, the minimum of the hardness is upon the 120 HV and the variation is limited in a small space close to the probe diameter. The increase of the WS and consequently decrease of the heat input brings to a better distribution of the heat through the thickness with a smaller peak of temperature during the weld, causing a more smooth hardness profile. The SZ caused directly by the probe actions results reduced in size.
Once again both the materials are returning to their original hardness values faster when they are in the AS, even if for the highest WS the difference between the two cases is reduced to the minimum and a sure conclusion cannot be drawn.
Figure 6-8: Microhardness test results for WS=8 mm/s and different positioning of the materials.
6.4.2. Direction of the materials
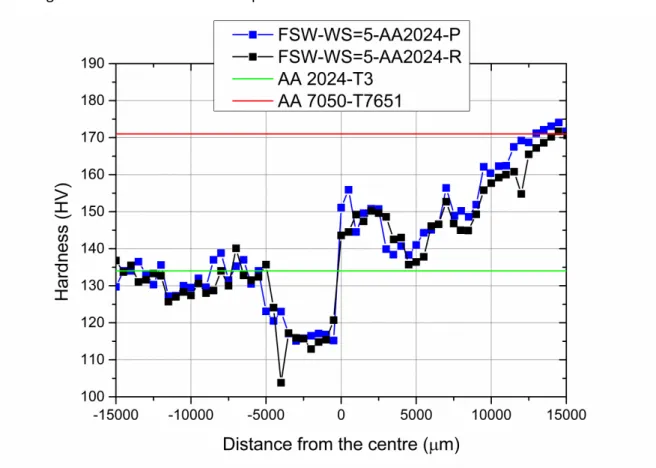
In figure 6-9 the influence of the direction of the materials can be seen in the case of the average WS and for the AA 2024-T3 positioned in the AS of the weld.
No remarkable differences can be seen in the hardness profile changing the direction of the materials. The lowest point in the case of the plates in rolling direction is probably due to the presence of a precipitate of lower hardness in the point of indentation.
Figure 6-9: Microhardness test results for WS=5 mm/s, AA 2024-T3 in AS and different direction of the materials.
The same conclusion can be drawn for the highest WS and with the AA 7050-T7651 in the AS. The only differences are a slightly translation of the part of curve included in the SZ to the AA 7050 side in the case of plates disposed in rolling direction and a slightly higher drop of the hardness in the SZ in the other case.
From this study is possible to conclude that the direction of the materials is not influencing the hardness profile, for different WS and materials disposition, nor in its values nor in its shape.
Figure 6-10: Microhardness test results for WS=8 mm/s, AA 7050-T7651 in AS and different direction of the materials.
6.5. Tensile Test
The analysis of the tensile data has been based on the research of two typical points in the study of the stress-strain behaviour of the materials, the yield stress and the ultimate tensile stress. The evolution of these points changing the WS for the different materials positions and directions have been discussed and commented.
6.5.1. Position of the materials
The figure below illustrates the variation of the yield stress increasing the WS respectively in case of AA 2024-T3 in the advancing side and in the retreating side.
For both the cases is possible to notice an increase of the yield stress increasing the welding speed. This is coherent with what expressed before for the microhardness test and the macrograph investigation. Increasing the welding speed and consequently decreasing the heat input the HAZ size is decreasing and also the grain size growth is limited by the lower peak of temperature reached during the process. In addition to this, increasing the WS the forging force of the probe is increasing causing shear forces of higher magnitude applied to the material that brings to a more refined grain structure with better mechanical properties.
Figure 6-11: Variation of the YS changing the WS and the materials position.
The values of the yield stress, considering also the scatter, are not showing significant variations changing the position of the material and as said before even the trend is similar. The maximum difference obtain from the test is 5 MPa.
The main problem in the case of the AA 7050-T7651 positioned in the AS is the trend of increasing the scatter of the results when is increased the welding speed. The reason of this behave could be related to a major sensitivity in high WS condition to external factor, as a non-perfect clamping of the plates, or internal factors as variation of the precipitate distribution and residual stresses in the material that bring to a less stable process.
This last observation is confirmed and reinforced from the analysis of the ultimate tensile stress presented in figure 6-12.
Increasing the WS the ultimate tensile stress, in the case of AA 7050-T7651 in the AS of the weld, drops drastically and the scatter of the results is rising to unacceptable level. This fact is the confirmation of the presence of defects along the welds. Another reason for this problem could be in the fact that the AA 7050-T7651 has a higher strength in respect to the other aluminium alloy and decreasing the temperature of the process the material cannot be
Figure 6-12: Variation of the UTS changing the WS and the materials position.
plasticised in a sufficient way to permit the complete mixing of the material. In other words the probe cannot apply a force sufficient to the perfect realisation of the weld.
In the other case of analysis the ultimate tensile stress behaviour confirms what observed in the previous graphic regarding the yield stress, with a trend of increasing in value when the WS is rising. In addition to this the scatter for all the WS is remaining under the 3% of the absolute value measured, confirming a stable behaviour of the weld along all the line. This characteristic is important since one of the drawbacks of the welded joints is related to the difficult certification of the constancy of the material properties for all the length produced.
6.5.2. Direction of the materials
The analysis on the yield stress at different WS shown in the graphic below was realised changing the only direction of the materials in the case of AA 2024-T3 positioned in the advancing side of the weld and both the material parameters, position and direction, for the AA 7050-T7651 in the AS. The same procedure has been followed in the study of the ultimate tensile stress.
Figure 6-13: Variation of the YS changing the WS, the materials position and direction.
The yield stress obtained in the case of plates disposed perpendicularly to the rolling direction is higher for all the WS than the one in rolling direction. The main difference is that while in the case of plates in rolling direction is possible to notice an improvement of the yield stress increasing the WS in the other two cases there is a variability that does not allow making any consideration about possible evolutions of the process.
The difference of the yield stress of the welds changing the direction of the materials is significant especially comparing the value of the red point and the black point in correspondence of the WS=8 mm/s. This difference is not easy to explain with the results obtained so far, especially considering that the graphic of the hardness for the same material and process condition are similar one to each other. The explanation could be related to dimension of the grains in the HAZ with a more gradually passage from the refined grained of the SZ and the elongated grains of the base material, with a bigger grain size and an increase of the stiffness and the yield stress due to minor grains surface.
As was observed in the previous paragraph in the case of AA 7050-T7651 in the AS the scatter of the results from different specimen is higher than for the other materials disposition, confirming all the doubts raised until now about the opportunity of this configuration.
Figure 6-14: Variation of the UTS changing the WS, the materials position and direction. 76
For the ultimate tensile test, figure 6-14, the behaviour of the weld with the AA 7050-T7651 is similar to the one shown before. The mechanical properties of the joint are decreasing when the WS rise up and the stability of these along the weld line is poor.
In the case of AA 2024-T3 in the AS similar results are obtained at the average and high WS for both the materials directions. At low WS the result in the case of direction of the materials perpendicular to the rolling direction is unacceptable considering also the high scatter of the values connected to it. This outcome denotes the possible presence of defects or a coarsening of precipitates due to the high temperature.
6.6. Conclusions
In this chapter the influence of the materials direction and position on the microstructure and mechanical performances of the welds has been analysed.
There is a relevant advantage in positioning the AA 2024-T3 in the AS of the weld certified by all the tests performed, especially considering the results obtained from the bending test and the tensile test. In this last even if it is shown a decrease of the yield stress, the improvement in the ultimate tensile stress is remarkable and shows the most evident support to this decision. Another important point for the final decision is the higher stability of the outcomes of the tensile test, obtained for the AA 2024-T3 in the AS of the weld, in different position of the weld certified by the lower scatter of the results for all the WS considered.
The materials direction is a more complicated matter and the results are contradictory. Positioning the plates in rolling direction the best results in the bending test have been obtained, since all the specimens have passed the test. The tensile test shows better behaviour regarding the yield stress in the case of materials disposition perpendicular to the rolling direction, while a small difference between the two configurations is present considering the ultimate tensile stress. At the lower WS the weld realised with the plates in rolling direction has higher ultimate stress and a contained scatter of the values measured. Under a microstructural point of view the difference is minimal and cannot be fully understand with the magnitude of analysis of the macrograph pictures used. The hardness profiles for the two cases are almost identical and are not indicating any direction for the final decision.
Considering all the observations realised the final decision is to continue this study with the materials orientated in rolling direction since this is the parameter that gives more solid results for all the WS considered and shows a positive trend for future improvements of the process.
BIBLIOGRAPHY
1. Su, J.Q., et al., Microstructural investigation of friction stir welded 7050-T651 aluminium. Acta Materialia, 2003. 51(3): p. 713-729.