2016
Publication Year
2020-06-17T08:41:05Z
Acceptance in OA@INAF
Aswan site on comet 67P/Churyumov-Gerasimenko: Morphology, boulder
evolution, and spectrophotometry
Title
PAJOLA, MAURIZIO; Oklay, Nilda; La Forgia, Fiorangela; GIACOMINI, LORENZA;
MASSIRONI, MATTEO; et al.
Authors
10.1051/0004-6361/201527865
DOI
http://hdl.handle.net/20.500.12386/26095
Handle
ASTRONOMY & ASTROPHYSICS
Journal
592
Number
DOI:10.1051/0004-6361/201527865 c ESO 2016
Astronomy
&
Astrophysics
Aswan site on comet 67P/Churyumov-Gerasimenko: Morphology,
boulder evolution, and spectrophotometry
Maurizio Pajola
1, 2, Nilda Oklay
3, Fiorangela La Forgia
4, Lorenza Giacomini
5, Matteo Massironi
5, Ivano Bertini
1,
M.R. El-Maarry
6, Francesco Marzari
4, Frank Preusker
7, Frank Scholten
7, Sebastian Höfner
3, Jui-Chi Lee
8,
Jean-Baptiste Vincent
3, Olivier Groussin
9, Giampiero Naletto
1, 10, 11, Monica Lazzarin
4, Cesare Barbieri
1, 4,
Holger Sierks
3, Philippe Lamy
9, Rafael Rodrigo
12, 13, Detlef Koschny
14, Hans Rickman
15, 16, Horst U. Keller
17,
Jessica Agarwal
3, Michael F. A’Hearn
18, Maria A. Barucci
19, 20, Jean-Loup Bertaux
21, Gabriele Cremonese
22,
Vania Da Deppo
11, Björn Davidsson
23, Mariolino De Cecco
24, Stefano Debei
25, Francesca Ferri
1, Sonia Fornasier
19, 20,
Marco Fulle
26, Carsten Güttler
3, Pedro J. Gutierrez
27, Stubbe F. Hviid
7, Wing-Huen Ip
8, Laurent Jorda
9,
Jörg Knollenberg
7, J.-Rainer Kramm
3, Michael Küppers
28, Ekkehard Kürt
7, Luisa M. Lara
27, Zhong-Yi Lin
8,
Jose J. Lopez Moreno
27, Sara Magrin
4, Harald Michalik
29, Stefano Mottola
7, Nicholas Thomas
6, and Cecilia Tubiana
3(Affiliations can be found after the references) Received 1 December 2015/ Accepted 4 June 2016
ABSTRACT
Aims.We provide a detailed morphological analysis of the Aswan site on comet 67P/Churyumov-Gerasimenko (67P). We derive the size-frequency
distribution of boulders ≥2 m and correlate this distribution with the gravitational slopes for the first time on a comet. We perform the spectral analysis of this region to understand if possible surface variegation is related to the different surface textures observable on the different units.
Methods.We used two OSIRIS Narrow Angle Camera (NAC) image data sets acquired on September 19 and 22, 2014, with a scale of 0.5 m/px.
Gravitational slopes derived from the 3D shape model of 67P were used to identify and interpret the different units of the site. By means of the high-resolution NAC data sets, boulders ≥2.0 m can be unambiguously identified and extracted using the software ArcGIS. Coregistered and photometrically corrected color cubes were used to perform the spectral analyses, and we retrieved the spectral properties of the Aswan units.
Results.The high-resolution morphological map of the Aswan site (0.68 km2) shows that this site is characterized by four different units: fine-particle deposits located on layered terrains, gravitational accumulation deposits, taluses, and the outcropping layered terrain. Multiple lineaments are identified on the Aswan cliff, such as fractures, exposed layered outcrops, niches, and terraces. Close to the terrace margin, several arched features observed in plan view suggest that the margin progressively retreats as a result of erosion. The size-frequency of boulders ≥2 m in the entire study area has a power-law index of −3.9+0.2/−0.3 (1499 boulders ≥2 m/km2), suggesting that the Aswan site is mainly dominated by gravitational events triggered by sublimation and/or thermal insolation weathering causing regressive erosion. The boulder size-frequency distribution versus gravitational slopes indicates that when higher gravitational slope terrains are considered, only boulders ≤10 m are identified, as well as steeper power-slope indices. In addition, no boulders ≥2 m are observed on slopes ≥50◦
. This may indicate that larger blocks detached from a sublimating cliff cannot rest at these slopes and consequently fall down. The spectral analysis performed on the site shows that despite different morphologic units, no spectral differences appear in the multiple textures. This may confirm a redistribution of particles across the nucleus as a consequence of airfall, whether coming from Hapi or from the southern hemisphere when it is active during perihelion.
Key words. comets: general – comets: individual: 67P/Churyumov-Gerasimenko – methods: data analysis
1. Introduction
On August 6, 2014, the European Rosetta spacecraft started or-biting the Jupiter-family comet 67P/Churyumov-Gerasimenko (hereafter 67P). Afterwards, the OSIRIS instrument (Optical, Spectroscopic and Infrared Remote Imaging System, Keller et al. 2007) on board Rosetta acquired the most detailed high-resolution images of the comet, allowing an unprece-dented characterization of its surface and activity. A brief de-scription of the OSIRIS early analysis of the nucleus struc-ture, morphology, and jet activity of 67P is available in
Sierks et al. (2015) and in Thomas et al. (2015b). Despite its small dimensions, ∼4 km size, 67P shows a morpho-logical diversity that still strikes the cometary community: an onion-like stratification1 (Massironi et al. 2015), active pits (Vincent et al. 2015), boulders (Pajola et al. 2015),
1 Comet 67P is an accreted body of two distinct objects, both en-veloped by a nearly continuous set of strata, as indicated inMassironi et al.(2015).
high-reflectivity particle clusters (Pommerol et al. 2015), local fracturing (El-Maarry et al. 2015a), and dust-covered terrains (Thomas et al. 2015a) are only few examples that can be found on 67P.
Since the arrival of Rosetta, the so-called pre-landing phase started, which launched an extremely detailed analysis of the sur-face of 67P that lasted 2.5 months and was performed to select the final best landing site candidate for the lander Philae. In this context, the Visible and Infrared Thermal Imaging Spectrometer, VIRTIS (Capaccioni et al. 2015), and the Microwave Instrument for the Rosetta Orbiter, MIRO (Gulkis et al. 2015) data were used to constrain the mineralogical composition as well as the thermal properties of the nucleus to identify interesting land-ing areas. Simultaneously, the OSIRIS images were used to pro-duce the comet shape model (Preusker et al. 2015), which was fundamental to evaluate the slope constraints of the candidate landing sites, to identify and measure boulders, and to produce hazard maps of the landing spots (Pajola et al. 2015). A rapid evaluation process like this to select the final landing site on a
A&A 592, A69 (2016)
planet2or a minor body of the solar system had never been at-tempted before3.
On August 24, only 18 days after reaching 67P and 80 days before landing, five potential landing areas were chosen out of a total of ten candidates that all appeared scientifically valid, reachable within an acceptable descent time, and with good or acceptable illumination conditions with a topography looking relatively flat. Two candidate landing sites, called A and C, were identified on the main lobe of the comet, while three were se-lected on the small lobe, called B, I, and J. Immediately since the beginning of September 2014, OSIRIS highest-ever resolution images were obtained with a scale of 17 cm/px, which enabled us to prepare detailed morphological maps of 67P as a whole (Giacomini et al. 2016) and specifically, maps of the Philae can-didate sites. A detailed description of the complex landing site selection process is present inUlamec et al.(2015), and it is not the aim of this paper to add detail; nonetheless, we underline that on September 14, that is, two months before landing, sites J on the head and site C on the body were ranked as the top and the backup landing site, respectively. On October 12, the lander project confirmed the J site as the finalist for Philae. Eventually, after seven hours of flight toward 67P, Philae made its historic touchdown on Agilkia (formerly known as J site,La Forgia et al. 2015) on November 12 (Bibring et al. 2015), bumping on the surface and finally coming to rest on a different side of the small lobe of the comet, called Abydos (Lucchetti et al. 2016).
The huge task accomplished by the OSIRIS team during the landing site selection for Philae has led to a multitude of scien-tific data and studies regarding unique areas of the comet. These studies did not stop the day Philae landed and have since been expanded and deepened. An example is the study byLa Forgia et al.(2015) that covers both Agilkia (site J) and Hatmehit (for-merly known as site B).
Although site A, called Aswan4, was excluded because it did not entirely meet all engineering constraints5, this area was considered one of the most scientifically interesting locations of
2 On Mars the typical landing site selection process lasts between 4 and 6 yr (e.g.,Golombek et al. 2012).
3 The selection of the landing site was a race against time in a tight window of opportunity. On one hand, since the comet activity is driven by the heat increase while approaching the Sun, Philae had to be de-livered before this activity reached jeopardizing levels for a safe land-ing. On the other hand, the landing could not occur too early because there had to be sufficient sunlight for the lander’s solar panels to gen-erate enough power to work during the weeks after landing. In addi-tion, the rising surface temperature had to be suitable for the lander to operate without being harmful to Philae’s survival. These combined factors forced the landing to take place when 67P and Rosetta were ∼3 Astronomical Units (450 × 106 km) from the Sun, i.e., in mid-November 2014.
4 We suggest to call this site Aswan because the most famous of the monuments affected by the Aswan dam edification was the temple com-plex on the Philae island, sacred to the goddess Isis. Threatened by fi-nal submersion under ∼50 m of water, Philae temple was dismantled, carved up, and moved to the island of Agilkia near the former Aswan dam, where it was reassembled. The Aswan dam is therefore strictly connected to the move of Philae temple, in a similar way as the engi-neering constraints of the Aswan site on 67P forced a landing of Philae away from the large lobe. In addition, the International Astronomical Union, IAU, does not recognize the surface of a comet as a permanent surface, therefore, as confirmed by the OSIRIS PI, Holger Sierks, we may freely choose names for specific areas on the comet when they have been agreed on the team level.
5 After detailed evaluations presented inUlamec et al.(2015), site A was considered very challenging to reach and to have high illumination variability during the landing.
Fig. 1.OSIRIS NAC images taken on 6 August 2014 and showing the location of the Aswan site on the larger lobe of 67P. The first image of this set, A, was taken at 00.20.10 UT at a distance of 121.4 km and a scale of 2.3 m/px. Image B was taken at 02.20.12 UT, at a distance of 117.2 km and has a scale of 2.2 m/px, while the last one, C, was taken at 04.20.10 UT at a distance of 113.4 km and a scale of 2.1 m/px.
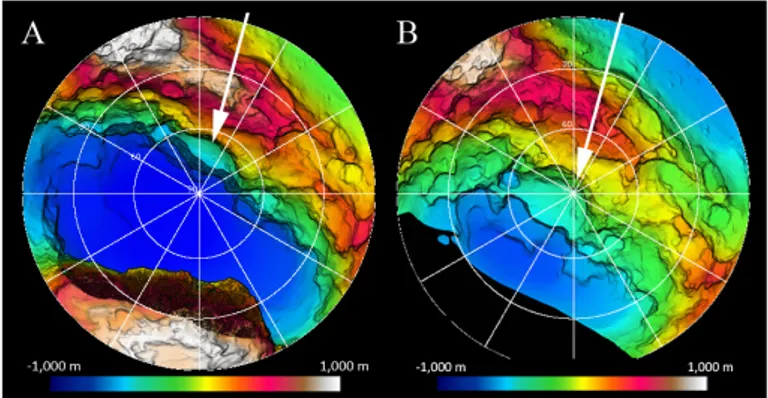
Fig. 2.A) Stereographic projection for the global 67P shape centered on the north pole. B) Stereographic projection for the large lobe of 67P (as identified inPreusker et al. 2015) centered on the corresponding north pole. The color coding shows the height above the 1500 m reference sphere: blue= −1000 m to red/white = 1000 m. The location of the Aswan site in both projections is indicated with white arrows.
67P. It is the only site located in the transition region between the lobes (Fig.1) and near the north pole, see Fig.2. This site represents the largest terrace of the Seth region (El-Maarry et al. 2015b), delimited in the upper part by a steep layered wall show-ing multiple niches, exposed layered outcrops (hereafter called strata heads), and smaller terraces. In addition, it has the benefit of providing a detailed analysis of the multiple fractures present on its cliff. In close proximity to the Aswan area, there is a 200 m wide and 180 m deep pit that has been shown to be active, that is, multiple jets have been observed to arise from its edges (Vincent et al. 2015). Moreover, since the Rosetta arrival, the main dust jet activity has been identified to originate from the transition region (neck) that is called Hapi, which limits Aswan to its north.
This study provides the widest possible context to one of the best candidate landing sites for Philae. Moreover, it is within the wider effort of characterizing localized areas of 67P in de-tail before perihelion, providing a dede-tailed reference for surface changes observable in the near future.
The structure of this work is as follows: after the mor-phological identification and analysis of the different types of units in Aswan, we focus on the complete coverage of boul-ders ≥2.0 m on the site. The boulder clusters are then correlated with the gravitational slope measurements, showing the change in size frequency when steeper terrains are considered. Finally we present a spectrophotometric analysis of different regions of interest that are located on the layered terrains, taluses, and
Table 1. Two OSIRIS NAC data sets used for the spectrophotometric analysis.
Date UT Distance∗[km] Scale [m/px] Phase angle [◦] Filter no. Filter name Wavelength [nm]
2014-09-19 13.42.48 28.29 0.50 68.82 22 Orange 649.2 2014-09-19 13.43.00 28.29 0.50 68.82 16 Near-UV 360.0 2014-09-19 13.43.16 28.29 0.50 68.82 23 Green 535.7 2014-09-19 13.43.28 28.29 0.50 68.82 24 Blue 480.7 2014-09-19 13.43.40 28.29 0.50 68.82 41 Near-IR 882.1 2014-09-22 15.49.36 28.40 0.50 72.03 22 Orange 649.2 2014-09-22 15.49.48 28.40 0.50 72.03 16 Near-UV 360.0 2014-09-22 15.50.04 28.40 0.50 72.04 23 Green 535.7 2014-09-22 15.50.16 28.40 0.50 72.04 24 Blue 480.7 2014-09-22 15.50.28 28.40 0.50 72.04 41 Near-IR 882.1
Notes. The two reference images for the image registration are indicated in bold. The same two images have been used to prepare and validate the morphological map and the boulder distributions. The first NAC set (September 19) was taken when Rosetta was at 3.33 AU from the Sun, while for the second set (September 22) the distance of the spacecraft to the Sun was 3.31 AU.(∗)Spacecraft distance from the comet center.
fine-particle deposits to understand if there are any spectral dif-ferences between the morphologic units.
2. Data set and methods
Our multidisciplinary analysis of the Aswan site was performed on two OSIRIS Narrow Angle Camera (NAC) data sets taken on September 19 and 22, 2014, respectively. The observation ge-ometries, scales, phase angles, and filters used are presented in Table1. Both data sets were taken at similar distances, resulting in a corresponding scale of 50 cm/px: this results in the unam-biguous identification of surface features as small as 2.0 m. The considered data sets offer two unique views of Aswan site: a lat-eral perspective useful for observing the layered terrain located in the steep cliff characterized by several fractures and strata heads (see Fig.3A1, 2), and a top perspective ideal for analyzing the particle deposits, boulders, and taluses present on the main plain and on the overlying niches (see Fig.3B1, 2).
We made use of the ArcGis 10.1 software to identify and map the morphologic units and the linear features. Moreover, the identification of unit boundaries was supported by the deep ex-ploitation of the 3D shape model of the comet. For this purpose, a specific digital terrain model (DTM) with a lateral spacing of 2 m, a true lateral resolution ∼5−10 m, and a vertical accuracy ∼0.1−0.3 m was produced for the Aswan site (see Fig.4). The entire NAC data set provided several stereo coverages of 67P surface, which were used to derive accurate models of the com-plex shape of the comet at increasing resolutions and with di ffer-ent techniques such as stereo-photoclinometry (SPC;Jorda et al. 2012) and stereo-photogrammetry (SPG;Preusker et al. 2015). Our DTM was derived as a subset from the global SPG SHAP4S model, and it was used to compute the 3D surface of the entire Aswan area.
The identification of the boulders on the different types of terrains was also performed with ArcGis. The choice of setting the lowest measurable boulder size at 2.0 m is derived from the fact that below this value, the distribution starts to roll over, in-dicating that the size-frequency distribution might not be com-plete (as indicated in Michikami et al. 2008). In addition, the 2 m limit value provides meaningful size-frequency statistics be-cause it is one pixel larger than the three-pixel sampling (Nyquist 1928) and therefore minimizes the likelihood of misidentifica-tions. Nonetheless, since the observations were performed with a phase angle of ∼70◦, the elongated shadows on the surface provided the possibility of identifying even smaller boulders
(two to three pixels in diameter, ∼1.0 m−1.5 m). We decided to exclude these smaller boulders in the cumulative size-frequency distribution because they do not represent a complete data set for sizes this small (Michikami et al. 2008;Mazrouei et al. 2014;
Pajola et al. 2016). LikePajola et al.(2015,2016), we considered a “boulder”6to be a positive relief detectable in various images obtained with different observation geometries, with a constant elongated shadow (if the phase angle is greater than 0◦). In ad-dition, the boulder needs to appear detached from the ground on which it stands.
After these features were manually identified in the high-resolution images, we measured their positions on the surface of the comet, assumed their shapes to be circumcircles, and de-rived their diameters and the corresponding areas. Consequently, to obtain the cumulative boulder size-frequency distribution per km2for the global analysis, we used the corresponding area com-puted from the 3D shape model of 67P (Preusker et al. 2015). In all log-log plots we finally fit a regression line to the data to ob-tain the power-law index of each size distribution, while the error bars for each value indicate the root of the cumulative number of counting boulders followingMichikami et al.(2008).
To describe the gravitational framework of the Aswan site for the morphological and boulder interpretation, we computed the gravitational slope of the terrain pixel by pixel for both image sets. The SPC model, downsized to 1.5 × 10⁵facets, was used to derive the gravitational potential of this highly irregular comet, assuming a homogeneous nucleus with a density of 470 kg/m3 (Sierks et al. 2015) following the theory ofWerner & Scheeres
(1997) and accounting for the centrifugal force that is due to the comet rotation (Rossi & Fulchignoni 1999). The derived gravita-tional slope was then defined as the angle between the local sur-face normal pointing inside the nucleus and the gravity vector.
To perform the spectral analysis on the Aswan site, the images given in Table 1, which are in spectral radiance units (Wm−2nm−1ssr−1, at the central wavelengths of each filter), were converted into the radiance factor (I/F) by using
I/F=πr 2I
m F
,
where Imis the measured spectral radiance from the comet sur-face, F /π is the solar spectral irradiance at 1 AU measured at
6 This terminology is not meant to imply any structural similarity to the boulders normally seen on Earth, but when we identified a feature with these characteristics, we inferred that it was a boulder.
A&A 592, A69 (2016)
Fig. 3.A1) WAC simulated view of image A2), with the NAC field of view outlined with the red square. A2) NAC image taken on September 19, 2014, showing a side view of the Aswan site. B1) WAC simulated view of image B2) with the NAC field of view outlined with the red square. B2) NAC image taken on September 22, 2014, showing a view from the top of the Aswan site. Three specific features are identified in both images to facilitate understanding the geometry of the observation. The arrow indicates a 5.5 m boulder in close proximity to the 200 m wide pit, the circle shows the boulder (19.3 m wide) closest to the 50 m long fracture presented in Fig.11, while the rectangle indicates the limit of the outcropping layered terrain.
Fig. 4.SPG DTM of the Aswan site with a lateral spacing of 2 m, a true lateral resolution ∼5−10 m, and a vertical accuracy ∼0.1−0.3 m. The three features identified here correspond to those presented in Fig.3.
the central wavelength for each filter, and r is the heliocentric distance of the comet in astronomical units.
The images taken in multiple OSIRIS NAC filters cannot be used directly for spectral analysis because they are taken subsequently and not simultaneously. Before performing the spectrophotomet-ric analysis, we therefore corrected the data in two fundamental ways:
– image coregistration: to eliminate false colors created by misalignment;
– photometric correction: to eliminate the effects of different illumination conditions.
The USGS ISIS37software was used to coalign the images and for the photometric correction of the data given in Table1. The images marked in bold in Table 1 were used as reference for each series during the image registration step. At the observing time of the same reference images, photometric angles of inci-dence, emission, and phase were calculated by using the down-sized version (1 million vs. 16 million facets) of the shape model (Preusker et al. 2015)8. The alignment of the shape at the ob-serving time of the reference images was achieved by using the SPICE kernels9and the SPICE toolkit10for C (Acton Jr. 1996). These angles were consequently used for the photometric cor-rection of the coaligned images using the Lommel-Seeliger disk law, which is included in the ISIS3 software:
D(i, e)= 2 cos(i) cos(i)+ cos(e),
where D is the disk function with geometric angles incidence i, and emergence e. Disk-corrected images were then obtained by dividing the I/F images by the disk function. In the photomet-rically corrected images the regions with angles larger than 80◦ were excluded. The image registration and photometric correc-tion steps described in detail in Oklay et al. (2016) were fi-nally applied to the two color series of the OSIRIS NAC images (Table1), and then the spectral analysis was performed.
3. Morphological analysis
3.1. Morphological map
The Aswan site is located in the Seth region, a physiographic region of the comet’s main body that is characterized by se-ries of terraces of different size that alternate with steep walls of outcropping terrain (El-Maarry et al. 2015b). Locally, ter-race margins show a semicircular shape whose origin is still de-bated. As a first possibility, these features may be formed by material collapse that leads to the observed semicircular niches (Giacomini et al. 2016). Another hypothesis is that they may represent the remnants of a sinkhole collapse, as proposed by
Vincent et al. (2015). More likely, these particular land forms are the result of the interaction between these two processes, acting at different times (i.e., the original collapsed sinkhole subsequently modeled by sublimation with the consequent re-treat of the wallsKeller et al. 2015;Giacomini et al. 2016). The
7 Integrated Software for Imagers and Spectrometers,http://isis.
astrogeology.usgs.gov/index.html
8 The downsized version of the 67P shape model was used for compu-tational reasons.
9 http://www.cosmos.esa.int/web/spice/
spice-for-rosetta
10 http://naif.jpl.nasa.gov/naif/toolkit.html
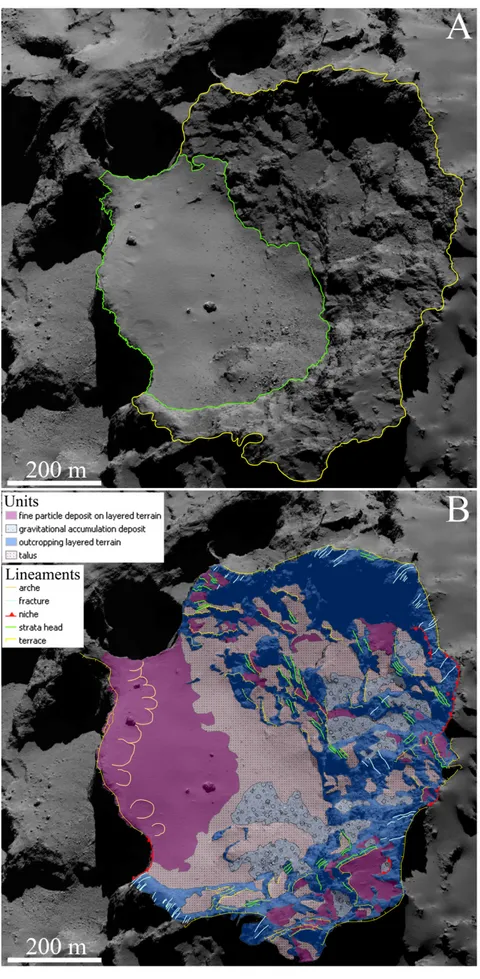
Aswan terrace (Fig.5A) represents the largest terrace observ-able on Seth, with an area, as calculated from the DTM11, of 0.22 km2. The terrace is bounded by a 400 m high wall of con-solidated terrain (the total area of the cliff is equal to 0.46 km2). A morphological map of both the terrace and wall has been pre-pared, following the same classification method as reported by
La Forgia et al.(2015) andGiacomini et al.(2016). The map, Fig.5B, shows the main geomorphological units and the linear features that were classified on the basis of their surface tex-tures and morphologies. On the steep wall, outcrops of layered terrain were detected. These outcrops have a rocky appearance and show several linear features parallel to each other, laterally extending for several tens of meters and associated with small terraces. These features, interpreted as strata, are cross-cut by fractures nearly perpendicular to the bedding planes. The strata support the onion-like stratification of the comet’s nucleus, as suggested byMassironi et al.(2015). The layered nature of the terrain is furthermore supported by numerous smaller terraces (Fig.6) detected in several parts of the main steep wall. They are interpreted to be formed by the differential erosional subli-mation of a layered sequence of strata depleted in volatiles (less erodible), and strata enriched in volatiles (more erodible), as sug-gested inMassironi et al.(2015),La Forgia et al.(2015),Pajola et al. (2015). The small terraces appear to be covered by fine-particle deposits whose size is unresolvable at the highest reso-lution of OSIRIS images. This material covers most part of the cometary surface, and its origin is probably related to activity-induced airfall (Thomas et al. 2015b,a;Keller et al. 2015).
Overlying this fine-particle material, several mass-wasting deposits were observed. On the basis of their different granu-lometry and source, these deposits were classified into taluses and gravitational accumulation deposits (Giacomini et al. 2016). These deposits are ubiquitous on the comet nucleus (Pajola et al. 2015;Giacomini et al. 2016) and are usually located at the base of the highest gravitational slopes (La Forgia et al. 2015;Auger et al. 2015), suggesting a gravity-related origin.
Taluses are generally constituted by fine well-sorted mate-rial, often showing some larger blocks at the distal part of the deposit (Vincent et al. 2016). They are located on some of the small terraces on the cliff and are uniformly distributed all along the foot of the walls. For this reason, they are thought to be the result of the erosion of the material fallen down from the cliffs, like talus deposits on Earth.
Gravitational accumulation deposits are, instead, poorly sorted deposits comprising large boulders of wide size-ranges supported by a matrix of finer material. Their source area is as-sociated with rough semicircular niches that most likely formed by material that fell from the wall. Although we do not have clear proof yet, we suggest that these deposits are formed by sudden events of gravitational collapse that were most likely triggered by erosion and sublimation.
The larger terrace, representing the nominal site A, see Fig. 5A, is an almost flat terrain completely covered by fine particles and mass-wasting deposits. Taluses extend all along the foot of the cliffs. On the other hand, fine-particle deposits dominate the most distal part of the terrace. Close to the ter-race margin, several features showing an arched shape in plan view, have been identified (Fig. 7). These features are thought to be formed by granular fluxes flowing down from the margin of a collapsing cliff. This seems to be supported by the detec-tion of mass-wasting deposits at the foot of the underlying wall.
11 We underline that all areas presented in this work were calculated from the 3D DTM model of the comet.
A&A 592, A69 (2016)
Fig. 5.A) Uninterpreted image of the Aswan site. The green area shows the largest terrace of Aswan, i.e., the Philae nominal proposed site A, while the yellow area indicates the surrounding cliff. B) Morphological map of the Aswan site presenting the identified units and lineaments. This map was derived from the NAC image taken on September 22, 2014, at 15.50.04 UT at a distance of 28.39 km from the comet center. The corresponding scale is 50 cm/px.
Fig. 6.OSIRIS NAC image of the Aswan site taken on September 23, 2014, at 03.06.31 UT, from a distance of 28.55 km from the comet cen-ter. The scale of the image is 0.5 m/px, as for the two data sets used in this work. This observation geometry is very useful to identify the numerous small terraces on the main steep wall, which indicated with white arrows.
In addition, the wall shows fractures and polygonal features, which are signs of thermal stresses and sublimation (Vincent et al. 2016). This evidence suggests that the edge of the cliff progressively retreates through mutual action of fracturing and sublimation (Vincent et al. 2016).
3.2. Boulder analysis
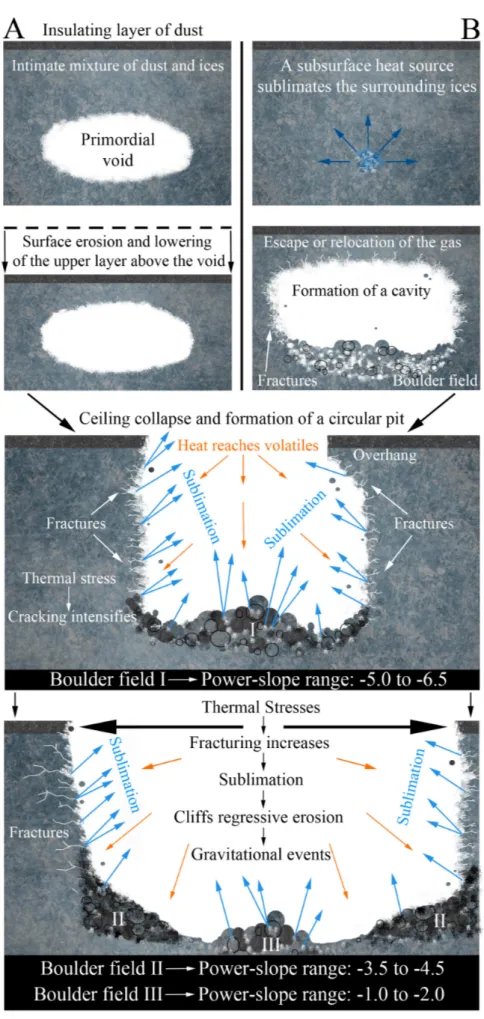
The typical cometary surface, as suggested in Vincent et al.
(2015), is characterized by a top layer of dust that is depleted of volatiles and covers a thick mixture of dust and ices, see Fig.8. The first schematic case Fig.8A, shows a primordial void into the nucleus that results from its formation process (Auger et al. 2015). Through time, the cometary activity erodes the up-per layer above the void and reduces its thickness. In the second case, Fig.8B, a subsurface heat source sublimates the surround-ing ices accordsurround-ing to Vincent et al. (2015). This gas escapes through fractures or relocates, thus forming a cavity and a boul-der field. In both cases, when the ceiling becomes too thin to support its own weight, it collapses, forming a pit with a boulder field at its bottom with fractured walls and possible overhangs (Vincent et al. 2015;Groussin et al. 2015). High power-law val-ues ranging between −5.0 and −6.5 are an indication of high fragmentation, and they have been attributed to the formation of these depressions with subsequent escape of high-pressure volatiles and fracturing. Two 67P examples of this process are present in Figs. 14B and C and in Fig. 16C ofPajola et al.(2015). When the pit is formed, thermal stresses and heat affect the ex-posed interior of the comet, which intensifies the fracturing of the prefractured walls or forms new fractures inside the mix-ture of dust and ices (Höfner et al. 2016). This results in sub-limation both from the walls and from the newly formed boul-ders, which can be made of dust, ices, or a mixture of both. As the fracturing increases, repeated sublimation occurs, the cliff is
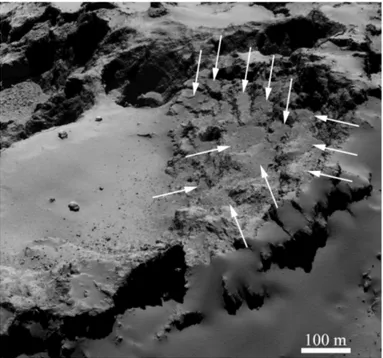
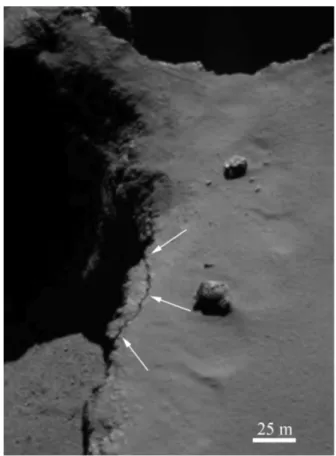
Fig. 7.Close-up of the Aswan escarpment showing multiple arches in plan view. These arched features probably formed through fine material that fell down the terrace margin, as suggested inVincent et al.(2016), testifying that the margin progressively erodes and retreats. The white box in the left panel shows the location that is the subject of Fig.11.
progressively eroded (Keller et al. 2015) and gravitational events occur, with the consequent formation of boulder fields at the foot of the cliffs. Power-law indices ranging between −3.5 and −4.5 are suggested to be indicative of these phenomena. Several ex-amples of these processes are presented in Figs. 16B and 18A of
Pajola et al.(2015) or in Fig. 6 ofVincent et al.(2016). As the pit grows through regressive erosion, the depression is continuously infilled with eroded material from the edges. This continuously replenishes the boulder fields formed at the foot of the walls are with fresher material (boulder fields with power-slope indices ranging from −3.5 to −4.5). In contrast, the remnant boulders formed during the initial ceiling collapse may continue to sub-limate and evolve, but they are progressively depleted because they are not replenished by the distant walls. This process, cou-pled with the degradation of the smaller boulders, is invoked to explain power-law indices below −3.0, and possibly from −1.0 to −2.0. Three main examples of this phenomenon are presented in Figs. 16A and 18B of Pajola et al. (2015) or in Fig. 6 of
Vincent et al.(2016), where talus deposits border the scarp and progressively degrade into smooth deposits without boulders. Eventually, the larger boulders are located at the center of the depressions, farther away from the cliffs. These trends have re-peatedly been observed in different, often opposite areas of the comet, and they were confirmed when higher-resolution boul-der counting was performed, for example, in Pommerol et al.
(2015),Vincent et al.(2016). For this reason, each power-law range is probably representative of a particular formation pro-cess and degradation state.
Nevertheless, as presented by Pajola et al. (2015, 2016), interpreting the cometary power-law results is complicated by the fact that no laboratory experiments have been conducted on comet-like samples so far. This is even more true when high-porosity samples, a low-gravity environment, and extreme tem-perature gradients have to be simultaneously taken into account. A previous valuable example to understand how one fragmenta-tion process can result in a specific cumulative power-law index value is presented inTurcotte(1997), who summarized the main power-law index values derived for different types of terrestrial fragmented objects from millimeter- to meter-sized fragments.
A&A 592, A69 (2016)
Fig. 8.Schematic representation of the different types of boulder field formation, and the corresponding power-slope ranges proposed inPajola et al.(2015) and described in the text.
Fig. 9.A) Spatial distribution of boulders on the Aswan site. B) Global power-law index for Aswan derived from the cumulative size-frequency distribution of boulders per km2. The total area of the Aswan site (its boundary is indicated in yellow) computed from the 3D shape model is 0.68 km2. The continuous line is a fitted regression line to the data, and the power-law index of the size distribution is −3.9+0.2/−0.3. The bin size is 0.5 m.
Despite its clear connection to the bulk density of terrestrial ma-terials, which are not expected to be found on a comet,Turcotte
(1997) provides different examples on how fragmentation of dif-ferent types of deposits, such as sandy clays and gravels, or pro-cesses such as rock disaggregation and impacts, result in power-law indices ranging between −2.0 and −3.0. The only higher power-law index (−3.54, Hartmann 1969) is attributed to frag-ments of ash and pumice. We consider this value as the most significant for our analysis because ash and pumice are probably some of the closest matches to terrestrial material, at least for the density, that we can imagine are constituting the cometary nucleus, and also because ash and pumice are the typical prod-uct of explosive volcanism when fragmentation is related to sub-surface volatile overpressure and release, possibly similar to the processes occurring on the comet.
Using the NAC images data set of September 22, 2014, we identified the boulders present on the different types of terrains of the Aswan site. We counted a total of 1293 boulders, 1019 of which were ≥2 m. The considered area of the Aswan site is delimited in yellow in Fig.9and extends for 0.68 km2. By plot-ting the resulplot-ting size-frequency distribution per km2(Fig.9), we derived a power-law index of −3.9+0.2/−0.3 in a size range of between 2 and 8 m. Below 2 m, the distribution starts to roll over, indicating that the boulder distribution is incomplete. Above 8 m, that is, for the larger boulder sizes, the equally cumulatively re-peated points indicate that there are poor statistics, insufficient to yield meaningful results12. The cumulative density of boul-ders ≥2 m is 1499/km2.
12 In addition, we underline that when evenly spaced horizontal bins are considered for the fit in the logarithmic representation, no significant power-law index changes are present (they are well within the error bars presented here), hence the 0.5 m size bin power-law indices can be considered a valid representation of the statistics.
Based on comparing the −3.9 power-law index with the pre-sented boulder formation processes, we suggest that the global Aswan boulder distribution falls within the boulder type II range (see Fig. 8). In particular, this index suggests that these boul-ders possibly formed through gravitational events that were trig-gered by sublimation and/or thermal fracturing, which caused regressive erosion of the cliffs. The global size-frequency distri-bution in this way supports the interpretation that the Aswan site is mainly dominated by gravitational events like this. Our inter-pretation is also supported by the ubiquitous taluses located all along the foot of the main cliff (Fig.5A) and by the gravitational accumulation deposits in the main terrace of Aswan and on the series of terraces located on the cliff itself. Nonetheless, if we deepen this analysis to smaller, specific areas, different power-law indices become identifiable. When we consider four gravi-tational accumulation deposits, two on the cliff area and two on the plateau below the cliff, we derive that two formation pro-cesses may be invoked to explain the different size-frequency distributions. Areas 1 and 2 of Fig. 10are located on the cliff above the plateau talus deposit. It is very challenging to identify the surface value for areas this small on the DTM, and therefore we were unable to obtain the cumulative number of boulders per km2. Nevertheless, this does not affect the possibility of identi-fying the power-law index for the two selections, which is −5.2 +0.7/−0.5 for the first and −5.0 +0.7/−0.4 for the second. Both deposits are located near highly fractured walls: they show sim-ilar power-law indices that lie within the range of boulders of type I described inPajola et al.(2015), Fig.8. The steepness of these indices can be attributed to collapses or pit formation and creation of depressions with subsequent escape of high-pressure volatiles and consequent high-fracturing.
In contrast, the two gravitational deposit areas 3 and 4 in Fig.10show a lower power-law index than previously, that is, −4.0 +0.4/−0.7 and 4.0 +0.4/−0.6, respectively. These values
A&A 592, A69 (2016)
Fig. 10. Power-law indices derived from the cumulative numbers of boulders in four of the largest gravitational accumulation deposits on the Aswan site.
are equal for both deposits, indicating a similar origin as well as a similar morphological context. The power-law indices fall inside the type II ranges of Fig. 8, hence possibly support the formation through gravitational events triggered by sublimation and/or thermal fracturing that causes regressive erosion of the cliffs.
We underline with this study that the extension toward boul-ders of smaller sizes (2 m) shows results that are in line with those derived for families of boulders ≥7 m, which suggests that at meter and decameter scale, the formation and fragmenting processes acting on the different areas of 67P are similar. 3.3. Fracture identification
Isolated and discontinuous fractures are visible throughout the Aswan site (Fig.5) and are generally tens of meters long: most of them appear to cross-cut the strata. One particular fracture, see Fig.7, appears near the edge of the Aswan escarpment and shows a unique setting in comparison to the other fractures of the area. It propagates almost perpendicularly from the scarp edge
Fig. 11.Fracture of ∼50 m located at the edge of the Aswan escarpment. The location of this close-up image is indicated in Fig.7.
at its two ends and inward in a semi-circular fashion ∼12 m away from the edge at its farthest point (Fig. 11). The frac-ture is roughly 50 m long and 2−3 m wide. Tensional fracfrac-tures of this type have been observed on other escarpments on the surface (El-Maarry et al. 2015a) and probably mark locations of eventual cliff collapse and development of mass-wasting de-posits. Meter-scale fracture patterns on the surface of the comet, including those observed in association with escarpments, are probably created through a thermal insolation mechanism ( El-Maarry et al. 2015a). Therefore, we plan to monitor this location throughout the mission to investigate whether the fracture will evolve with time or will trigger a cliff collapse.
4. Gravitational slope analysis and boulders
As presented before, the SPG model was used to derive the grav-itational potential of this highly irregular comet by taking the centrifugal force due to the comet rotation into account (12.4 h,
Mottola et al. 2014). The two slope13 maps projected with the same observation geometries of September 19, 13.43.28 UT and of September 22 at 15.50.16 UT were produced to this aim, see Fig.12. Since the comet shape is so irregular (Preusker et al. 2015) and the gravitational field on this body strongly varies along the surface (Sierks et al. 2015), the slope maps are essen-tial to understand where the flat areas are and hence where we expect gravitational collapse deposits to settle. The possibility of quantifying the slopes on the comet has great morphological im-plications: when the morphologic units of Fig.5 are compared to the slopes of Fig.12, it is evident that there is a strong cor-respondence between types of terrain and slope, which indicates
13 When not specified, the term slope in this paper always refers to the gravitational slope.
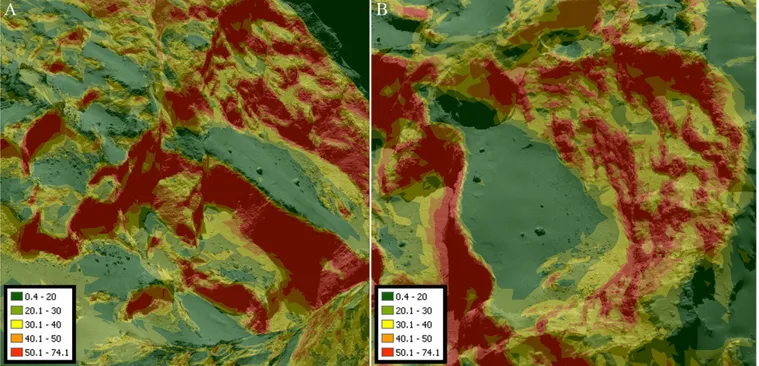
Fig. 12. Gravitational slope maps produced with the observation geometry of September 19, 13.43.28 UT A) and of September 22 at 15.50.16 UT B). The values presented are in degree.
a dominant gravitational control. For example, the fine-particle deposits presented in Fig. 5B are located on areas with slopes always lower than 20◦, while the taluses are typically below a slope of 30◦. By contrast, the outcropping layered terrain that is almost free of fine meter-size deposits is well visible when the slopes are higher than 45−50◦: this implies that a slope like this hardly allows for meter-size deposits to rest and consequently exposes the layered terrain that lies underneath. These consider-ations imply that by taking into account the slope map alone, we can achieve a first indication of where deposits are located on the Aswan site, or where outcrops appear that are almost free of meter-sized boulders.
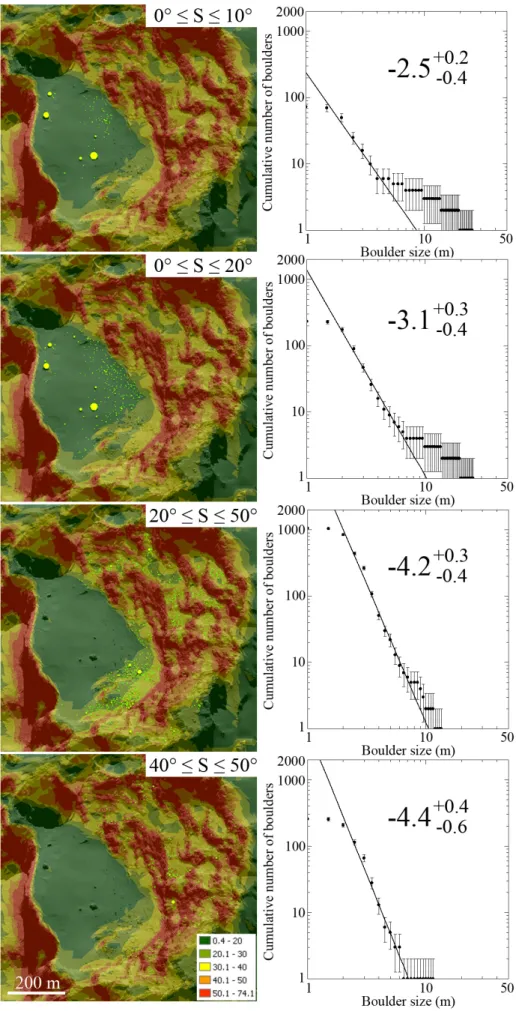
By making use of our boulder statistics presented in the distribution map of Fig. 9 and the gravitation slope maps of Fig.12, we performed a quantitative analysis of the boulder size-frequency power-slope distribution versus slope. To do this, we subdivided our 1293 boulders into four different slope classes: slopes of 0◦−10◦, 0◦−20◦, 20◦−50◦, and 40◦−50◦. The results of this analysis are presented in Fig.13and are described below.
– The first slope range, that is, 0◦ ≤ S14 ≤ 10◦, is character-ized by the largest boulders of the Aswan site. One 25.5 m boulder is present here together with another 19.5 m and a 13.5 m boulder. Most boulders belonging to this slope range are located in the fine-particle deposit unit at the lowest limit of the site and far from the layered cliff, with some boul-ders belonging to the talus unit as well. The power-law in-dex derived from the cumulative number of boulders ≥2 m is −2.5+0.2/−0.4, and it suggest a possible degradation ef-fect on an original boulder population derived from either a roof collapse of a former original pit or from a gravitational deposit derived by the retreating walls of Aswan. The whole area could have undergone areal sublimation and regressive erosion at the bordering cliffs, with the final result of having dismantled and eliminated the smaller boulders in the former central part of the depression.
14 S stands for slope.
– The second slope range, that is, 0◦≤ S ≤ 20◦, extends the pre-vious range farther out from the fine-particle deposit toward the talus limits located close to the surrounding Aswan cliff. The size-frequency power-slope index that we derive here is −3.1+0.3/−0.4, steeper than the previous one. This indicates more smaller-sized boulders (Fig. 13). The difference with the previous power-slope index suggests that after the origi-nal collapse that originated a first population of blocks whose remnants lie in the 0◦−10◦ slope, the area may have been affected by areal sublimation and regressive erosion at the bordering cliffs, with a retreat of the surrounding walls and consequent production of talus debris continuously renewed by blocks and grains. The higher quantity of small boulders located in the talus units supports this interpretation. – The third slope range, that is, 20◦ ≤ S ≤ 50◦, contains the
boulders that are closer to the outcropping layered terrain. These boulders are mainly located in the gravitational accu-mulation deposit unit, but also inside some taluses with the steepest slopes close to 30◦. The power-slope index we de-rive on this boulder population is −4.2+0.3/−0.4, which is higher than the two previous ones. The largest size of the boulders here is 10 m. As inPajola et al.(2015), we suggest that this distribution may be due to gravitational events trig-gered by sublimation and/or thermal fracturing causing the current cliff regressive erosion.
– The fourth and final slope ranges between 40◦and 50◦. The resulting index derived from the cumulative number of boul-ders is −4.4+0.4/−0.6. The boulder distribution of Fig.13
shows that when steeper terrains are considered, only smaller boulders are identifiable. A first possible explanation of this is that the lack of large boulders on the cliff may be the result of any initial loose fragments disintegrating to smaller sizes. Alternatively, it can be suggested that the larger blocks de-tached from a sublimating cliff may not rest at these slopes and consequently roll down, as a result of higher inertia, until they come to a rest far from the cliff. This results in cutting the largest dimension size ∼10 m, it decreases the number
A&A 592, A69 (2016)
Fig. 14.RGB images produced using near-IR (882.1 nm) for the R channel, orange (649.2 nm) for the G channel, and blue (480.7 nm) for the Bchannel.
of the larger-sized boulders, and hence it steepens the size-frequency power-law distribution.
To summarize, our analysis suggests that the higher the slopes, the smaller the dimension of the detected boulders, according to the higher momentum and relatively lower friction that larger blocks have with respect to the small ones. In addition, no boul-ders ≥2 m are observed at slopes ≥50 ± 5◦, which extends the limit for intermediate-slope terrains proposed byGroussin et al.
(2015) at least for the Aswan site.
5. Spectral analysis of the region
After identifying multiple terrains with different types of textures on the Aswan site, we performed the spectral analysis of this region to determine whether there are any spectrophotometric differences between the morphologic units.
Two views of the Aswan site have been prepared in red giant branch (RGB) colors with coding images in near-IR (NIR), orange and blue filters from the multispectral data to the RGB channels, respectively. A first analysis of Fig.14suggests that subtle color variations are discernible on the several units of the study area. The area located on the fine-particle deposit, lim-ited by the terrace and the multiple arches, appears to be brighter than the same deposit that is located closer to the talus. Small RGB variations are discernible on the gravitational accumula-tion deposits as well, located on the largest terrace of the Aswan site, and a few color differences are present on the fine-particle deposits and the gravitational accumulation deposits located on the cliff, specifically when they are compared to the colors of the outcropping layered terrain. We suggest that these color varia-tions may be due to local compositional differences. One expla-nation for this behavior is that the surface of the comet may have been exposed after the dust was deported. Another possibility is that airfall material with a different composition than the sur-roundings was deposited here, leading to the RGB variations we observe.
As presented in Sect. 3, despite the ubiquitous blocks and boulders with different sizes and shapes, Aswan units are clearly distinguishable by their surface texture. The correct identifica-tion of different texture units is pivotal when spectrophotometric studies are performed on planetary and minor bodies since the photometric variation is due to composition variegation and/or texture and grain size (Clark 1999). Therefore, the ability to dis-tinguish between these two effects can lead to an unambiguous identification of surface variegation.
In addition, the morphological map may indicate areas where the geologic history is similar and consequently may help in identifying regions of interest (ROI) that can then be cross-compared. The small differences in color, coupled with the dif-ferences in terrain textures, lead to the identification of 12 ROI in the first data set, while there are 15 ROIs for the second data set. Figure15shows the 27 ROIs that were selected for the spec-trophotometric analysis. Through this selection, all types of mor-phologic units were sampled. Resistant mean spectra (hereafter mean reflectance spectra) excluding data points that deviate by more than ±3σ of the median per investigated ROI were then calculated. The reflectance (I/F) of the ROIs is presented in the top panels of Fig. 16. Spectra of the ROIs selected in the two images are very similar to each other (in various brightnesses) and display a red spectral behavior, meaning that the reflectance increases with wavelength. Similarities among the mean abso-lute reflectance spectra of the ROIs are more evident in the rel-ative reflectance (normalized at 480.7 nm) shown in the bottom panels of Fig.16. There is a clear slope change in the green fil-ter (535.7 nm), but no other spectral features are detected. This might be due to the limited number of filters used during the ob-servations since limited spectral resolution prevents the detection of spectral features, which are the mineralogical signature of the terrain. Despite this technical limitation, the surface material on the fine-particle deposit, taluses, gravitational accumulation de-posits, or on the outcropping layered terrain might also be very similar.
To investigate the subtle variations in ROIs, the spectral ratio technique was applied to the mean spectra of each ROI using
A&A 592, A69 (2016)
Fig. 15.Regions of interest identified in the two data sets of Table1.
Fig. 16.I/F and relative reflectance (normalized at 480.7 nm) derived from the two spectral cubes for the selected ROIs of Fig.15.
the blue/green and orange/NIR ratios, as suggested by Oklay et al. (2016), for the same region. Of the multiple NAC filter combinations, these ratios were used because they highlight the main color differences between the units when no observations in F87/Hydra were made. The spectral ratio plots are presented in the top panel of Fig.17. The ratios of all ROIs (for both im-ages) have similar values in a short range in both ratio axes. According to the activity threshold values given inOklay et al.
(2016), none of the ROIs show jets or outbursts. In addition to
this analysis and to further investigate the similarities and di ffer-ences of the ROIs, hierarchical clustering analysis was applied to the spectral ratio data points shown in the top panel of Fig.17. Euclidean distance measure was used to measure the distance between data points, while the nearest neighbors were used to link the clusters. In this clustering analysis the lower distance values indicate the similarities, the higher distance values the dif-ferences. The results of the clustering analysis are presented by using dendrogram representation (bottom panel of Fig.17). The
Fig. 17.A1, A2: spectral ratios and dendrogram of hierarchically clustered data for the first data set of September 19. B1, B2: spectral ratios and dendrogram of hierarchically clustered data for the second data set of September 22.
two dendrograms in Fig. 17 show that the grouping of the spec-tral slopes follows the morphology of the selected ROIs. This indicates an abundance of similar material inside the ROIs. In addition, the two dendrograms indicate that there are two main groups for both images. For the ROIs selected from Fig.15A, this is ROI 1 and the remaining ROIs, while for the ROIs se-lected from Fig. 15B this is ROI 14 and the remaining ROIs. Some ROIs, such as ROIs 4 and 7 in Fig.17A2, are more sim-ilar to each other than the other ROIs. Simsim-ilarly, ROIs 4 and 5 in Fig.17B2 are more similar to each other than the remaining selected ROIs.
Spectral slope analysis is another technique we used to de-termine whether any spectrophotometric variations are present on the Aswan site. This technique was previously used to in-vestigate the global color of comet 67P (Fornasier et al. 2015), the landing site J (La Forgia et al. 2015), the landing site Abydos (Lucchetti et al. 2016), and the active regions (Oklay et al. 2016). The same method was applied here in the two data sets given in Table1.
The spectral slopes used in the study were calculated using spectral slope [%/100 nm]= (RNIR− RGreen) × 10 000
(λNIR−λGreen) × RGreen
, (1)
where R is the radiance factor in the filters NIR and green with their central wavelengths λ.
The spectral slopes of the Aswan region for the two di ffer-ent views are shown in Fig.18. The regions where the activity was detected display lower spectral slopes (12−14%/100 nm) than their vicinity (16−18%/100 nm), but these are the regions presented in Oklay et al. (2016) that are outside the focus of this study. In contrast, the terrains investigated in this work have similar spectral slopes (15−16%/100 nm): this may be another indication that mineralogical homogeneity is observed here. Although a few areas are typically located below the cliff
(ROIs 4, 8, and 9 in Fig.15B) and display lower spectral val-ues of 13−14%/100 nm, the spectral slope values obtained in the Aswan site are all very similar. They belong to the intermediate spectral slope group defined byFornasier et al.(2015) or to the mixed-surface definition as described inOklay et al.(2016).
No activity on the site A cliff has been detected (Vincent et al. 2016), hence no fresher or bluer material is exposed here. In contrast, inside the active sinkhole (Vincent et al. 2015) at the boundary of site A and inside its contiguous pits, clear color variations are present, which suggests active surfaces that are shown by the low spectral slopes.
The multiple spectral techniques we presented show clear spectral similarities between all the 27 different ROIs. This might indicate that the comet itself is mineralogically homo-geneous. Nonetheless, as presented by Thomas et al. (2015b),
Pommerol et al.(2015),De Sanctis et al.(2015), bright patches of water ice have been locally identified on the cometary sur-face, showing that 67P is not only characterized by an organic-rich compound (Capaccioni et al. 2015). This is particularly true when observing the plethora of different volatiles observed by ROSINA in the 67P coma (Le Roy et al. 2015), which points toward a compositional diversity for 67P. Therefore, a reason-able interpretation for our ROIs spectral similarities is that our observations might confirm an airfall coverage, whether from Hapi, when the northern hemisphere is active (Thomas et al. 2015a), or from the southern hemisphere, which is extremely active around perihelion. As predicted by Keller et al.(2015), dust airfall from the very active south might in particular settle in the northern terrains, mostly Hapi and its closest surround-ings, which would mean the Aswan area. This process can eas-ily justify a homogeneous blanket of similar material that covers the different units of the Aswan site even on gravitational slopes steeper than 40−50◦. Even a very thin airfall layer might jeop-ardize the OSIRIS identification of spectral differences between
A&A 592, A69 (2016)
Fig. 18.Spectral slopes computed for the two data sets of September 19 A) and 22 B).
the morphologic units and might consequently hide a possible surface variegation.
6. Conclusion
We focused on the Aswan site, the largest terrace of the Seth re-gion located on the main lobe of 67P. Using two OSIRIS-NAC image data sets, we have prepared a high-resolution morpholog-ical map of this area, in which we identified four main units. The study area, 0.68 km2wide, is characterized by a fine-particle de-posit overlaying a layered terrain. The fine-particle dede-posit cov-ers not only a large part of the main terrace, but also some ter-races located on the surrounding cliff. Taluses and gravitation accumulation deposits are present as well, both on the main ter-race and on the high cliff. The fourth and final morphologic unit, which is the outcropping layered terrain, is observable on the steep cliff slopes. Within this unit, several strata heads were de-tected, often cross-cut by almost perpendicular fractures. These strata reveal the layered nature of the terrain composing the bulk of the comet nucleus, as proposed by Massironi et al.(2015). Multiple niches are present here as well, as are several terraces.
One particular fracture is evident near the edge of the Aswan escarpment, propagating almost perpendicular from the scarp edge at its two ends and inward in a semicircular fashion ∼12 m away from the edge at its farthest point. This fracture is roughly 50 m long and 2−3 m wide. Tensional fractures of this type have been observed on other escarpments on the surface (El-Maarry et al. 2015a) and possibly point out areas of 67P that are prone to eventual cliff collapse and development of mass-wasting de-posits. In addition, close to the same terrace margin, several fea-tures show arched shapes in plan view. They are suggested to be formed by granular fluxes flowing down from the margin of a collapsing cliff, which is supported by the detection of mass-wasting deposits at the foot of the underlying wall. This seems to be evidence that this margin of Aswan progressively retreats because of the erosion.
Almost the entire Aswan site is covered by several boulders (1293 in total) with different sizes and shapes. The 0.50 m/px scale of the images results in the unambiguous identification of surface features as small as 2.0 m. The size-frequency of these boulders ≥2 m has a power-law index of −3.9 +0.2/−0.3 (1499 boulders ≥2 m/km2). When comparing these results with
those of Pajola et al. (2015), these values fall within the −3.5 to −4.0 range, that is, boulders of type II on 67P. This suggests that the Aswan site is mainly dominated by gravitational events triggered by sublimation and/or thermal fracturing that causes regressive erosion. Nonetheless, when focusing on specific areas of Aswan, that is, on four gravitational accumulation deposits, two located on the main terrace and two on the Aswan cliff, we derived two different power-slope indices.
On the main terrace, the two boulder distributions result in a power-slope index of −4.0 +0.4/−0.7, suggesting a similar origin. As for the global Aswan site, these two power-law in-dices support a formation through gravitational events triggered by sublimation and/or thermal fracturing that causes regressive erosion. In contrast, the two gravitational accumulation deposits located on the cliff return power-slope indices of −5.2 +0.7/−0.5 and −5.0+0.7/−0.4. This indicates that the origin for the con-sidered deposits may be similar, but it is completely different from the one indicated for the two deposits located on the terrace. These deposits are located in the proximity of highly fractured walls, and the steep power-slope indices point toward a collapse or pit formation and creation of depressions with subsequent es-cape of high-pressure volatiles and consequent high-fracturing.
By studying the gravitational framework of the Aswan site, we computed the gravitational slopes of the area. This led to the analysis of the changes in the boulder size-frequency distribution at steeper gravitational slopes. We subdivided our 1293 boul-ders into four different slope classes: slopes of 0◦−10◦, 0◦−20◦, 20◦−50◦, and 40◦−50◦. We observed that for higher gravitational slope terrains only boulders ≤10 m are identified and steeper power-slope indices are derived. In addition, no boulders ≥2 m are observed on slopes ≥50◦. This may indicate that the larger blocks detached from a sublimating cliff may not rest at these slopes and consequently fall down. Higher gravitation slopes may result in cutting the maximum dimension size of the boul-ders down to 10 m and in decreasing the number of the larger-sized boulders with respect to the smaller ones, which steepens the size-frequency power-law index.
After identifying multiple terrains with different types of tex-tures on the Aswan site, we performed the spectral analysis of this region to determine whether there are any spectrophotomet-ric differences between the various morphologic units. For this purpose, we identified 27 different ROIs that sample all types of
morphologic units, located on slopes ranging between 0◦to 75◦. Althouth we used multiple techniques to highlight the smallest differences between the surface textures, such as RGB images, I/F and relative reflectance, as well as spectral ratios and spectral slopes, we observed that very few or no spectral differences ap-pear in these units. This might be due to a redistribution of parti-cles across the nucleus as a consequence of airfall coming from Hapi. This process can easily deposit a homogeneous blanket of fine-grain dusty material that covers the different units of the Aswan site even on terrains with gravitational slopes greater than 40−50◦. A very thin layer can clearly jeopardize the OSIRIS identification of spectral differences between the morphologic units and thus hide a possible surface variegation.
Acknowledgements. We would like to thank the referee R. Aileen Yingst for important and constructive comments, suggestions, and corrections that led to a substantial improvement of the paper. OSIRIS was built by a consor-tium of the Max-Planck-Institut für Sonnensystemforschung, in Göttingen, Germany, CISAS-University of Padova, Italy, the Laboratoire d’Astrophysique de Marseille, France, the Instituto de Astrofísica de Andalucia, CSIC, Granada, Spain, the Research and Scientific Support Department of the European Space Agency, Noordwijk, The Netherlands, the Instituto Nacional de Tecnica Aeroespacial, Madrid, Spain, the Universidad Politechnica de Madrid, Spain, the Department of Physics and Astronomy of Uppsala University, Sweden, and the Institut für Datentechnik und Kommunikationsnetze der Technischen Universität Braunschweig, Germany. The support of the national funding agen-cies of Germany (DLR), Italy (ASI), France (CNES), Spain (MEC), Sweden (SNSB), and the ESA Technical Directorate is gratefully acknowledged. We thank the ESA teams at ESAC, ESOC and ESTEC for their work in support of the Rosetta mission. We made use of the software Arcgis 10.2 together with the softwares IDL, Matlab, and R to perform our analysis. This research has made use of the USGS Integrated Software for Imagers and Spectrometers (ISIS). We gratefully acknowledge the developers of SPICE and NAIF/PDS resources. M. Pajola was supported for this research in part by an appointment to the NASA Postdoctoral Program at the Ames Research Center administered by Universities Space Research Association (USRA) through a contract with NASA.
References
Acton Jr, C. H. 1996,Planet. Space Sci., 44, 65
Auger, A.-T., Groussin, O., Jorda, L., et al. 2015,A&A, 583, A35 Bibring, J.-P., Langevin, Y., Carter, J., et al. 2015,Science, 349
Capaccioni, F., Coradini, A., Filacchione, G., et al. 2015,Science, 347, 628 Clark, R. N. 1999, Spectroscopy of Rocks and Minerals, and Principles of
Spectroscopy (New York: John Weiley and Sons)
De Sanctis, M. C., Capaccioni, F., Ciarniello, M., et al. 2015,Nature, 525, 500 El-Maarry, M. R., Thomas, N., Gracia-Berná, A., et al. 2015a,Geophys. Res.
Lett., 42, 5170
El-Maarry, M. R., Thomas, N., Giacomini, L., et al. 2015b,A&A, 583, A26 Fornasier, S., Hasselmann, P. H., Barucci, M. A., et al. 2015,A&A, 583, A30 Giacomini, L., Massironi, M., Pajola, M., et al. 2016, Icarus, submitted Golombek, M., Grant, J., Kipp, D., et al. 2012,Space Sci. Rev., 170, 641 Groussin, O., Jorda, L., Auger, A.-T., et al. 2015,A&A, 583, A32 Gulkis, S., Allen, M., von Allmen, P., et al. 2015,Science, 347 Hartmann, W. K. 1969,Icarus, 10, 201
Höfner, S., Vincent, J., Blum, J., et al. 2016, A&A, submitted Jorda, L., Lamy, P. L., Gaskell, R. W., et al. 2012,Icarus, 221, 1089 Keller, H. U., Barbieri, C., Lamy, P., et al. 2007,Space Sci. Rev., 128, 433 Keller, H. U., Mottola, S., Davidsson, B., et al. 2015,A&A, 583, A34 La Forgia, F., Giacomini, L., Lazzarin, M., et al. 2015,A&A, 583, A41 Le Roy, L., Altwegg, K., Balsiger, H., et al. 2015,A&A, 583, A1 Lucchetti, A., Cremonese, G., Jorda, L., et al. 2016,A&A, 585, L1 Massironi, M., Simioni, E., Marzari, F., et al. 2015,Nature, 526, 402
Mazrouei, S., Daly, M. G., Barnouin, O. S., Ernst, C. M., & DeSouza, I. 2014, Icarus, 229, 181
Michikami, T., Nakamura, A. M., Hirata, N., et al. 2008,Earth Planets Space, 60, 13
Mottola, S., Lowry, S., Snodgrass, C., et al. 2014,A&A, 569, L2 Nyquist, H. 1928,Trans. Am. Inst. Elect. Eng., 47, 617
Oklay, N., Vincenti, J. B., Fornasier, S., et al. 2016,A&A, 586, A80 Pajola, M., Vincent, J. B., Güettler, C., et al. 2015,A&A, 583, A37 Pajola, M., Lucchetti, A., Bertini, I., et al. 2016,A&A, 585, A85 Pommerol, A., Thomas, N., El-Maarry, M. R., et al. 2015,A&A, 583, A25
Preusker, F., Scholten, F., Matz, K.-D., et al. 2015,A&A, 583, A33 Rossi, A., & Fulchignoni, M. 1999,Planet. Space Sci., 47, 873 Sierks, H., Barbieri, C., Lamy, P. L., et al. 2015,Science, 347, 1044 Thomas, N., Davidsson, B., El-Maarry, M. R., et al. 2015a,A&A, 583, A17 Thomas, N., Sierks, H., Barbieri, C., et al. 2015b,Science, 347, 440
Turcotte, D. L. 1997, Fractals and Chaos in Geology and Geophysics (Cambridge University Press)
Ulamec, S., Biele, J., Blazquez, A., et al. 2015,Acta Astronautica, 107, 79 Vincent, J.-B., Bodewits, D., Besse, S., et al. 2015,Nature, 523, 63 Vincent, J. B., Oklay, N., Pajola, M., et al. 2016,A&A, 587, A14 Werner, R. A., & Scheeres, D. J. 1997,Celest. Mech. Dyn. Astron., 65, 313
1 Center of Studies and Activities for Space, CISAS, “G. Colombo”, University of Padova, via Venezia 15, 35131 Padova, Italy
2 NASA Ames Research Center, Moffett Field, CA 94035, USA 3 Max-Planck-Institut für Sonnensystemforschung,
Justus-von-Liebig-Weg, 3 37077 Göttingen, Germany
4 Department of Physics and Astronomy “G. Galilei”, University of Padova, Vic. Osservatorio 3, 35122 Padova, Italy
5 Geosciences Department, University of Padova, via G. Gradenigo 6, 35131 Padova, Italy
6 Physikalisches Institut der Universität Bern, Sidlerstr. 5, 3012 Bern, Switzerland
7 Deutsches Zentrum für Luft- und Raumfahrt (DLR), Institut für Planetenforschung, Rutherfordstrasse 2, 12489 Berlin, Germany 8 Institute for Space Science, National Central University, 32054
Chung-Li, Taiwan
9 Aix-Marseille Universite, CNRS LAM (Laboratoire d’Astrophysique de Marseille), UMR 7326, 13388 Marseille, France
10 Department of Information Engineering, University of Padova, via Gradenigo 6/B, 35131 Padova, Italy
11 CNR-IFN UOS Padova LUXOR, via Trasea 7, 35131 Padova, Italy 12 Centro de Astrobiologa, CSIC-INTA, 28850 Torrejon de Ardoz,
Madrid, Spain
13 International Space Science Institute, Hallerstrasse 6, 3012 Bern, Switzerland
14 Scientific Support Office, European Space Research and Technology Centre/ESA, Keplerlaan 1, Postbus 299, 2201 AZ Noordwijk, The Netherlands
15 Department of Physics and Astronomy, Uppsala University, 75120 Uppsala, Sweden
16 PAS Space Reserch Center, Bartycka 18A, 00716 Warszawa, Poland 17 Institute for Geophysics and Extraterrestrial Physics, TU
Braunschweig, 38106 Braunschweig, Germany
18 Department for Astronomy, University of Maryland, College Park, MD 20742-2421, USA
19 LESIA-Observatoire de Paris, CNRS, UPMC, Univ. Paris 06, Univ. Paris-Diderot, 5 place J. Janssen, 92195 Meudon Principal Cedex, France
20 Univ. Paris Diderot, Sorbonne Paris Cite, 4 rue Elsa Morante, 75205 Paris Cedex 13, France
21 LATMOS, CNRS/UVSQ/IPSL, 11 boulevard d’Alembert, 78280 Guyancourt, France
22 INAF Osservatorio Astronomico di Padova, Vic. Osservatorio 5, 35122 Padova, Italy
23 NASA Jet Propulsion Laboratory, 4800 Oak Grove Drive, Pasadena, CA 91109, USA
24 UNITN, University of Trento, via Mesiano, 77, 38100 Trento, Italy 25 Department of Mechanical Engineering, University of Padova, via
Venezia 1, 35131 Padova, Italy
26 INAF Osservatorio Astronomico di Trieste, via Tiepolo 11, 34143 Trieste, Italy
27 Instituto de Astrofisica de Andalucia CSIC, Glorieta de la Astronomia, 18008 Granada, Spain
28 Operations Department European Space Astronomy Centre/ESA, PO Box 78, 28691 Villanueva de la Ca˜nada, Madrid, Spain 29 Institut für Datentechnik und Kommunikationsnetze der TU
Braunschweig, Hans-Sommer-Str. 66, 38106 Braunschweig, Germany