49
3 Status of Code Assessment
The ultimate aim of the assessment program is to demonstrate that SIMMER-III is sufficiently able to be applied to reactor cases. To achieve this aim the physical models of the code need to be assessed against available experimental. Moreover, it is necessary to assure the quality and robustness of the code, texting the code under a variety of initial and boundary conditions. Furthermore, it is an important objective of the assessment program to identify limitations of the code, and areas to which future effort should be directed.
Based on the above considerations, an assessment program of the code has been conducted in two steps: Phase 1 from 1992 to 1996 for a fundamental assessment of individual code models, and Phase 2 from 1996 to 2000 for integral code assessment. Phase 1 assessment applied the code to single- and multi-phase flow benchmark problems, small-scale experiments with reactor and simulant materials, and physical problems with known solutions, while Phase 2 assessment involves applications of the code to integral, complex multiphase situations. Phase 1 assessment consists of 32 problems which tested specific code models: fluid convection algorithm, interfacial area and flow regime, momentum exchange functions, heat transfer coefficients, melting/freezing and vaporization/condensation [3]. The scope of Phase 2 assessment is intended to find key accident phenomena, directly relevant to the CDA analysis and include:
1) Boiling pool dynamics (single and multi-component, steady and transient);
2) Fuel relocation and freezing (various channels with or without structure melting); 3) Material expansion (through a channel and into a pool);
4) Fuel Coolant interactions - FCIs (in a channel and a pool); 5) Disrupted core neutronics.
50
3.1 Achievement of phase-1 code assessment
The individual test problems and major achievement of Phase-1 assessment [3] were reported previously.
3.1.1 Fluid convection algorithm
The problems analyzed are 1-D shock tubes, buoyancy-driven sedimentation of fluids having different densities, rapid boiling of superheated sodium, liquid pool sloshing and water hammer. SIMMER-III calculates all the problem including the pressure buildup and propagation in single-phase liquid quite well, and this indicates that the fluid-dynamics convection algorithm is basically valid. No limitations were encountered; however the time step has to be limited to 10-4 or 10-5 s for cases with rapid vaporization or condensation.
As an example, the liquid sloshing motion, performed by FZK (now KIT), is reported [4]. In this test, a cylindrical container is divided into two concentric parts by a cylindrical diaphragm. The inner cylinder contains water of a certain height, the outer cylinder contains water at a lower level. This example was chosen to get started with a simpler two field (liquid-gas) simulation and because an analytical solution for this case is known. The water-step problem represents an oscillating system by the interaction of the central water column with the outer water ring. Under specific mass combinations, the interaction of deep water waves with those from the waves create a complicated sloshing pattern.
The main values to be compared with the experiment are the sloshing heights and arrival times of the liquid to the outer container wall and the liquid peak after convergence of the water at the center. For the simulation with SIMMER-III, a 2D mesh of 24x30 mesh points was chosen. The input values were chosen as defaulted ones in SIMMER-III.
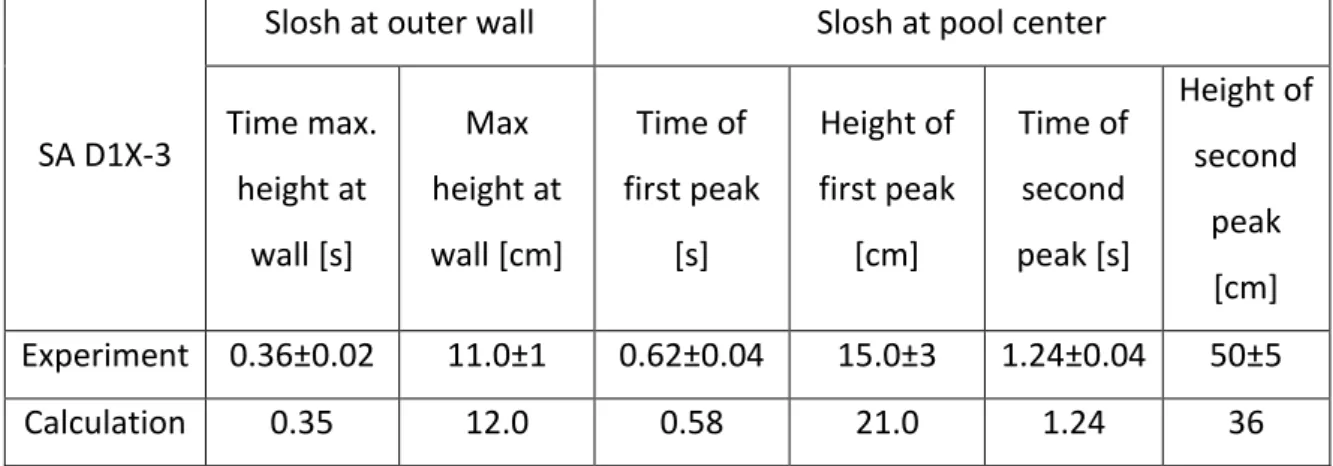
51 In Table 3.1 the results of the SIMMER-III calculation for case D1X3 are displayed. The comparison between the experimental values and the calculations show agreement in the phases when the central water column collapses and up to the time when maximum water height reaches the outer wall.
SA D1X-3
Slosh at outer wall Slosh at pool center Time max. height at wall [s] Max height at wall [cm] Time of first peak [s] Height of first peak [cm] Time of second peak [s] Height of second peak [cm] Experiment 0.36±0.02 11.0±1 0.62±0.04 15.0±3 1.24±0.04 50±5 Calculation 0.35 12.0 0.58 21.0 1.24 36
Table 3.1: Comparison of results for the water-step problem.
The wave typical for the two-dimensional water-step problem is nicely simulated but SIMMER-III simulates an additional water peak above the hump. The simulation does not present a potential central spike that it appears depending on mass ratio. Moreover, in SIMMER-III a model for momentum exchange between cells does not exits and this influences the results of the sloshing calculation. Additionally, no friction at the pool bottom is simulated, however, the overall timing of the calculation is quite good even if the simulated central peak is only 36 cm height in comparison with the experimental 50 cm height. Based on this calculation, SIMMER-III simulates the water-step problem with reasonable accuracy.
52
3.1.2. Flow regimes, momentum exchange and IFA modeling
SIMMER-III can represent multiphase flow regimes in both pool and channel geometries. The SIMMER-III flow regime map was shown to agree with experimental data on pool flow regimes, however, the code tends to underestimate the vapor-liquid film momentum coupling in pure annular flow [5].
Because the code did not reproduce correctly the flow circulation and the void distribution in a bubble column, more recently, a viscous and turbulence diffusion model has been implemented. Taking into account the radial momentum coupling due to viscous and turbulence terms, the simulation can be much improved [6].
As an example, the two-phase shock tubes analysis, developed by FZK, is reported [4]. The problem description is a straight closed duct of uniform cross-section divided into two equal parts by a diaphragm. On the left the duct contains compressed air, on the right it contains atmospheric-pressure air. The overall length of the tube is 2 m, consisting of two regions long 1 m separated by a diaphragm. As boundary conditions impermeable walls are to be specified at both ends of the tube.
The analytical solution is presented by Youngs [7]. However a simpler case was analyzed, the case of single fluid gas dynamical shock tube problem, as good approximation with the homogeneous two-phase mixture. Because two-phase effects are relevant, these approximate solutions can only give an estimation of the average velocity of the shock wave, but cannot show details of the wave structure.
Concerning SIMMER-III representation, a 1-D mesh into the z-direction was used with a uniform grid of 100 cells.
Figure 3.1 shows results of SIMMER-III about void fraction, pressure, velocity and temperature at time 1.5 ms. The small circles indicate the values of the numerical solution, while the line gives the exact solution. The results indicate a good approximation of the shock wave with some small oscillation.
53
Figure 3.1: SIMMER-III results for single fluid approximation.
3.1.3. Heat and mass transfer
Validation of the heat and mass transfer models is the most complex part of the assessment because interacting phenomena occurs simultaneously. Particularly, freezing of liquid fuel on structure plays an important role in determining fuel removal from the core in LMFR safety analysis. The code successfully simulated freezing, by crust formation, for the penetration of a cold tube by alumina melt. The calculated melt penetration lengths were significantly improved by some code modifications.
As an example, penetration and freezing of hot melts into vertical tube structures, performed by FZK, is reported [4].
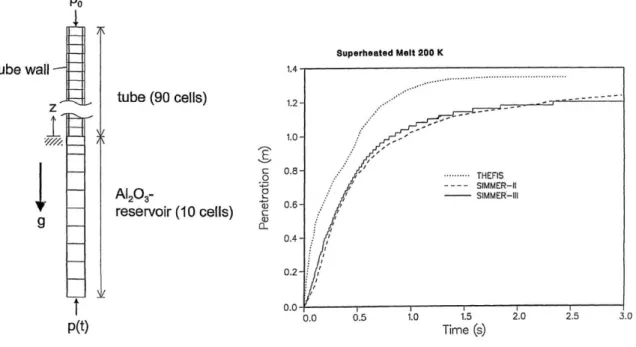
In the THEFIS experiment the freezing behavior of a thermite melt inside cold steel/quartz tubes is investigated. Starting, the tube is at room temperature and is kept into a tank containing Al2O3 at 2300 K. Suddenly, after immersion into the melt, a driving pressure is
imposed which injects the melt into the tube. The Al2O3 crust build-up at the colder walls
54 According to experiment a vertical quartz tube with an inner diameter of 6 mm and a wall thickness of 1 mm is modeled (see Figure 3.2). The tube length is 1.8 m. The tank is attached at the lower inlet of the tube and consists of a bottomless tank with 8 mm diameter and 0.2 m height. Starting the simulation, the tube structure is at 300 K and at the upper end of the tube is imposed a pressure of 0.1 MPa. The tank contains Al2O3 at
2300 K. The pressure at the tank inlet rises within 0.4 s from 0.1 MPa to the final value of 0.2 MPa with an exponential law.
The results from the simulation show a good agreement with experimental as shown in Figure 3.3. The maximum penetration length is underestimated by about 10% and the cross section is blocked by about 90% by crust formation.
Figure 3.2: SIMMER-III representation of THEFIS.
Figure 3.3: Penetration length versus time in THEFIS.
According to these data, SIMMER-III heat transfer coefficients and M/F models are adequately to simulate melt penetration during a freezing event.
55
3.2 Achievement of phase-2 code assessment
The individual test problems and major achievement of the Phase-2 assessment were reported previously [6]. In Table 3.2, tests and experiment that covered each key accident phenomena are shown. In particular, this chapter will focus on Fuel Coolant Interactions.
Problem # Full Title Short Title Org.
Category 1: Boiling Pool Dynamics CEA-G
1.1 Isothermal 3D bubble column 3D bubble JNC 1.2 2Φ flows with large liquid density Dense flow JNC 1.3 Void distribution in 2Φ flow in a pipe Void in pipe JNC 1.4 Analysis of V/C in the Sebulon experiment SEBULON CEA-G 1.5 Analysis of 2Φ flow phenomena in the Burty and
Castillejos experiment
Burty CEA-G
1.6 Analysis of vaporization and stratification in the MMB experiment
MMB CEA-G
1.7 Calculation of SCARABEE APL3 APL3 CEA-G
1.8 Analysis of SCARABEE BF2 test BF2/JNC JNC 1.9 Analysis of a boiling pool of fuel in the SCARABEE BF2
experiment
BF2/CEA CEA-G
1.10 Assessment of the 1-D 2Φ flow modeling of the SIMMER-III code on the LOTUS
LOTUS CEA-G
1.11 Rapid depressurization of a tube initially-filled with water Bartak CEA-G
Category 2: Fuel Freezing and Relocation JNC
2.1 Re-calculation of a THEFIS experiment freezing of AL2O3 melt in a quartz tube
THEFIS JNC
2.2 Analysis of THEFIS with particles THEFIS with particles
JNC
2.3 Basic freezing test sin a tube and analysis Basic freezing JNC 2.4 Fuel freezing in a steel tube: analysis of GEYSER and
BLOKKER II tests
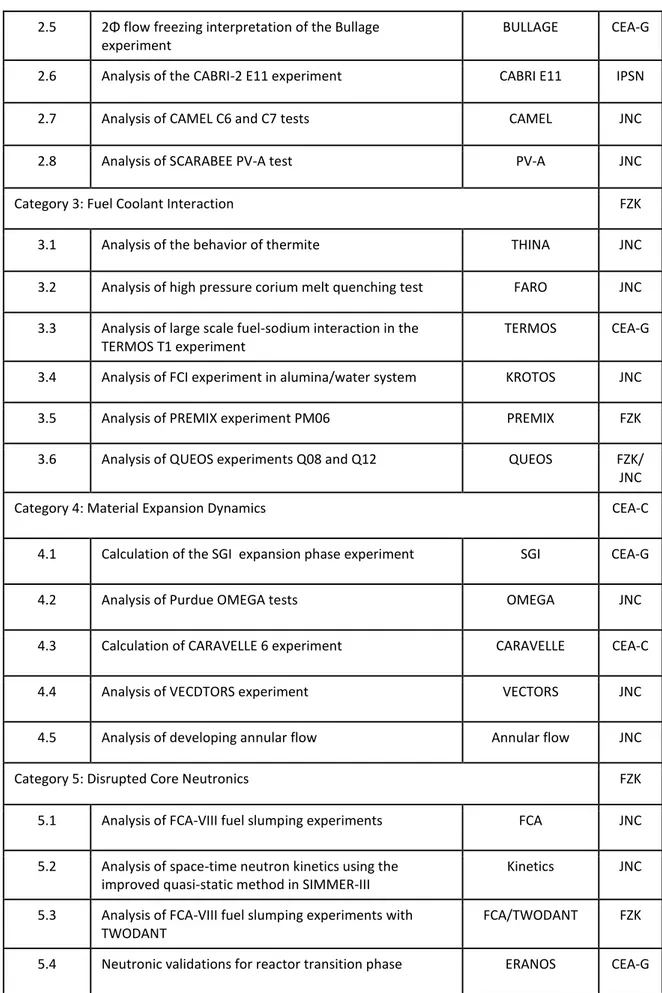
56 2.5 2Φ flow freezing interpretation of the Bullage
experiment
BULLAGE CEA-G
2.6 Analysis of the CABRI-2 E11 experiment CABRI E11 IPSN 2.7 Analysis of CAMEL C6 and C7 tests CAMEL JNC
2.8 Analysis of SCARABEE PV-A test PV-A JNC
Category 3: Fuel Coolant Interaction FZK
3.1 Analysis of the behavior of thermite THINA JNC 3.2 Analysis of high pressure corium melt quenching test FARO JNC 3.3 Analysis of large scale fuel-sodium interaction in the
TERMOS T1 experiment
TERMOS CEA-G
3.4 Analysis of FCI experiment in alumina/water system KROTOS JNC 3.5 Analysis of PREMIX experiment PM06 PREMIX FZK 3.6 Analysis of QUEOS experiments Q08 and Q12 QUEOS FZK/ JNC
Category 4: Material Expansion Dynamics CEA-C
4.1 Calculation of the SGI expansion phase experiment SGI CEA-G
4.2 Analysis of Purdue OMEGA tests OMEGA JNC
4.3 Calculation of CARAVELLE 6 experiment CARAVELLE CEA-C 4.4 Analysis of VECDTORS experiment VECTORS JNC 4.5 Analysis of developing annular flow Annular flow JNC
Category 5: Disrupted Core Neutronics FZK
5.1 Analysis of FCA-VIII fuel slumping experiments FCA JNC 5.2 Analysis of space-time neutron kinetics using the
improved quasi-static method in SIMMER-III
Kinetics JNC
5.3 Analysis of FCA-VIII fuel slumping experiments with TWODANT
FCA/TWODANT FZK
5.4 Neutronic validations for reactor transition phase ERANOS CEA-G
57
3.2.1. Boiling pool dynamics
A large amount of fuel discharge from the core can decrease reactivity. To assure a simpler path to molten fuel, optimized structure are chosen to fail before a possible recriticality occurs, consequently forming a pool. The molten core pool consists principally of a molten fuel and steel mixture. The boiling is kept by steel vaporization, which is generated by heat transfer between molten fuel (neutronically heated) and steel. In this context, the heat transfer between fuel and steel is a key phenomenon to kept in control. A number of experiments were conducted to investigate the heat transfer process in the past [8].
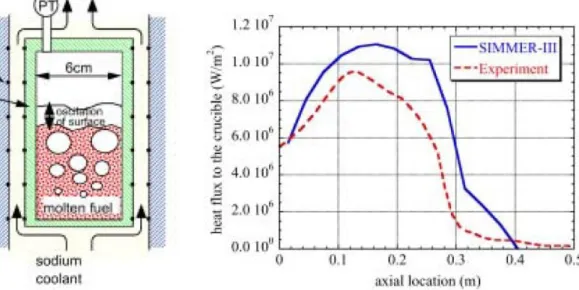
An in-pile boiling-fuel-pool experiment, SCARABEE BF2 was analyzed [9]. In the experiment, as shown in Figure 3.4, UO2 was nuclear-heated from melting to above
boiling point, and behaviour of a molten and boiling fuel pool were measured through cover gas pressure and reactivity change in the driven core. SIMMER-III simulation reproduces quite well the experimental data such as the oscillation of the pool surface and the axial heat-flux distribution along the wall (see Figure 3.5).
Figure 3.4: BF2 experiment. Figure 3.5: Axial heat flux distribution along the side wall.
58 More basic studies in this area have been performed by the CEA-Grenoble team [8]. They include:
the analysis of Burty’s isothermal experiments, in which air is injected into a water pool, demonstrating the usefulness of a simplified turbulence model;
the analysis of the SEBULON experiment, in which water is internally heated to boiling in a slab geometry, indicating SIMMER-III with turbulence treatment reasonably simulates a boiling two-phase flow pattern;
the analysis of the SCARABEE ALP3 and BE+3 tests which demonstrated that SIMMER-III is applicable to simulation of a sequence of a coolant boiling, fuel bundle disruption and wrapper tube melting.
3.2.2. Fuel relocation and freezing
In the initial stage of a CDA, molten fuel is penetrated into cold pin bundle regions mainly by fission gas pressure that is released when fuel disrupts, followed by its freezing and blockage formation. Because this phenomena is important to determine the total fuel escaped from the core, and the changing in reactivity, many experimental and theoretical analysis were made to understand the freezing phenomena.
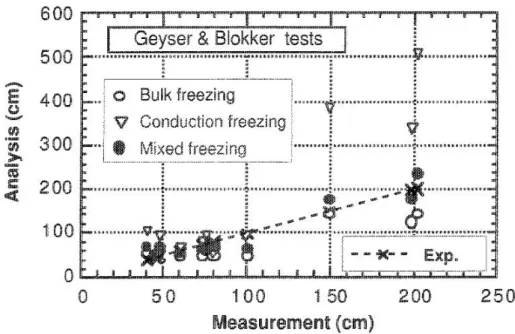
59 An improved model to represent a mixed freezing mode involving both bulk freezing and crust formation is implemented in Geyser and Blokker experiments about the study of molten UO2 freezing [10]. The model implemented, based on experimental evidence,
assumed a molten fuel subcooling at a tube wall and a gap between the liquid or crust and the wall. The analysis showed well agreement with both fuel penetration lengths and the freezing mode deduced from post-test examination.
3.2.3. Fuel coolant interactions
Many experiments have done on FCIs with molten fuel and other simulant material, and both sodium and water as coolant [11]. The experiments analyzed include:
THINA
THINA was a series of out-of-pile experiments conducted at FZK [12], in which a thermite mixture of molten alumina and iron was injected into a sodium pool from the bottom. The main aim of these experiments was to investigate the phenomenology and physics of thermal and hydraulic interactions between melt and sodium. The TH564 and TH562 tests were selected for SIMMER-III simulation.
In SIMMER-III calculations, the experimental conditions were simulated by four material components (alumina, iron, sodium and argon) and three velocity fields (thermite mixture, sodium and vapour mixture). A summary of test conditions is presented in Table 3.3.
THINA 564 THINA 562 FARO-LWR L06 KROTOS 28
Melt
Composition 24w/oAl2O3+76w/oFe 76w/oAl2O3+24w/oFe 80w/oUO2+20w/oZrO2 Al2O3
Mass (kg) 5.5 4.1 18 1.45
Temperature (K) 3270 3270 2923 2673
Driving force 2.5 MPa (pool bottom)
2.5 MPa (pool bottom) Free fall Free fall
Coolant
Composition Sodium Sodium Water Water
60 Depth (m) 2.70 2.67 0.87 1.12 Temperature (K) 763≈795 773≈785 503≈539 360 Sub-cooling (K) ≈380 ≈380 ≈2 10 Pool diameter (m) 0.3 0.3 0.47 0.095 Cover Gas Pressure (MPa) 0.11 0.11 5.0 0.1 Volume (m3) 0.11 0.11 5.0 0.1
External trigger 0.15 0.15 0.464 8.5 MPa Ar
Table 3.3: Summary of FCI Experimental Parameters.
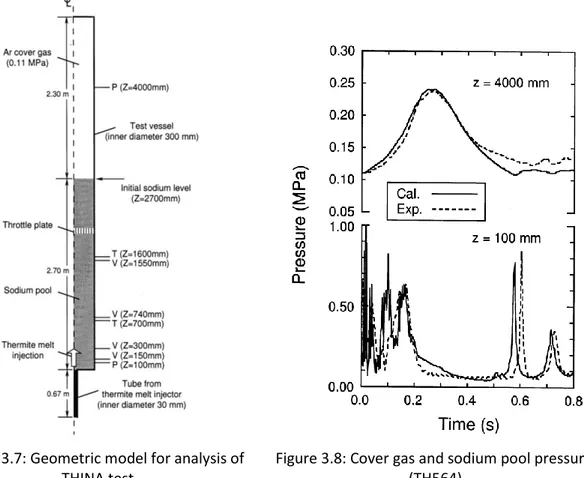
As shown in Figure 3.7, a cylindrical vessel with a high of 5 m and with an inner diameter of 30 cm was modeled by a 2D geometry with 6x30 computational cells. The lower part of the vessel was initially filled with liquid sodium and argon gas at 0.11 MPa. The thermite injection was simulated by driving the thermite mixture containing a small portion of non-condensable gas through a tube longs 67 cm and with a diameter of 3 cm, using a pressure boundary condition of 2.5 MPa. A total amount and rate of molten mass injection were adjusted by an orifice at the tube exit until the injection period became consistent with experimental data.
Figure 3.8 indicates that SIMMER-III reasonably reproduced the pressure trend of the test. The TH564 test was calculated assuming that 13% volume fraction of non-condensable gas is contained homogeneously in the thermite mixture. It was found that non-condensable gas influences thermal interactions in the sodium pool, especially the collapse behavior of the two-phase region, and that the collapse pressure peaks in the sodium pool are well simulated at about 0.6 s and 0.73 s.
Figure 3.9 and Figure 3.10 show calculated results of temperatures in the sodium pool and mean cross sectional void fractions at the different axial levels, respectively in comparison with experimental data. It is seen that SIMMER-III underestimates the axial expansion of the two-phase region. One of the reasons might that the non-condensable gas was separated from the melt initially in the experiment, which was not represented by this analysis.
61
Figure 3.7: Geometric model for analysis of THINA test.
Figure 3.8: Cover gas and sodium pool pressures (TH564).
Figure 3.9: Temperatures in sodium pool (TH564).
Figure 3.10: Cross sectional void fraction in sodium pool (TH564).
62
FARO
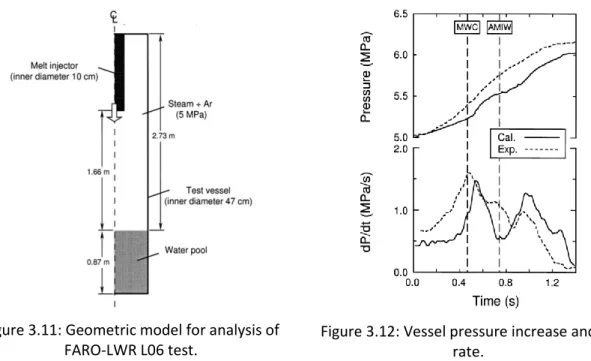
For a second application of SIMMER-III, one of the FARO-LWR tests, the L06 experiment, was selected [13]. The aim of these experiments was to investigate phenomena related to the mixing and quenching of LWR melts in water. The L06 experiment involves 18 kg of UO2/ZrO2 melt at 2923 k into the water pool at 5 MPa.
In SIMMER-III calculations, the experimental conditions were simulated by three material components (melt, water and argon) and three velocity fields (melt, water and vapor mixture). As shown in Figure 3.11, the cylindrical vessel high 3.6 m and with an inner diameter of 47 cm was modeled by a 2D geometry with 5x60 computational cells. Melt droplets frozen in the pool were assumed to be solid particles of 4.5 mm diameter. Before Melt Water Contact a pressure increase of about 0.4 MPa measured was considered to be due to flashing water to steam and heat transfer from the falling melt by conduction and radiation. SIMMER-III does not model the radiative heating and therefore underestimates the pressure increase before MWC as indicated in Figure 3.12.
Figure 3.11: Geometric model for analysis of FARO-LWR L06 test.
Figure 3.12: Vessel pressure increase and its rate.
Despite the discrepancy, due mainly to modeling limitations, the vessel pressure increase and the behavior of melt penetration into coolant were well simulated by SIMMER-III.
63
KROTOS
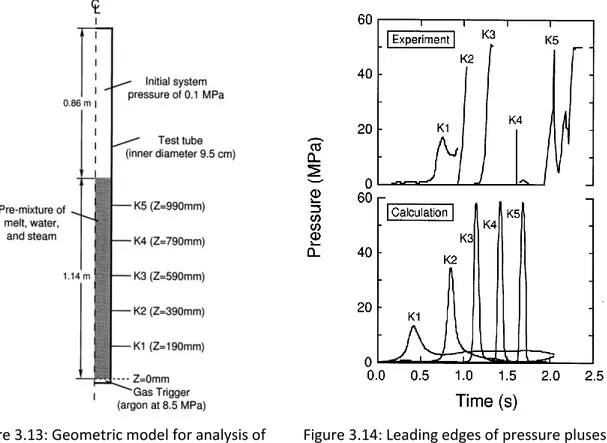
The KROTOS 28 test performed at JRC Ispra [14] was simulated also by SIMMER-III. The objective of the test was to investigate the propagation phase of a steam explosion in an alumina melt/water mixture, triggered by pressurized gas. The mixture was well established by releasing alumina melt at 2673 K into a vertical tube filled with water at 360 K.
In the SIMMER-III calculation, the experimental conditions were simulated by three material components (alumina, water and argon) and three velocity fields (melt, water and vapor mixture).
As shown in Figure 3.13, the experimental geometry of the test tube high 2 m and with an inner diameter of 9.5 cm was modeled by a 1D geometry with 21 computational cells. It was assumed that the tube up to a height of 114 cm, was filled with the mixture of molten alumina, water and steam with volume fractions of 0.08, 0.88 and 0.04 respectively. These values were taken from an experimental estimation.
The SIMMER-III calculation started from the triggering explosion in the pre-mixture using a release of argon pressurized to 8.5 MPa from the bottom. SIMMER-III predicted film boiling heat transfer at the initial of the simulation and, after triggering, the code predicted direct heat transfer through melt-water contact. This phenomena causes also rapid water vaporization and the resultant pressure increase accelerates the pre-mixture of melt, water and vapor. This leads to hydrodynamic fragmentation of the melt droplet and further increase of the heat transfer between melt to water, which then enhances pressure-wave propagation.
64
Figure 3.13: Geometric model for analysis of KROTOS 28 test.
Figure 3.14: Leading edges of pressure pluses along the test tube.
A SIMMER-III result is given in comparison with the experimental data in Figure 3.14 in which zero time corresponds to the instant of triggering. It is seen from this figure that SIMMER-III is able to predict the rapid pressure wave propagation and escalation along the tube as experimentally observed; so SIMMER-III even if was not developed for FCI analysis, is capable to describe the propagation process that occurs in vapour explosions.
65
3.2.4. Material expansion dynamics
Validation on expansion phase in CDA generally includes two aspects: thermo-hydraulic losses from the hot mixture of core materials flowing through the upper core structures and dynamics of a vapour bubble expanding and condensing in a coolant plenum. For the former, SIMMER-III tends to underestimate the pressure drop in annular and annular droplet flows in a channel but it is not a problem because is a conservative estimation. Concerning the bubble expansion, SIMMER-III can satisfactorily reproduce bubble behaviour and the resultant pool motion measured in the nitrogen experiments [1].
3.2.5. Disrupted core neutronics
Concerning the neutronic in disrupted core, prediction of large-scale fuel motion reactivity effects is essential. During a CDA, the reactivity changes from an intact configuration to a disrupted configuration and this behaviour is well reproduced by SIMMER-III using the transport theory of SIMMER-III, however, uncertainties in cross section data are presented. A new flux shape calculation procedure, based on TWODANT diffusion scheme, was implemented in SIMMER-III, that permitted a significant speed-up of the calculation. This new approach showed same good accuracy but with less CPU time due to an easier reach of convergence [1].
66
3.3 Recent validation
New validation processes has been performed since 2000, particularly in:
CABRI-EFM1
This experiment was selected from a series of in-pile experiments conducted using the CABRI French reactor [15]. It realized fuel melting after sodium voiding, for the thermal failure mode. This experiment has already been calculated by SIMMER-III, focusing on fuel freezing and blockage behaviour [8].
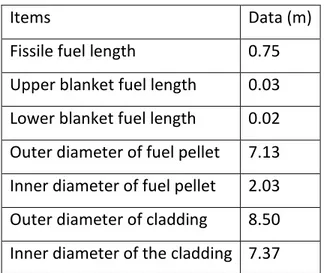
The CABRI-EFM1 experiment was carried out using a single fuel pin in 1994. Table 3.4 summarizes the specifications of the annular fuel pin.
Items Data (m)
Fissile fuel length 0.75 Upper blanket fuel length 0.03 Lower blanket fuel length 0.02 Outer diameter of fuel pellet 7.13 Inner diameter of fuel pellet 2.03 Outer diameter of cladding 8.50 Inner diameter of the cladding 7.37
Table 3.4: Specification of fuel pin in the CABRI-EFM1 experiment.
The aim of this experiment was to simulate extended fuel motion in a high energy fuel assembly in a LOF. The detailed fuel pin model in SIMMER-III, which was capable of analysing the radial distribution of temperature by multiple radial nodes, was used in this calculation because it was important to know the correct radial profile that influenced the fuel disruption behaviour. An axially 1D geometric model was implemented. Because the particle viscosity is a key parameter in simulating the fuel blockage phenomena, a new model was implemented in SIMMER-III, firstly proposed by Russel [16]:
67 , , , 1 1 MP p eff m L MP p eff P p eff S f
where m is the effective viscosity of the continuous liquid phase, L is the viscosity of the continuous liquid phase, P is the total volume fraction of particle components, S is the total volume fraction of structure components, f is the model parameter (default is 5.0). The maximum packing fraction MP was determined semi-empirically as 0.62. The idea of melt fraction was introduced into the particle viscosity model to represent the penetration of the fuel particles into the channel.
Figure 3.15 compares the initial fuel temperature profiles between the SAS4A results, the SIMMER-III detailed pin model and simple model. The simple pin model calculates fuel temperatures represented only by two radial nodes (interior and outer surface). In this case the thermal conduction is not well calculated in the interior node, so this model tends to overestimate the interior temperature. On the other hand, the detailed pin model can calculate the radial distribution of temperature, and so it agrees well with the result calculated by SAS4A that can accurately calculate fuel temperature.
68 As shown in Figure 3.16, boiling time was well simulated by the SIMMER-III. Voiding expansion behavior is presented in Figure 3.17. Looking at the boiling onset position and void interface, the calculated behavior agrees well with the experimental result.
Figure 3.16: Coolant flow rate in CABRI-EFM1.
69
EAGLE Project
The validation of SIMMER-III for these experiments conducted in the EAGLE project is ongoing [17].
The EAGLE experimental program is conducted utilizing the safety research facilities at the National Nuclear Center of the Republic of Kazakhstan (NNC/RK). This program is dedicated to showing experimental evidence for elimination of the re-criticalities in sodium cooled fast reactor, in particular for a new type of assembly, the so-called FAIDUS (Fuel Assembly with Inner DUct Structure, see Figure 3.18).
Figure 3.18: FAIDUS fuel SA design option with central and off-centred discharge duct.
Both of the in-pile and out-of-pile facilities of the NNC/RK are utilized to show that molten fuel can escape from the core region when reactor core melting occurs.
70 The matrix of the in-pile experiments is shown in Figure 3.19. All these experiments were performed in the central experimental channel of IGR (Impulse Graphite Reactor) of the NNC/RK.
Figure 3.19: In-pile test matrix of the EAGLE project.
A preliminary WF test is illustrated [18].
Figure 3.20 shows the setup of the WF test section. To the dimension description see the figure. The fuel was made of 4.4% enriched UO2 pellets of the VVER type with a blanket
pellets made of UO2 with natural isotopic concentration. To reach the melting point of
UO2, energy was inserted by high neutron flux in the central experimental channel of the
IGR.
Based on the initially installed mass of fuel pins, it is assumed that the surface level of the molten fuel and cladding came up to about -50 mm from the IGR core center level, forming a molten pool between 27.5 s and 28 s after the insertion of energy in fuel. The results of gas-pressure measurement for each separated space (fuel cavity, gas gap and Na gap) is shown in Figure 3.21. The analysis was performed with the intention of identifying the wall failure timing that should be occur when the difference pressure
71 between two spaces become zero. Two stages of wall failure (for the gas-gap and Na-gap sides) have been assumed in the WF test.
Although the failure timing of the wall is not clear from the picture, it should happen between 29.6 s and 34 s. At these times in fact, the pressure equilibrium between the gas and the Na gaps suggests that until that time the fuel cavity and the gas gap were spatially connected and the pressure peak that occurs at about 29 s suggests that a thermal interaction between molten fuel and sodium was occurred.
72
3.4 References
[1] Kondo Sa., et al., "Current Status and Validation of the SIMMER-III LMFR Safety Analysis Code", 7th International Conference of Nuclear Engineering, Tokyo, Japan, 19-23 April 1999.
[2] Tobita Y., et al., "The development of SIMMER-III, an Advanced Computer Program for LMFR Safety Analysis, and Its Application to Sodium Experiments", Nuclear Technology Vol.153, March 2006.
[3] Kondo Sa., et al., “Status and Achievement of Assessment Program for SIMMER-III, A Multiphase, Multicomponent Code for LMFR Safety Analysis”, Proc. NURETH-8, Vol. 3, pp. 1340-1348, Kyoto, Japan, 30 September - 3 October 1997.
[4] Maschek W., “SIMMER-III Code-Verification Phase 1”, FZKA 5690, Forschungszentrum Karlsruhe, May 1996.
[5] Coste N. and Tobita Y., "Two Phase Channel Flow Modeling in SIMMER-III, a Multiphase, Multicomponent Code for LMFR Safety Analysis", Proc. Of ICMF '98, Lyon, France, 1998.
[6] Kondo Sa., et al., "Phase 2 Code Assessment of SIMMER-III, a Computer Program for LMFR Core Disruptive Accident Analysis", JNC TN9400 200-105.
[7] Zuber N., et al., “Multiphase Science and Technology, Vol.6”, Hemisphere Publishing Corporation, New York, 1992.
[8] Yamano H. and Tobita Y., "Experimental Analyses by SIMMER-III on Molten Fuel Freezing and Boiling Pool Behavior", Journal of Power and Energy Systems, Vol.3, N°1, 2009.
[9] Tobita Y., et al., “An Analysis of Boiling Fuel Pool Experiment by SIMMER-III”, Proc.NURETH-8, Vol.3, 1357, 1997.
[10] Brear D., et al., “Modelling of Fuel Freezing for Reactor Safety Analysis”, Fall Mtg. of AESJ, H57, 1997
73 [11] Morita K., et al., "SIMMER-III Applications to Fuel-Coolant Interactions",
Nucl.Eng.Des. 189 (1999) 337-357.
[12] Huber F. and Keiser A., “Experiments on the Behavior of Thermite Melt Injected into Sodium – Final Report on the THINA tests results”, Proc. Of IAEA/IWGFR Technical Committee Meeting on Material – Coolant Interactions and material Movement and Relocation in Liquid Metal Fast Reactor, O-arai, Japan, 6-9 June 1994.
[13] Magallon D. and Hohmann H., “High Pressure Corium Melt Quenching tests in FARO”, Nucl.Eng.Des. 155 (1995) 253-270.
[14] Hohmann H., et al., "FCI Experiments in the Aluminum Oxide/Water System", Nucl.Eng.Des. 155 (1995) 391-403.
[15] Yamano H. and Tobita Y., "Experimental Analyses by SIMMER-III on Fuel-Pin Disruption and Low-Energy Disrupted Core Motion", Journal of Power and Energy Systems, Vol.4, N°1, 2010.
[16] Russel W.B., “Effects of the Interaction between Particles and Rheology of Dispersions”, R.E.Meyer, Theory of Dispersed Multiphase Flow, pp. 1-34, Academic press, New York, 1983.
[17] Tobita Y., “Future plans and possible activities at JAEA”, 16th SIMMER-III/IV Review Meeting, University of Pisa, 29th May – 1st June 2012.
[18] Konishi K., et al., “The Result of a Wall Failure in-pile Experiment under the EAGLE Project”, Nucl.Eng.Des. 237 (2007) 2165-2174.
[19] Tobita Y., et al., "Analytical Study on Elimination of Severe Re-criticalities in Large Scale LMFBRS with Enhancement of Fuel Discharge", Nucl.Eng.Des. 238 (2008) 57-65.