Material and methods
Mice
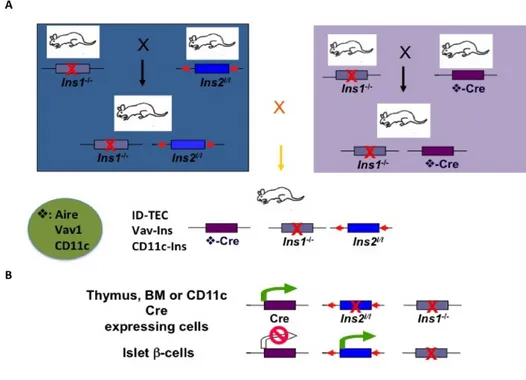
Loxp-tagged Ins2 mice were generated through standard gene targeting methods as described in the Results section. Aire-Cre transgenic mice were obtained through pronuclear injection of the linearized Cre construct into fertilized eggs harvested from C57BL/6 mice. Vav-Cre transgenic mice were obtained through pronuclear injection of a linearized Vav1-Cre construct into fertilized eggs harvested from B6; 129 F1 mice and were subsequently crossed to the C57BL/6 background. CD11c-Cre mice were purchased from the Jackson Laboratory (Bar Harbor, ME).
The transgenic lines were subjected to multiple rounds of breeding with Ins1 -/-:Ins2l/l mice to obtain ID-TEC (Aire-Cre: Ins1-/-:Ins2l/l), Vav-Ins (Vav-Cre: Ins1-/-:Ins2l/l) and CD11c-Ins (CD11c-Cre: Ins1-/-:Ins2l/l) mice respectively (Figure 5). Thus, all the animals in the study are on the 129:B6 mixed genetic background, with the MHC H-2b haplotype shared by both the 129 and C57BL/6 strains. To obtain the B6g7.CD11c-∆Ins mice, CD11c-∆Ins mice were crossed to congenic B6.2g7 mice (Jackson Laboratory) to fix the H-2g7 MHC alleles.
Heterozygous loxp-tagged Ins2 mice were first crossed to Flp-recombinase expressing mice (129S4/SvJaeSor-Gt(ROSA)26Sortm1(FLP1)Dym/J, the Jackson Laboratory, Bar Harbor, ME) to delete the Neo cassette, and then interbred to obtain homozygous Ins2l/l mice. Subsequently, Ins2l/l mice were crossed to with Ins1 knockout mice (a gift from Dr. Jacques Jami) to obtain Ins2l/l:Ins1-/- mice.
Immune deficient C657BL/6 Rag1-/- mice (B6.129S7-Rag1tm1Mom/J), Rip-Cre
mice (B6.Cg-Tg(Ins2-Cre)25Mgn/J) and Rosa26R-lacZ (B6.129S4-Gt(ROSA)26Sortm1Sor/J) mice were all purchased from the Jackson Laboratory, Bar Harbor, ME. Vav-Cre:Rosa26R-EYFP and Aire- Cre:Rosa26R-EYFP mice were generated via crossing female Rosa26R-EYFP (Jackson laboratory) to male Vav-Cre and Aire-Cre mice, respectively.
All mice were housed in a specific pathogen-free animal facility at Rangos Research Center, Pittsburgh. All experiments were performed in accordance with institutional guidelines.
Figure 5 - Schematic view of our strategy to specifically target insulin expression in ID-TEC, Vav-Ins and CD11C-Ins mice. (A) Generating experimental mice. Both Ins2-floxed
and Cre transgenic mice were crossed to Ins1 knockout mice. Breeding of the resulting v-Cre-transgenic line and the Ins2-floxed line will produce the ID-TEC mice (Aire-Cre:Ins2l/l:Ins1-/-), the Vav-Ins mice (Vav-Cre:Ins2l/l:Ins1-/-) and the CD11c-Ins mice
(CD11c-Cre:Ins2l/l:Ins1-/-). (B) Tissue-specific Ins2 deletion in experimental mice. The mouse Ins2 gene
is specifically deleted in tissues expressing the Cre recombinase gene, but not in the pancreatic islet β-cells. Red arrow head, loxp sites; Green arrow, active transcription; Red stop circle, transcription inactivation; Red X, gene deletion.
Constructs
To constitute the Aire-Cre plasmid, DNA segments flanking the Aire coding region were subcloned from a BAC plasmid containing the mouse Aire gene. The Aire-Cre construct was assembled from a 23-kb DNA fragment containing the sequence 5’ of the mouse Aire gene and including its first exon, a PCR product of the Cre recombinase cDNA, and an 11-kb fragment 3’ of the last exon of the Aire gene.
The Ins 2 floxed construct was cloned into the pBluescript KSII+ vector (Stratagene). 5’ loxp site was inserted at the PmlI site (5’ of the insulin promoter region); the 3’ loxp site (together with the FRT-tagged Neo cassette) was inserted at the BamHI site (3’ of the Ins 2 gene). Both SalI and NotI sites are unique. Both the 5’ and 3’ DNA fragments of the mouse Ins 2 gene were isolated from screening a mouse genomic DNA library. The Vav-promoter vector was a gift from Dr. Jerry Adams.
Genotyping of genetically modified animals
0.5 cm tail biopsies were surgically removed from 14-20 days old pups. Genomic DNA was isolated with DNeasy Blood & Tissue Kit (Qiagen Inc., Valencia, CA) and amplified by PCR (a single denaturing step at 94°C for 2 min, followed by 30 cycles of 94°C for 30 sec, 60°C or 65°C for 30 sec, 72°C for 1 min, and a final extension at 72°C for 3 min). The reactions were performed using 100 ng genomic DNA, 2 µM each primer, 10 mM dNTP, 10X reaction buffer and 0.5 µl Taq polymerase (Titanium Taq, Clontech) in a final volume of 50 µl. Primer pairs and annealing temperature used in the study are listed in Table 1. Products were visualized on ethidium-bromide stained 1.6% agarose gels.
H-2 haplotypes were determined by staining PBMCs with anti-MHC class I antibodies specific for H-2Kb and H-2Kd, clones AF6-88.5 and SF1-1.1, respectively (BD Biosciences, San Diego, CA).
Table 1 - Primer pairs used for genotyping
Gene Primers Genotyping
Cre 5’ GAGTGATGAGGTTCGCAAGAA 3’ 5’ GCGCGCCTGAAGATATAGAAG 3’
Annealing T: 60°C Cre PCR product: 150 bp
Ins2 5’ GACTCTGGGAAAGGCATCTGTTCAG 3’ 5’ TTGCTTACAGTCTATTTTCAGGGTC 3’
Annealing T: 65°C Ins2 floxed allele: 225 bp
Ins2 wt allele: 154 bp Ins1
5’ CCAGATACTTGAATTATTCCTGGTGTTTTATCAC 3’ 5’ GCT GCA CCA GCA TCT GCT CCC TCT ACC 3’ 5’ TTC TCG GCA GGA GCA AGG TGA GAT GAC 3’
Annealing T: 65°C Ins1 KO allele: 550 bp Ins1 wt allele: 273 bp
Blood glucose, insulin levels, Intraperitoneal Glucose Tolerance Test (IPGTT) and Hematocrit measurement.
Blood glucose levels were monitored with the Ascensia Contour blood glucose monitoring system (Bayer HealthCare LLC, Mishawaka, IN). Blood insulin levels were measured with the Mercodia Ultrasensitive Mouse Insulin Elisa Kit (Mercodia AB, Sweden), following the manufacturer’s protocol.
To perform IPGTT, mice were fasted overnight (~16 hours) and injected intraperitoneally with 2g of D-glucose (Sigma-Aldrich, St. Louis, USA) per kilogram of body weight. Blood was sampled from a small nick of the tail vein at 0, 15, 30, 60, 90 and 120 minutes after glucose injection. Direct hematocrit measurements were determined on fresh whole blood samples harvested from 40-week old females by Heska IStat Portable Clinical Analyzer (Heska, Loveland, CO).
RNA Analysis
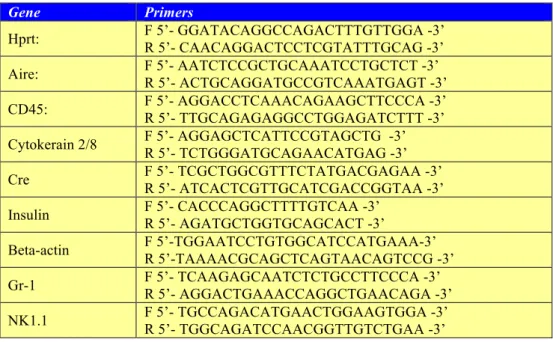
The total RNA of spleens, pooled thymi, isolated thymi or sorted cells was isolated using a RNA minikit, according to the manufacturer’s protocol (Qiagen). Following DNase I treatment (Ambion), total RNA (up to 5 µg) were reverse-transcribed into cDNA with Oligo(dT)20 primer and Superscript III reverse transcriptase using the SuperScript First-Strand Synthesis System (Invitrogen). qPCR analyses of gene expression in cDNA samples were performed with the LightCycler FastStart DNA Master SYBR Green I kit, and analyzed with the LightCycler 2 software (Roche Applied Science). A total reaction volume of 20 µl contained 1 µl of cDNA, 0.5 µM of each primer and 2 µl of Master mix SybrGreen I 10X. The PCR program was set at 10 min denaturation step, followed by a variable number of amplification cycles depending on the amplimers at 95°C for 5 sec, 15 sec annealing at 60°C (unless specified) and 20 sec extension at 72°C. Fluorescence was acquired in single mode during the extension step. The melting curve was set at 95 °C, 63/65 °C and 95 °C for 0 sec with a slope of 0.1 °C/s in continuous mode of fluorescence acquisition. Primer pairs used in the study are listed in the table below (Table 2).
Table 2 - Primer pairs used for qPCR
Gene Primers
Hprt: F 5’- GGATACAGGCCAGACTTTGTTGGA -3’ R 5’- CAACAGGACTCCTCGTATTTGCAG -3’ Aire: F 5’- AATCTCCGCTGCAAATCCTGCTCT -3’ R 5’- ACTGCAGGATGCCGTCAAATGAGT -3’
CD45: F 5’- AGGACCTCAAACAGAAGCTTCCCA -3’
R 5’- TTGCAGAGAGGCCTGGAGATCTTT -3’
Cytokerain 2/8 F 5’- AGGAGCTCATTCCGTAGCTG -3’
R 5’- TCTGGGATGCAGAACATGAG -3’ Cre F 5’- TCGCTGGCGTTTCTATGACGAGAA -3’ R 5’- ATCACTCGTTGCATCGACCGGTAA -3’
Insulin F 5’- CACCCAGGCTTTTGTCAA -3’ R 5’- AGATGCTGGTGCAGCACT -3’ Beta-actin F 5’-TGGAATCCTGTGGCATCCATGAAA-3’ R 5’-TAAAACGCAGCTCAGTAACAGTCCG -3’ Gr-1 F 5’- TCAAGAGCAATCTCTGCCTTCCCA -3’ R 5’- AGGACTGAAACCAGGCTGAACAGA -3’ NK1.1 F 5’- TGCCAGACATGAACTGGAAGTGGA -3’ R 5’- TGGCAGATCCAACGGTTGTCTGAA -3’
Histology and Immunohistochemistry
Pancreata, spleens and thymi were harvested, fixed in 4% paraformaldehyde for 3 hours at 4oC, and placed in 30% sucrose overnight. Cryosections 5 µm thick were cut and stained with primary antibodies. Antibodies used in the study: CD3, CD45, CD4, CD8 and B220 (BD Biosciences, Franklin Lakes, NJ); Insulin (Santa Cruz Biotechnology, Santa Cruz, CA); Glucagon (Zymed, San Francisco, CA); β-galactosidase (Chemicon, Temecula, CA).
Adoptive Transfer Experiments
Spleen, mesenteric and pancreatic lymph nodes were harvested from ID-TEC mice. Single cells, prepared by pressing gently the tissues with the plunger of a syringe, were subjected to magnetic bead isolation first for CD4+ T-cells following manufacturer’s protocols (Miltenyi Biotec, CD4+ T-cell isolation kit), followed by FACS sorting of CD25- and CD25+ cells. Purities above 95% were
achieved routinely. The CD8+ T-cell isolation kit was used for CD8+ T-cell isolation (Miltenyi Biotec). Equal numbers (5x10⁵) of T-cells of the different subsets were mixed and injected into Rag1-/- mice through the tail vein (i.v.).
Thymus transplantation
Thymic lobes were isolated from two-week old ID-TEC pups or littermate controls, and cultured in trans-wells at 37oC in the presence of 1.35 mM deoxyguanosine (Sigma-Aldrich) for 10 days to eliminate hematopoietic cells. Two lobes were grafted beneath the kidney capsule of each 6-8 week old nude mouse. At the end of the study (16-week post thymus transplantation), pancreata were harvested for histological analysis.
Tetramer analysis of CD8+ T-cells specific to HY autoantigen Uty
Animals were injected with 5x10⁵ male splenocytes harvested from littermate controls of ID-TEC mice intraperitoneally (IP). Two weeks after the initial priming, splenocytes were separated with CD8+ T-cell isolation kit (Miltenyi Biotech) and stained with CD3, CD8 and Pro5 MHC class I Db/Uty pentamer, following manufacturer’s protocols (ProImmune).
Insulin autoantibody (IAA) assay
96-well EIA plate was coated with 2 µg of heat-inactivated (95oC, 30 minutes) human insulin in 100 µl of PBS overnight. Wells were blocked with PBS with 10% of bovine serum albumine (BSA) for two hours at room temperature, and probed with mouse sera harvested from 3-8 week old ID-TEC mice and age-matched controls (1:50 dilution, 100 µl in each well) for another two hours.
Next, biotin-conjugated rat anti-mouse IgM (BD Biosciencs) was added to the well (1:5000 dilution) and incubated for 30 minutes, followed by incubation with horseradish peroxidase-conjugated streptavidin (1:4000) for 15 minutes. Lastly, ACE substrate (BD Biosciences) was added to each well and the absorbance at 450 nm was measured with Bio-Rad Microplate Reader.
Flow cytometry
Flow cytometric analysis was performed on the BD FACSCalibur flow cytometer (BD Biosciences, San Jose, CA) and analyzed with CellQuest Pro software (BD Biosciences). Single cell suspensions were prepared from spleen, subjected to erythrocyte depletion in red blood cell lysis buffer (Sigma-Aldrich, St. Louis, MO). 0.5-1 million cells were blocked with anti-CD16/32 antibody, stained with 10-20 µl of diluted antibodies and gentle mixed at 4°C for 30 min. Samples were washed and centrifuged at 1000 rpm for 10 min at 4°C with phosphate buffered saline (PBS, calcium and magnesium free, Invitrogen) supplemented with 1% BSA Aldrich) and 0.1% sodium azide (Sigma-Aldrich). After the final wash, cells were fixed in PBS containing 2% paraformaldehyde. The following antibodies were purchased from BD Biosciences: anti-CD16/32, anti-CD4 PeCy5, anti-CD45-APC, and anti-CD3-APC. Anti-CD25-APC antibody was purchased from Miltenyi Biotec (Auburn, CA). Negative controls included unstained cells, omitting the primary Ab and the appropriate isotype control.
Intracellular staining of the Foxp3 protein was performed with commercial kit purchased from eBiosciences (San Diego, CA), following manufacturer’s suggested protocol.
Isolation of stromal cells from lymphoid organs
Thymus tissue was minced into pieces, digested for 15 min at 37° C for three or four cycles with 1.25 mg/ml Collagenase D (Sigma-Aldrich) and 0.2 mg/ml DNAse I (Roche) in RPMI. The enzyme mixture was replaced with 0.2 mg/ml Collagenase/Dispase (Roche) and DNAse I (0.2 mg/ml) for final digestion. Phosphate buffered saline (PBS, calcium and magnesium free, Invitrogen) supplemented with 1% BSA Aldrich) and 2mM EDTA (Sigma-Aldrich) was added to the cell suspension, which was filtered through a nylon mesh. Single cells were subjected to magnetic-beads isolation to select CD45- and CD45+ cells, following manufacturer’s protocols (Miltenyi Biotec, CD45+ cell isolation kit). CD45+ cells harvested were stained with CD45, anti-MHC class II and anti-CD11c antibodies, while CD45- cells were stained with anti-CD45, anti-EpCAM, anti-Ly51 and anti-UEA antibodies. Cells were sorted by FACSAria as described in the results section.
Cells from the spleens were obtained following the same digestion protocol described above. After treatment with red cell lysis buffer (Sigma-Aldrich), single cells were subjected to magnetic bead isolation to positively select CD45+ bone marrow derived cells, following manufacturer’s protocols (Miltenyi Biotec, CD45+ cell isolation kit). Cells harvested were stained with anti-CD45, anti-B220, anti-CD11c, anti-IA/IE, and anti-NK1.1 antibodies and analyzed with FACSCalibur as described above.
To enrich EYFP+ cells, isolated splenocytes were stained with anti-CD11c and anti-CD45 antibodies, and sorted by FACS. Purities above 95% were achieved routinely.
ELISPOT Assay
ELISPOT assays were performed using the BD mouse IFN-γ ELIPOT set, according to the manufacturer’s specifications (BD Biosciences). Splenocytes (3 x 10⁶) from two to three mice were pooled and cultured overnight with 0.1 mg/ml insulin (Sigma-Aldrich), whole GAD65 protein (Abnova), insulin B chain peptide 9-23 (SHLVEALYLVCGERG, AnaSpec), GAD65 peptide 206-220 (TYEIAPVFVLLEYVT, Sigma-Aldrich) or medium alone. Assays were repeated and performed in triplicate and averaged. To evaluate immune response to male-specific HY autoantigen, 2x10⁵ splenocytes were incubated with 10µg/ml Dby peptide (NAGFNSNRANSSRSS, AnaSpec) overnight.
Statistical Analysis
Statistical significance was determined using paired, student t test. In all experiments, differences were considered significant when P was less than 0.05.