CHAPTER 4
RESULTS
4.1 VIABILITY
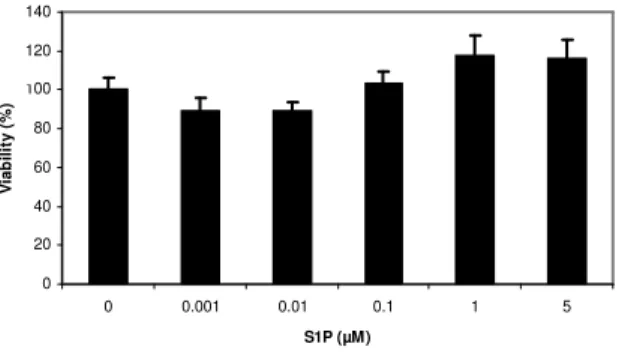
Cell viability after 5 days of culture was evaluated by WST-1 assay in presence of different concentrations of S1P and compared with viability of cells cultured in absence of S1P. As shown in figure 5 no significant difference was observed after treatment with S1P at tested doses compared to untreated cells (P>0.05).
FIG. 5 Cells cultured for 5 days on fibronectin were incubated with the tetrazolium salt WST-1 for 4 hours at 37°C to produce a formazan dye, quantified by measuring the optical density at 450/655 nm. P>0.05. The results are presented as means ±SEM (n =6)
4.2 S1P RECEPTORS EXPRESSION
We initially evaluated the pattern of S1P receptors (S1PRs) expression in human EPC and HUVEC were used as positive control.
Amplified corresponding to mRNA transcripts encoding S1P1-5, were detected by real time PCR
with S1P3 mRNA very low (Fig. 6). The analysis revealed that the relative mRNA abundance in
EPC was S1P2 > S1P5 >S1P4 >S1P1 (Fig.6) In addition S1P2 and S1P5 mRNAs were significantly
higher in EPC when compared to HUVEC where S1P3 was the most expressed. In order to evaluate
the effect of S1P on S1PRs expression, EPC were treated with different concentrations of the lipid for 24h. The results showed that S1P had no significant effect on the expression at tested doses, except for S1P3 with the effect at 100 nM dose. (Fig.7a-e) On the contrary when the time of
0 20 40 60 80 100 120 140 0 0.001 0.01 0.1 1 5 S1P (µM) V ia b il it y ( % )
incubation was taken in account, an significant upregulation was observed at 2h for the S1P3 and
S1P5 receptors, while a significant downregulation for S1P2 at 4 and 6 h was observed when
compared to basal. (Fig.8)
S1P1 EPC S1P1 HU VE C S1P2 EPC S1P2 HU VE C S1P3 EPC S1P3 HU VE C S1P4 EPC S1P4 HU VE C S1P5 EPC S1P5 HU VE C 0.0 0.5 1.0 1.5 2.05 15 25 * * * * * * * m R N A e x p r e ss io n l e v e l
Fig.6 mRNA expression levels of S1P receptors in EPC. Quantitative mRNA analysis was performed by simultaneous
amplification of the target S1P1-5 genes together with the housekeeping genes RPL11 and RPL13. Results are expressed
as fold changes according to the 2-∆∆CT method, using correspondent S1P receptors in HUVEC as calibrator. **p<0.01;
basa l 10 n M 100 nM µµµµM 5 10µµµµM 0.0 0.5 1.0 1.5 2.0 S 1 P 1 m R N A l e v e l (r e la ti v e t o b a sa l) a) ba sal 10 n M 100 nM 5 µµµµM µµµµM 10 0 10 20 30 40 50 *** S 1 P 3 m R N A l e v e l (r e la ti v e t o b a sa l) c) basa l 10 n M 100 nM µµµµM 5 M µµµµ 10 0.0 0.5 1.0 1.5 2.0 S 1 P 4 m R N A l e v e l (r e la ti v e t o b a sa l)
FIG.7 Effects of S1P on S1P receptors transcript abundance. Results of Real Time PCR analyses from pooled data,
plotting the fold increase of the degree of expression levels of S1P1R at the S1P concentration indicated, relative to the
signals obtained in the absence of S1P. Data points are means ± SEM derived from 4 independent experiments.***p<0.001 basa l 10 n M 100 nM 5 µµµµM µµµµM 10 0 1 2 3 4 S 1 P 5 m R N A l e v e l (r e la ti v e t o b a sa l) basa l 10 n M 100 nM 5 µµµµM µµµµM 10 0.0 0.5 1.0 1.5 2.0 2.5 3.0 S 1 P 2 m R N A l e v e l (r e la ti v e t o b a sa l) b) e) d)
basal 2h 4h 6h 8h 0 1 2 3 4
Time fol lowing S1P addition (h)
S 1 P 1 m R N A f o ld i n c r e a se o v e r b a sa l basal 2h 4h 6h 8h 0.0 0.5 1.0 1.5 2.0 2.5 *** ***
Time following S1P addition (h)
S 1 P 2 m R N A f o ld i n c r e a se o v e r b a sa l basal 2h 4h 6h 8h 0 5 10 15 ***
Time following S1P addition (h)
S 1 P 3 m R N A fo ld i n c r e a se o v e r b a sa l basal 2h 4h 6h 8h 0 1 2 3 4 **
Time following S1P addition (h)
S 1 P 5 m R N A f o ld i n c r e a se o v e r b a sa l
FIG.8Results of Real Time PCR analyses from pooled data, plotting the fold increase of the degree of expression levels
of S1PR mRNA at the time after S1P addition as indicated, relative to the signals obtained in the absence of S1P. Data
4.3 EFFECT OF VEGF TREATMENT ON S1P RECEPTORS EXPRESSION
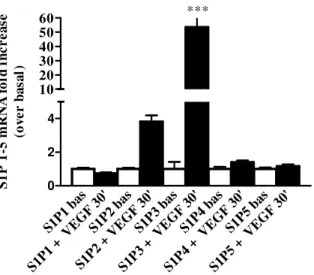
S1P and the polypeptide growth factor vascular endothelial growth factor (VEGF) act independently to modulate angiogenesis. In this study, we explored the cross-talk between S1P and VEGF signaling pathways. When cultured EPC were treated with VEGF (50 ng/ml), the expression of S1P3 mRNA increased by approximately 50-fold compared to basal level. This up-regulation by
VEGF was seen within 30 min of VEGF addition. By contrast, expression of remaining receptors was not altered by VEGF treatment. (Fig. 9)
S1P1 bas S1P1 + V EG F 30 ' S1P2 bas S1P2 + V EG F 30 ' S1P3 bas S1P3 + V EG F 30 ' S1P4 bas S1P4 + V EG F 30 ' S1P5 bas S1P5 + V EG F 30 ' 0 2 4 10 20 30 40 50 60 *** S 1 P 1 -5 m RNA f o ld i n c r e a se (o v e r b a sa l)
FIG. 9 Effect of VEGF on S1P receptors transcript abundance. EPC were treated with VEGF (50 ng/ml) for the time
indicated. The results of analyses from pooled data, plotting the fold increase of the degree of expression levels of S1PR
transcripts relative to the signals obtained in the absence of VEGF. *** p<0.001
Another experiment, in which EPC were treated for varying times with S1P (100 nM) or different doses of S1P up to 24h and then analyzed for expression of VEGF and for the VEGF receptor KDR, revealed no effect of S1P on their expression levels (data not shown).
4.4 EXPRESSION OF S1P3 PROTEIN AFTER STIMULATION WITH S1P OR VEGF To address the S1P induction of also S1P3 receptor and not only the corresponding mRNA, Western
treated EPCs as a band of 42 KDa. As shown in lower while the level was significantly up
2h) or VEGF (50 ng/ml, 30 min)
FIG.10Detection of S1P3 protein in EPC. The lysates obtained from EPC were immunoblotted with anti as described in Materials and methods. The pattern is representative of three independent experiments
4.5 CHEMOTACTIC EFFECT O
Given the fact that S1PRs belong to the same group of seven
receptors (GPRs) as chemokine receptors, we asked whether S1P can act as a for EPC. There was not a
dose-only observed when 100 nM S1P was added to the lower chamber of the migration system. However these results were not
induced migration (P>0.05). The result
VEGF. In addition the synergic effect between VEGF and S1P was not observed When EPC were pre-incubated with JTE
compared to basal EPC whereas the si modify the mobility of EPC. (Fig. 11
treated EPCs as a band of 42 KDa. As shown in Fig.10 the basal level of expression of S1P lower while the level was significantly up-regulated when EPCs were treated with S1P (100 nM, 2h) or VEGF (50 ng/ml, 30 min)
protein in EPC. The lysates obtained from EPC were immunoblotted with anti as described in Materials and methods. The pattern is representative of three independent experiments
CHEMOTACTIC EFFECT OF S1P
Given the fact that S1PRs belong to the same group of seven-transmembrane G protein receptors (GPRs) as chemokine receptors, we asked whether S1P can act as a
-dependent chemotactic effect of S1P on EPC
when 100 nM S1P was added to the lower chamber of the migration system. e not statistically significant when compared to basal or to the VEGF
The result didn’t change when EPC was pre-incubated the synergic effect between VEGF and S1P was not observed
incubated with JTE-013 alone, the migratory capability was increased compared to basal EPC whereas the simultaneous presence of the inhibitor and S1P or VEGF didn’t
Fig. 11c)
the basal level of expression of S1P3 was
regulated when EPCs were treated with S1P (100 nM,
protein in EPC. The lysates obtained from EPC were immunoblotted with anti-S1P3 antibody,
as described in Materials and methods. The pattern is representative of three independent experiments. **p<0.01
transmembrane G protein-coupled direct chemoattractant EPC but a response was when 100 nM S1P was added to the lower chamber of the migration system. statistically significant when compared to basal or to the
VEGF-incubated with S1P or the synergic effect between VEGF and S1P was not observed. (Fig. 11a-b)
013 alone, the migratory capability was increased multaneous presence of the inhibitor and S1P or VEGF didn’t
basa l VE GF S1P 100 nM S1P 1 µM S1P 5 µM 0 500 1000 1500 2000 % m ig r a te d c e ll s a) b) c)
FIG.11 Chemotaxis of EPC in response to S1P. a) EPC were allowed to migrate for 24h to the lower chamber, where various concentrations of S1P were placed. b) EPC preincubated with S1P alone for 2h or 24h, or with S1P and VEGF were allowed to migrate toward the lower chamber where 100nM S1P was placed. c) EPC preincubated with JTE-013 (10 min) alone, in presence or absence of S1P or VEGF were allowed migrate toward the lower chamber where 100nM S1P was placed. Relative migration (% increase, n=4) was calculated by dividing the number of migrated cells (24 h) by the number of spontaneously migrating progenitors. *** p<0.001
4.6 IN VITRO CAPILLARY-LIKE TUBES FORMATION
To address the role of S1P3 receptor on angiogenesis, the effect of S1P on the morphological
differentiation of EPC on Matrigel was investigated. Data showed that neither EPC preincubated with different doses of S1P for 2h nor EPC directly treated on Matrigel with the lipid alone or in presence of a potent angiogenic growth factor as
fVEGF, were unable to form a tube-like structures when S1P was used as chemoattractant. Huvec were used as positive control.(Fig.12)
basa l VE GF 30' S1P 2h S1P 24h S1P 2h + VE GF 30' 0 50000 100000 150000 N u m b e r o f m ig r a te d c e ll s basa l +ini b-S1 P +ini b+S1 P +ini b+V EG F 0 20 40 60 80 *** % o f m ig r a te d c e ll s
Non treated EPC 10 µM S1P-treated EPC
Non treated HUVEC S1P-treated HUVEC
FIG.12S1P-induced EPC tube formation. (Above) S1P-induced tube formation of EPC was assayed in the absence and presence of different concentrations of S1P and a representative image at the higher concentration was reported. (Below) Positive control.