Facoltà di Scienze Matematiche, Fisiche e Naturali
DOTTORATO DI RICERCA IN INFORMATICAPROBABILISTIC MODELLING
OF LAVA FLOW HAZARD
AT MOUNT ETNA
ANNALISA CAPPELLO
A dissertation submitted in partial fulfillment of the requirements for the degree of “Research Doctorate in Computer Science”
COORDINATOR
Prof. Domenico Cantone
ADVISORS
Prof. Giovanni Gallo Dr. Ciro Del Negro
Acknowledgments
During my Ph.D. studies I have been accompanied and supported by many people who gave me helpful advice and practical assistance. I want to thank all of them, including those not mentioned here by name.
First of all, I would like to express my deepest gratitude to my advisors: Dr. Ciro Del Negro for introducing me to the interesting field of volcanic hazard assessment, for his valuable guidance and constant encouragement; Prof. Giovanni Gallo for the interest he has shown in my research, for his blind trust and endless support.
I am indebted to Istituto Nazionale di Geofisica e Vulcanologia for providing generous financial support throughout the Ph.D.
I am grateful to the members of the “Unità Funzionale Gravimetria e Magnetismo” for giving me generous advice and a real opportunity to learn from their experience. In particular, I wish to thank Anna for her intellectual input to my research, and Tania for her notable qualities both in scientific and personal terms.
A sincere thank goes to my flatmates – Elisa, Simona, Chiara and Annalisa – for helping me to get through the difficult times and for all emotional support, fellowship, entertainment and care provided during these three years.
I deeply thank my family and Michele, to whom I dedicate this work. Without their support, everything would have been impossible. Finally, I can never thank Prof. Anile enough for continuing to keep a close watch over me.
Index
Introduction ... 1
Chapter 1 Spatial vent opening probability map ... 9
1.1. Geological and structural data ... 12
Eruptive fissures ... 15
Dikes ... 19
Faults related to eruptive fissures ... 21
1.2. The probabilistic model ... 25
Probability estimations based on kernel technique ... 27
Choice of the smoothing parameter ... 29
Back analysis for weights selection ... 32
Chapter 2
Spatiotemporal probability map of vent opening ... 41
2.1 Etna volcanic eruptions: types, frequencies and structural features ... 43
Periodic flank eruptions in the last four centuries ... 43
Persistent summit activity during the last 110 years ... 47
2.2 Statistical analysis of Etna flank eruptions ... 52
2.3 The space-time probabilistic modeling of flank eruptions 56 2.4 Results ... 62
2.5 Statistical modeling of summit eruptions ... 64
Chapter 3 Characterization of expected eruptions ... 71
3.1 Definition of the expected eruptive classes ... 74
3.2 Occurrence probability for each eruptive class ... 76
Chapter 4 Numerical simulations of lava flow paths ... 79
4.1 The MAGFLOW model ... 80
4.2 Sensitivity analysis of the MAGLOW input parameters .. 85
Methodology ... 86
Effusion rate tests ... 95
4.3 MAGFLOW input parameters for lava flow simulations . 99 Chapter 5 Computation of the hazard map by lava flow invasion ... 103
5.1 Probabilistic modelling of lava flow hazard ... 104
5.2 Results ... 105
5.3 Retrospective validation of the hazard map ... 110
5.4 Discussions ... 113
Chapter 6 Frontiers: the lava flow invasion risk map ... 115
6.1 Methodology for the risk assessment ... 117
The exposed value ... 119
The hazard map by lava flow ... 129
6.2 Results ... 130
Conclusions ... 133
Introduction
Our understanding of the physical processes and parameters involved in evolution of volcanic flows is now advanced, and sophisticated process-oriented numerical models exist that describe eruptive processes well. There are a number of eruptions each year on Earth and many volcanoes are continuously monitored by dedicated observatories. Thus, volcanology is rich in statistical data and statistical modelling is an emergent and rapidly-growing area of interest.
This thesis aims at presenting a groundbreaking methodology for lava flow hazard assessment that represents a challenging topic in modern volcanology. Our purpose is to give a proper statistical treatment of volcanological data to allow key at-risk areas to be rapidly and appropriately identified.
Assessment and management of volcanic hazards are important scientific, economic, and political issues, especially in densely populated areas threatened by volcanoes. Predicting the potentially affected areas of high-risk volcanic phenomena such as lava flows, debris flows or ash dispersion, is essential to support risk mitigation and land planning, in combination with laboratory and field observations.
Mt. Etna, in Sicily (Italy), is one of the most active volcanoes in the world, and during the past 400 years it erupted over sixty times from vents on its flanks, while eruptive activity at its summit has been nearly continuous. Its eruptions are often characterized by lava flows that spread along its flanks. Such eruptions can potentially reach the villages located at medium-low elevations. Even the area where the city of Catania is located was reached in the past by the flows that outpoured from eruptive fractures that opened at lower elevations. In the last century, the village of Mascali was destroyed by lava flows in 1928, while the villages of Fornazzo in 1979 and Randazzo in 1981 were threatened by lava flows. More recently, several tourist facilities have been repeatedly destroyed, with serious damage to the local economy specifically in the 2001 and 2002-2003 eruptions. For these reasons, knowing the probability of a particular site being overrun by a lava flow can be useful to assist emergency managers
during an eruption, to plan crisis response activities and to recognize communities and infrastructure at risk.
A powerful instrument to recognize the probability that a particular area could be affected by a lava flow over a specific time period is represented by the lava flow invasion hazard map.
Several hazard maps have already been proposed for Etna volcano. Some of them are based on a qualitative analysis of historical eruptions [e.g., Andronico and Lodato, 2005; Behncke et al., 2005]; other maps estimate the lava flow invasion hazard by combining the probability of an eruption occurring anywhere on the volcano with the results of lava flow simulations. Wadge et al. [1994] used this approach for Mount Etna, where 380 lava flows were simulated by using both a stochastically chosen vent site and a set of parameters extracted from a library of lava flows erupted between 1763 and 1989. Favalli et al. [2009a; 2011] applied the same approach and obtained hazard maps by simulating the inundation areas for a large number of possible future eruptions using an empirical relationship for the maximum length of lava flows and a topography-based simulation probabilistic code. Crisci et al. [2010] elaborated a lava invasion susceptibility map based on the results of numerical simulations of flows erupted from a grid of 393 hypothetical vents located in the eastern sector of Etna. This grid was successively
extended by Rongo et al. [2011] obtaining a total number of 4290 source locations on the volcanic area.
The aim of my thesis is the development of a new methodology for assessing the lava flow invasion hazard in areas threatened by volcanoes, based on the application of a physics-based model for simulating the lava flow paths.
Recently, at the "Istituto Nazionale di Geofisica e Vulcanologia" (INGV), Section of Catania, significant progress have been made in the hazard assessment through the development of accurate and robust physical-mathematical models able to forecast the spatial and temporal evolution of lava flows. With such simulations, a large number of eruptive scenarios can be explored and used to estimate the extent of the inundation area.
In particular, the methodology for the hazard assessment is based on three main steps: (i) the construction of a spatiotemporal probability map for the future opening of new eruptive vents; (ii) the estimation of the occurrence probabilities associated to classes of expected eruptions; and (iii) the overlapping of a large number of lava flows simulated using the MAGFLOW model. The results from these steps are processed in order to obtain a hazard map showing, for a given area, the probability of being affected by at least one lava flow inundation during the time interval considered.
The preferred scenario for this study is Mt Etna being one of the most intensively monitored volcanoes in the world, thereby offering a lot of input data for the application of the proposed methodology.
Chapter 1 describes the first and maybe the most important step in
forecasting lava flow hazards that is the identification of such areas most susceptible to the spatial opening of new eruptive vents at Etna, named susceptibility map. The quantitative evaluation of the probable location of future eruptions is obtained analyzing the past geological and volcanological history of Etna, introducing a recurrence rate, which defines a possible spatial vent density. However, in order to accurately assess the distribution of future vent locations, the location of past eruptive events, as well as the possible spatial shift in effusive activity, should be considered.
Chapter 2 presents a stochastic model of eruptions that combines the
temporal and spatial analysis to evaluate the spatiotemporal probability of future vent opening on the flanks of Mt. Etna. The basic assumption is that the temporal patterns extracted from the records of past eruptions are useful to predict the future behaviour of a volcano, as well as the regions at high density of volcanic structures are the most probable emission zones of future lava flows. Finally, the results of the analysis of the persistent summit activity during the
last 110 years indicate that the hazard rate for eruptive events is not constant with time, differs for each summit crater of Mt Etna, highlighting a general increase in the eruptive frequency starting from the middle of last century and particularly from 1971, when the South East Crater was born.
In Chapter 3 the approach used to characterize the expected eruption is introduced. Input data, extracted from the new geological map and from the catalogues of historical eruptions of Etna, consist of different kind of records associated to the effusive activity at Mt Etna of the past 400 years, from 1607 to 2006. In particular, information about eruption duration and the lava flow volume are used to perform a statistical analysis, from which six eruptive classes are identified. Hence an occurrence probability is estimated, which represents the probability that one of the considered classes can occur.
Chapter 4 describes the MAGFLOW simulator developed at
INGV-CT. MAGFLOW is a Cellular Automata model based on physical modelling of lava flows, as its evolution function is derived from a steady‐state solution of the Navier‐Stokes equation for Bingham fluids, coupled with a simplified heat transfer model. On Etna, the MAGFLOW has been successfully used to reproduce lava flow paths during effusive eruptions and paroxysmal events, to consider the
impact of hypothetical protective barriers on lava flow paths and to produce the lava flow invasion hazard map at the South-East Crater. This Chapter describes the model and the results of a sensitivity analysis conducted on the physical and rheological parameters that control the evolution function of the automaton. The results confirm the overall reliability of MAGFLOW for lava flow simulations and demonstrate that, for a given composition, discharge rates strongly influence the modelled emplacement.
Chapter 5 depicts the effective construction of the hazard map, which
consists in merging the spatiotemporal probability map, the event probabilities and the areas invaded by the simulated lava flows. The hazard map captures the probability of invasion of lava flows that could potentially inundate specific areas, allowing the rapid assessment of the threat posed by an eruption from a given area and thus representing a support tool for decision makers.
Finally Chapter 6 describes a big challenge in the field of the computational assessment of volcanic risk. The hazard map by lava flow invasion constitutes the starting point for building the risk map, showing the expected value of losses due to the occurrence of an eruption in a particular area at a given time period. The construction of the risk map consists in combining the lava flow invasion hazard
map with the exposed value, which evaluates the goods on the territory that may be affected by an event. The resulting map constitutes a powerful instrument for evaluating the real cost of living in areas near Etna volcano and for overseeing long-term land use and territorial planning.
Chapter 1
Spatial vent opening probability map
Volcanoes usually erupt from the summit area, fed by the central conduit. However, many eruptions occur from vents along the volcano flanks. In some active volcanoes with open central conduit, including Kilauea, Stromboli, Vesuvio (between 1631 and 1944), and Etna, the occurrence of flank eruptions is similar or even more frequent than that of summit eruptions [Holcomb, 1987; Neri andAcocella, 2006; Acocella et al., 2006, 2009; Neri et al., 2011a].
These flank eruptions are usually responsible for effusive activity, which may feed lava flows capable of flowing for long distances over the volcano’s slopes and invading vulnerable areas.
Forecasting the possible location of flank eruptions, in addition to any summit activity, is an important challenge to improve our understanding of volcanic processes so as to achieve successful assessments of lava flow hazards [Newhall, 2000; Sparks, 2003;
Behncke et al., 2005; Crisci et al., 2010; Cappello et al., 2011a; Bonaccorso et al., 2011; Ganci et al., 2012b].
Various approaches, based on statistical or probabilistic analysis of the geology and structure of a volcano and the processes driving magma transfer, were proposed to forecast the location of future eruptive vents. Wadge et al. [1994] evaluated a probability surface of future vent locations on Etna, starting from a classification of its flank eruptions from 1763 to 1989, and applying a non-homogeneous Poisson process. Connor and Hill [1995] proposed three nonhomogeneous Poisson processes to estimate the recurrence rates and the associated probability of volcanic eruption in the Yucca Mountain (Nevada). These models were extended by Martin et al. [2004] in a Bayesian framework applied to the Tohoku volcanic arc (Japan) to combine different geological and geophysical information assuming that new volcanoes will not form far from existing ones. Recently, Marti and Felpeto [2010] proposed a numerical multicriteria evaluation of the spatial probability of hosting a new crater in Tenerife (Canary Island) assigning weights (chosen through
the expert judgment elicitation) to different layers of information obtained with structural criteria (for long-term analysis) and monitoring data (for short-term analysis).
Some of these studies have a common limitation due to the not well-detailed knowledge of the volcano structure, as well as its mechanisms of shallow magma transfer, preventing the formulation of a solid theoretical base for the statistical analysis.
Recently, Neri et al. [2011b] completed a study on the modalities of flank eruptions at Etna of the last ∼2 ky, for which a detailed structural database was collected. These geological records allowed new and broader insights into the dynamics of summit and flank eruptions, defining the main structural parameters and, possibly, the role of the magmatic intrusions in the framework of the volcano flank instability. During the last hundreds of years the central conduit of Etna is always open and active; in addition, lava flows from the summit vents are incapable of threatening the villages located at medium-low altitudes on the flanks of Etna or reaching the Ionian coast where the city of Catania is located [Behncke et al., 2005]. For these reasons, only flank events were analyzed to identify areas where new eruptive vents may open at Etna.
The approach proposed is based on the possibility of accounting for the available geological and structural data, highlighting the main
pathways of magma transfer, as well as an understanding of their mechanisms to derive a susceptibility map containing spatial estimates suggesting the most likely future emission zones. The operative procedure consists in converting different structural datasets (faults, dikes, and eruptive fractures) in separate probability density functions (PDFs), giving each of them a relevance value (weight) with respect to the evaluation of susceptibility, and finally combining all the PDFs and weights in a non-homogeneous Poisson process.
1.1. Geological and structural data
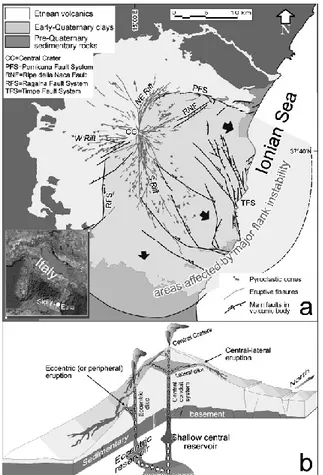
Etna is a basaltic volcano located on the Ionian Coast of Sicily, Italy (Figure 1). Its activity began about 0.5 Ma, when it generated submarine eruptions inside the “Pre-Etnean Gulf”; subsequently, up to ~0.2 Ma, the activity became subaerial producing fissural volcanism, and finally building the present-day central strato-volcano [Corsaro et al., 2002; Branca et al., 2004]. Present activity is manifested by summit eruptions, due to the ascent of magma through the central conduit, and flank eruptions, characterized by vents radiating outward from the summit. Most of flank eruptions originate from the central conduit: here magma rises and subsequently
propagates laterally and downslope, feeding lateral fissures. Less frequently, flank eruptions, named “eccentric” or “peripheral”, are triggered by intrusions directly fed by different reservoirs beneath the volcano (Figure 1b) [Acocella and Neri 2009; Neri et al., 2011a, b].. Etna’s eastern and southern flanks are characterized by slow but continuous seaward displacement (Figure 1) [Solaro et al., 2010]. Northward, the unstable area is delimited by the Pernicana fault system (PFS) [Tibaldi and Groppelli, 2002] and to the South-West by the Ragalna fault system (RFS) [Neri et al., 2007]. Recent InSAR observations reveal differential slip along faults inside the unstable area, delimiting blocks characterized by different velocity of deformation [Solaro et al., 2010]. A close relationship between flank deformation and eruptive activity at Etna is described in Bonaccorso
et al. [2006].
Distinct eruptive cycles have been observed since 1865, with flank eruptions occurring in clusters, separated by periods of quiescence and summit activity [Behncke and Neri, 2003]. Flank eruptions seem to occur more frequently during accelerations of flank movements, facilitated by the opening of fractures close to the summit of the volcano and by increased activity of the main fault systems [Neri et
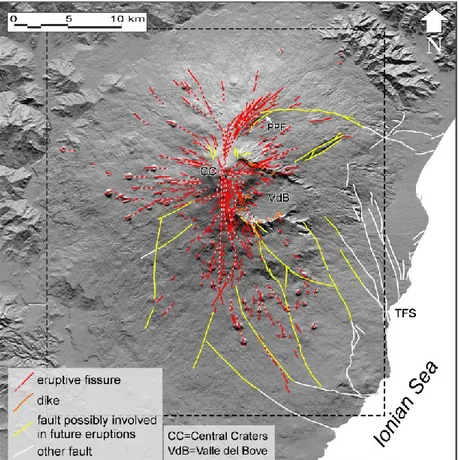
Figure 1 – Structural map of Etna: (a) distribution of eruptive fissures and
pyroclastic cones produced by flank eruptions, fault systems, and the sector affected by flank instability-induced displacement (in light gray). Arrows indicate directions of movement in different portions of the mobile sector. (b) Block diagram (not to scale) illustrating the assumed geometric relationships between the two different, lateral and eccentric magma pathways established during the 2001 and 2002-03 flank eruptions.
Based on field measurements, satellite data and geophysical observations, Neri et al. [2011a] have completed a detailed study of the main structural features of lateral eruptions at Etna, including the frequency and strike of outcropping and buried eruptive fractures active in the past ~2 ky, of the dikes cropping out in the Valle del Bove (VdB), and of the main faults that can potentially be used as pathways for intruding magma. All these geological and structural data were used to construct a georeferenced database containing the mapping of: (1) the outcropping and buried eruptive fissures; (2) the dikes cropping out in the VdB; (3) the main faults.
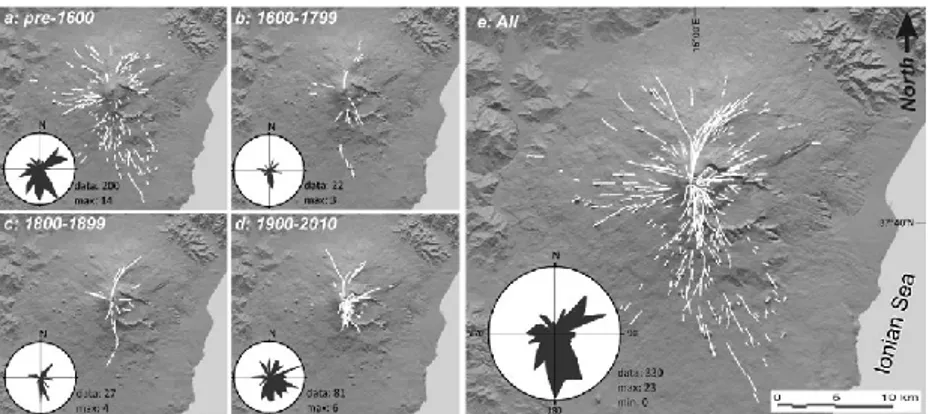
Eruptive fissures
A total amount of 330 eruptive fissures, active during the last ~2 ka (Figures 2 and 3), were analyzed, Their importance lies in the fact that they are dike-fed, and dikes are the most effective means for the rise of magma in the upper crust [Acocella and Neri, 2009]. The way eruptive fissures propagate allowed distinguishing “central-lateral” dikes (propagating laterally from the central conduit) from “peripheral” or “eccentric” dikes, not connected to the central conduit. Since only three eccentric eruptions occurred in the last 110 years [Behncke et al., 2005] and it is difficult to recognize oldest
eccentric eruptions, they have been not distinguished from the other lateral eruptions.
Figure 2 – Historical eruptive fissures of Etna, grouped into periods:
pre-1600 (a), 17th and 18th centuries (b), 19th century (c), 1900-2010 (d), and all fissures plotted together (e). Rose diagrams report the geometric orientation of fissures for each period (redrawn from Neri et al. 2011a).
At higher altitudes (>2000 m), almost all eruptive fissures are radial with respect to the volcano summit. However, these radial fissures cluster along an overall ~N-S trend, that is perpendicular to the direction of regional extension in the area.
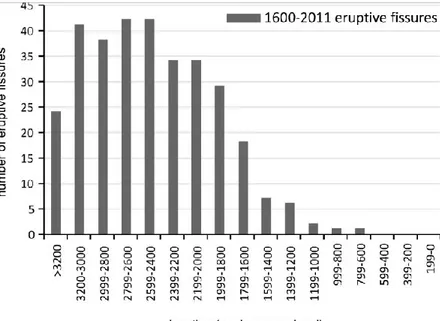
Figure 3 – Distribution of the post-1600 eruptive fissures of Etna, grouped
into different altimetric intervals. About 90% of the fissures are distributed between the summit and 1800 m a.s.l., with ~60% located above 2400 m.
At lower altitudes (<2000 m) a few of the longest fissures (> 5 km) propagating downslope are rotated by 10°-40° with regard to the radial path. The vast majority (~96%) of the entire fissure population is radial, with a negligible population (~4%) slightly deviating from
the radial path. These latter fissures, located at the lower extremities of the North-East and South Rifts, mainly show NE and SE directions, respectively (Figure 2). These directions are consistent with those of the nearby structures controlling the slip of the unstable eastern flank of the volcano [Solaro et al., 2010], so that a relation between eruptive activity and flank instability may be expected at these lower altitudes.
Fissures older than 1600 are uncertain in age and were inserted into the same georeferenced layer (Figure 2a). This group includes 200 fissures, largely with a S-ward (43% of the cases), NE-ward (23%) and W-ward (20.5%) direction.
Sixty-six flank eruptions and 130 fissure systems were identified between 1600 and 2011. Nineteen of these eruptions occurred during the 17th and 18th centuries, generating 22 fissures (Figure 2b; in some cases, the same eruption produced multiple eruptive systems with different orientations). Thirteen flank eruptions formed 27 fissures during the 19th century (Figure 2c). Twenty-seven and six events in the 20th and 21st centuries, respectively, generated 81 fissures (Figure 2d). The total of fissures is oriented with a S-ward (39% of the cases), NE-ward (22%) E-ward (18%), and W-ward (11%) direction, and a minor percentage with a N-S orientation (8%). The frequency distribution of the post-1600 eruptive systems shows
that ~60% are located above 2400 m, 30% crops out in between 1800 m and 2400 m, and the remnant 10% are below 1800 m a.s.l.
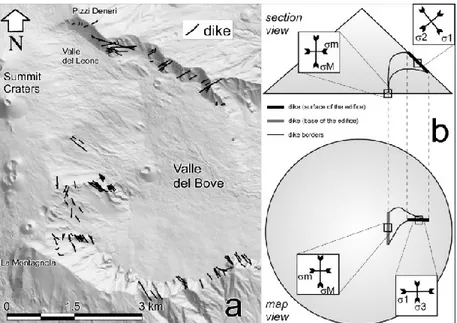
Dikes
Dikes outcropping in VdB, consisting of radial, tangential and oblique systems, were analyzed and integrated in a georeferenced map (Figure 4).
Radial dikes predominate, confirming what has been observed from radial fissures mapped at the surface. However, while at the surface dikes show a systematic radial configuration, at depths of several hundreds of meters, in areas exposed by erosion in VdB, tangential and oblique dikes are also present.
Analogue models show how dikes approaching the flanks of cones [Neri et al., 2008; Acocella et al., 2009], regardless of their initial orientation, reorient to become radial (parallel to the maximum gravitational stress; Figure 4b). This reorientation is a significant process in shallow magma migration and is expected to control also the emplacement of the dike-fed fissures reaching the lower slopes of the volcano.
Figure 4 – Dikes cropping out in VdB following the present-day structural
trends (a). Schematic representation of possible dike reorientation upon approaching the surface of a cone, in map and section views (b). At the base of the cone, the attitude of the dike depends upon the regional stress field, characterized by a maximum (M) and minimum (m) principal stress, as shown by the insets. At the topographic surface, the load of the cone re-orients the dike, in accordance with the three principal gravitational stresses (local 1, 2 and 3), as shown in the insets (after Acocella et al., 2009).
Irrespective of their initial attitude, radial dikes (clustering along a regional ~N-S trend) are expected to feed most of the eruptive activity along the slopes of a composite volcano as Etna. Since only a negligible portion (4%) of the eruptive fissures is not radial, only the dikes with a radial pattern were considered as those capable of transferring magma to the surface, and thus to feed flank eruptions.
Faults related to eruptive fissures
Georeferenced mapping of Etna faults has been carried out, merging field, seismic and magnetotelluric data [Cardaci et al., 1993; Monaco
et al., 2008; Bonforte et al. 2009; Falsaperla et al., 2010; Siniscalchi et al., 2012] with structural data acquired through satellites [Solaro et al., 2010] and geochemical mapping [Siniscalchi et al., 2010; Neri et al., 2011b].
The faults considered were those possibly involved in the eruptive processes, both actively (when they promote upraise and propagation of dikes) and passively (when they are intersected by shallow sub-horizontal or slightly inclined dikes, allowing the magma to rise along their dislocation planes). These faults were highlighted by seismic, tomography, geodetic, and magnetotelluric studies [Cardaci
In particular, two types of faults (yellow lines in Figure 5) were identified: (i) faults departing from the summit area, and frequently serving as pathways for dikes that propagate from the central conduit toward the volcano periphery; they are largely radial and crop out in few cases because of they are often buried by recent eruptive products; (ii) faults that, due to their position, can be intersected by the sub-horizontal propagation of shallow radial dikes and host the passive emplacement of magma (i.e., during the 1928 eruption the lower vents opened at the point where the shallow dike propagating downslope from the central conduit in NE direction intercepted the Ripe della Naca fault plane; Figure 1); because of their distal location and general lack of a radial attitude, these faults are not expected to significantly control the location of eruptive vents. This group also includes faults that, being part of the network of structures characterizing the flank instability, might facilitate upraise and eruption of magma (“passive eruptions”, i.e. not determined simply by magmatic overpressure but mainly by external factors).
For instance, the purely effusive 2004-2005 eruption was triggered by the intersection of the fracture system bordering the sector of the volcano affected by flank instability, with the Southeast Crater plumbing system, leading to the draining of magma [Neri and
Etna’s eastern flank can trigger geodynamically-controlled eruptions [Burton et al., 2005, Neri and Acocella, 2006].
Figure 5 shows that, except for the Timpe Fault System (to the east) and a few minor faults on the W flank, most of the active faults are located along the peripheral continuation of the North-East and South Rifts. Also, almost all the tectonic deformation at the end of the focused North-East Rift seems related to the activity of one main single fault (the Piano Provenzana fault, Figure 5, becoming to the east the Pernicana Fault) [Ruch et al., 2010]; conversely, at the end of the wider S Rift, the deformation is partitioned among different fault systems. Therefore, a correlation appears between the end and width of a Rift and its continuation as a broader or narrower zone of deformation.
Moreover, there is a strong link of these faults at the termination of a rift with the instability of the W and S flanks [Bonforte et al., 2011]. In some cases, there is evidence that fissure eruptions in the summit area become major faults, characterizing the activity of the Etna unstable flank, on the lower slopes (i.e. the NW-SE 1989 fissure system, which connects the summit region of the volcano with the tectonic structures of the lower SE flank) [Falsaperla et al., 2010].
Figure 5 – Main faults and structures of Etna. Dashed red lines indicate dry
(or poorly active) segments of the eruptive fracture systems. Black box indicates the area of ~36×32.5 km containing the 500 m grid spacing of potential vents. TFS = Timpe Fault System; PPF = Piano Provenzana fault.
The more focused deformation controlling flank instability on the N boundary (PFS) matches with the narrower North-East Rift and contrasts the more diffused deformation of the unstable flank to the south, matching with the wider South Rift.
All these features suggest a link between the location and activity of the North-East and South Rifts and the instability of the E and S flanks of the volcano. It is expected that, on the upper slope, gravity and magma emplacement play a common role, feeding each other and justifying the preferred magmatic activity along the North-East and South Rifts.
1.2. The probabilistic model
The qualitative analysis of the structural features of Etna eruptions provides the theoretical background to explain and motivate the prediction of the future vent opening by any probabilistic model:
a) most of the new fissures are expected to be radial and focus above 1600 m;
b) control of the regional tectonics suggests that numerous fissures (~36%) are expected to have an overall ~N-S trend, therefore to develop along the South Rift;
c) a link between flank instability and the occurrence of fissure eruptions along the North-East and South Rifts is expected as result of the gravitational instability of the E and S flanks. Moreover, some reasonable assumptions can be made about the contribution of each structural dataset to construct the susceptibility map. In principle, the most importance is given to recent (post-1600) eruptive fractures, considering them as the current, main expression of the volcano structure related to the eruptions. The contribution of the other datasets is considered less important (pre-1600 eruptive fractures), or considerably less important (faults and dikes), because of their “passive” role in the intrusion processes (faults) and their age (dikes).
To translate these qualitative assumptions into a mathematical language, the spatial distribution of past volcanic structures, such as faults, dikes, and eruptive fractures divided by age, were initially converted into separate PDFs. Successively, through a back analysis, each PDF is assigned a weight, measuring the importance and quality of data. Finally, the PDFs and their relative weights are combined via a weighted summation and modeled in a non-homogeneous Poisson process to obtain the susceptibility map.
Probability estimations based on kernel technique
The structural georeferenced database of Etna includes four datasets: eruptive fissures of the past ~2 ky (separated per age into two datasets, pre-1600 and post-1600 fissures), dikes cropping out in the VdB, and main tectonic structures that can potentially be used as pathways for intruding magma and/or influence the superficial stress field of the volcano, namely faults.
A 500-m spaced grid of potential vents vi(x,y) was defined over an area of 36×32.5 km (Figure 5), and, after proving the divergence of the spatial distribution from randomness for all four datasets with the R-score [Clark and Evans, 1954], a probability of activation (pa) was assigned to each potential vent vi(x,y) through a non-homogeneous Poisson process:
(1)
where ΔxΔy is the dimension of the grid cell (0.25 km2), and Λ(x,y) is the total expected recurrence rate per unit area, calculated by summing the products of the local intensity function λxy for the s-th dataset and its relative weight w(s).
(2) The local intensity function λxy was computed using a kernel function, which is presently the most feasible tool for probabilistic modelling of the long-term future patterns of volcanic events. A kernel function is a PDF centered at each data sample location while exerting an influence in the surrounding region [Diggle, 1985]. It is employed to calculate the probability surface from the location of past, discrete events, in function of distance to nearest-neighbors and a smoothing factor.
Different kernels can be used to describe the spatial density, such as the Cauchy kernel [Martin et al., 2004], the Epanechnikov kernel [Lutz and Gutmann, 1995], the Gaussian kernel [Connor and Hill, 1995], and an elliptical kernel [Kiyosugi et al., 2010]. To assess the spatial probability of future events at Etna, a Gaussian kernel was employed since this model responds well to clustering phenomena commonly observed in volcanic distributions [Weller et al., 2006]. The formula of the Gaussian kernel is given by:
(3)
where N is the number of structures, h is the smoothing factor, and dj represents the minimum distance among those calculated between the potential vent vi(x,y) and each segment constituting the j-th volcanic structure.
The kernel λxy is then normalized so that its integral across the whole area is unity.
Choice of the smoothing parameter
The smoothing parameter h strongly influences the result of the kernel function, controlling how λxy varies with distance from existing volcanic structures. If h is small, the estimated probabilities are high in proximity to existing structures, but low away from the structure. Conversely, a large value of h yields a more uniform estimate of probability distribution across the region. In a volcanic context, the choice of h depends on several factors, including the volcanic field size and degree of clustering.
To select the smoothing parameter, the explicit version of the Least Squares Cross-Validation (LSCV) was used, which is based on minimizing the integrated square error between the true and an estimated distribution [Worton, 1995]:
(4)
being N the number of structures and dij the “minimax distance”, that is the minimum value of the maximum distances between each end point of the i-th structure and all the end points of the j-th volcanic structure.
Varying the value of h in Equation 4, it was found that the smoothing factors minimizing the LSCV(h) score for each dataset are: 1050 m for dikes, 1350 m for faults, 1200 m for pre-1660 fissures, and 1000 m for post-1660 fissures. These h values were then used in Equation 3 to convert each dataset in a PDF (Figure 6).
Figure 6 – PDFs for post-1600 fractures (a), pre-1600 fractures (b), dikes
Back analysis for weights selection
To assign a weight to each PDF, an unbiased procedure was used for the back analysis, which generally aims to determine parameters and/or properties on the basis of a sample of known data. In terms of volcanic susceptibility, it is employed to identify how historical structural data have affected the most recent eruptions.
Taking into account the age of the eruptions, all the structural data were divided in two parts, using the first one as learning set and the second one as testing set.
The year 1981 was fixed as a time barrier, since it determines two statistically meaningful sets (49 fissures for learning and 10 for testing). Moreover, starting from 1981, the volcano activity shows an increasing temporal trend [Salvi et al., 2006; Bebbington, 2007;
Cappello et al., 2011b].
Volcanic structures formed before 1981 were converted in four PDFs and a weight w(s) belonging to the interval [0.05, 0.85] was assigned to each of them to obtain 969 susceptibility maps. Eruptive fissures opened after 1981 (Figure 7) were employed to find the best weights through an exhaustive research of the maximum value reached by the following performance index:
where pi is the probability of the i-th testing fissure, pmax is the highest probability, and N is the number of testing events.
Figure 7 – Eruptive fissures (black lines) related to the ten eruptions (from
1983 to 2008-09) considered as testing dataset to estimate the weight of each PDF. Locations of fissures are superimposed on the susceptibility map evaluated with structural information until 1981.
PI is a percentage representing how the post-1981 fissures are close to the maximum probability. The highest value of PI (~77.3%) was obtained assigning 0.10 to faults, 0.15 to dikes, 0.15 to pre-1600 fissures, and 0.60 to post-1600 fissures. The weighted summation of the PDFs was then inserted into Equation 1 to obtain the quantitative evaluation of the probability of new vents opening in the Etna area.
1.3. Results
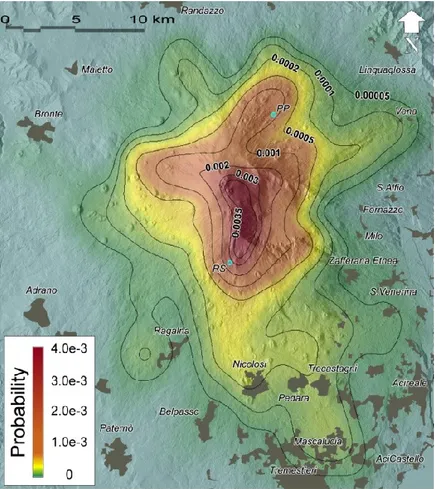
The final susceptibility map is shown in Figure 8.
The zone with the highest probability of new vents opening is centered on the summit crater area and radially around it, to ~2900 m a.s.l. These summit eruptive fractures are related to the dynamic of the central crater area, which is characterized by (i) paroxysmal episodes lasting a few hours; (ii) lava overflows of longer duration (days to months) from the summit craters; and (iii) effusive events from fractures on the external flanks of the summit cones, most of which do not propagate at lower altitudes, due to the superficial nature of the magmatic intrusions.
Figure 8 – Susceptibility map at Etna. The highest probability of new vent
opening regards the N-S aligned area passing through the Summit Craters down to ~2000 m a.s.l. High probabilities are also evident in the NE, W and S Rifts, and the ENE flanks. RS = Rifugio Sapienza; PP = Piano Provenzana.
The distribution of the summit craters, four of them to date, seems to be controlled by two main structural trends, oriented SSW-NNE and NW-SE, respectively: NNE from the Voragine one encounters the North-East Crater (born in 1911), at the northern base of which begins the Northeast Rift, whereas going SE from the Voragine, one encounters the Southeast Crater (born in 1971), which in turn overlooks the upper portion of the South Rift zone.
The position of Bocca Nuova (born in 1968) is less clear; the volcano-tectonic structures within the Bocca Nuova, often oriented N-S and NNW-SSE, seem to point to a dynamic link to the Central Crater, the huge, single summit crater that existed during the first half of the 20th Century, and within which the Voragine and Bocca Nuova have developed.
The four summit craters have sometimes shown contemporaneous eruptive activity, but with different style and eruption rates. This implies a structural independence of the respective feeder conduits in their most superficial portion (<2-3 km from the surface). Most recently, a new pyroclastic cone has started growing on the lower east flank of the South-East Crater, reaching a height of about 150 m 25 paroxysmal episodes in 2011-2012 [Vicari et al., 2011b; Ganci et
Below 2900 m a.s.l., Figure 8 shows a N-S zone of elevated probability of new eruptive vents opening, ~7×2.5 km wide, extending from the summit area to ~1700 m altitude on the south flank. This is the uppermost portion of the South Rift, which is the strip of terrain along the western rim of the VdB.
At lower altitudes, this rift area opens fanwise toward SSE and SE, down to rather low altitude (minimum altitude ~400 m), coinciding with the most densely populated area of the volcano.
In the SE area, several NW-SE pre-1600 fissures and NW-SE faults crop out influenced the extension of the susceptible zone at lower altitude, although the low weight assigned by the performance index elaboration.
A second area (~8×2 km wide) with a high probability of new vents forming extends from the summit toward N-NE (downward to ~1000 m a.s.l.). It includes the North-East Rift, characterized by numerous eruptive fissures and pyroclastic cones. It has been active for at least 15-20 ky; in the recent past, the eruption frequency here was lower than on the S flank). Yet this rift plays a fundamental role in the structural setting of the volcano, because it represents the NW boundary of the sliding eastern flank [Ruch et al., 2010].
The North-East Rift indeed shows faults and fractures characterized by predominantly extensional kinematics, which pass into left-lateral
transtensive kinematics in its lower portion, where it is linked to the transtensive left-lateral Pernicana fault system, the northern margin of the zone affected by flank instability.
Along the complex structural North-East Rift – PFS system, which is ~3-4 km deep [Ruch et al., 2010], one can imagine the ascent of dikes and magmatic fluids [Siniscalchi et al., 2012], which use the tectonic discontinuities as pathways to the surface, while facilitating the movement of one block against the other due to a “lubrificating” action on the fault planes. Outcropping and buried dikes and pyroclastic cones, deformed by the tectonic activity, indeed occur along the PFS around 1450 m altitude [Tibaldi and Groppelli, 2002], testifying to the existence of this volcano-tectonic setting. Structurally and morphologically, the North-East Rift is linked to the North-East Crater. During the 1960s to 1980s, this crater produced vast and thick lava fields, which bury much of the North-East Rift down to ~2500 m altitude.
Yet another zone of elevated probability of new vents opening extends from the summit area toward ENE. This is the East-North-East Rift [Ruch et al., 2010], whose lower portion passes into the Ripa della Naca faults (~1000 m altitude), and includes the Valle del Leone and a portion of the N wall of the VdB, as well as a number of parasitic cones. Both the eruptive fissures and dikes outcropping in
this area were conditioned, during their propagation, by the presence of the N wall of the VdB, due to their shallow paths (from a few tens to a few hundreds of meters of depth). In some cases, the intrusions halted at the base of the VdB wall (as in 1989 and 2001), whereas on other occasions the fractures cut through the wall, first changing direction and adapting the trend of the wall itself, and then resuming their original direction (toward NE and ENE), thus propagating outside the VdB (as in 1971 and 1979).
Analyzing the geometric properties and structure of the dikes outcropping in the area, an identical evolution of the past eruptive activity can be inferred. The kinematic indicators present in the magmatic intrusive bodies (that is, the form and arrangement of bubbles, flow structures, morphology of the imprint of glassy margins on the host rocks) clearly indicate a subhorizontal (0-10°) or slightly inclined (10°-30°) mode of propagation of magma within the fractures [Acocella et al., 2009].
Finally, another area of elevated probability of new vents opening extends from the summit toward W and WSW, downward to ~1700-1800 m a.s.l. This is the most elevated portion of the West Rift, where flank cones reach a minimum altitude of ~1300 m and most recent eruptive manifestation dates back to 1974.
Compared to the other rift zones, some geological data (significant documented explosive activity) and instrumental evidence (seismic swarms preceding some eruptions) suggest that some West Rift eruptions might have been fed directly from a deep magma reservoir, bypassing the central conduit of the volcano.
Chapter 2
Spatiotemporal probability map of
vent opening
The methodology described in Chapter 1 uses only the spatial distribution of geological and structural data to estimate the probability of future events at Mount Etna. However, in order to accurately assess the distribution of future vent locations, two aspects should be considered simultaneously: the spatial density (number of volcanic events per unit area) and recurrence rates (number of volcanic events per unit time).
In other words, the probabilistic modelling of future vent opening should consider simultaneously the spatial and temporal characteristics of volcanic activity.
Different approaches have been proposed to evaluate the probability of vent opening at Etna volcano by analyzing the distribution of spatial location of flank eruptions and their temporal frequency in a separate way.
For the spatial distribution, the density of vents has been calculated to identify areas where the highest concentration is located, which correspond to the zones known as NE, S and W Rifts, respectively [Guest and Murray, 1979; Acocella and Neri, 2003; Salvi et al., 2006; Crisci et al., 2010; Rongo et al., 2011; Neri et al., 2011a;
Cappello et al., 2012].
For the temporal distribution of flank eruptions, Mulargia et al. [1985] concluded that Etna's lateral eruptions follow a stationary Poisson process with a constant intensity. Salvi et al. [2006] confuted this result, proving that flank eruptions at Etna do not follow a simple Poisson distribution, but are more likely represented by a non-homogeneous Poisson process with power law intensity. Recently,
Bebbington [2007] applied the Hidden Markov Models (HMM) to
volcanic occurrences to identify the most consistent (hidden) activity state of the volcano with the observations and to forecast the next eruptions. However, the stationary distribution assumed by HMM cannot properly model the increasing trend of flank eruptions observed in the last 40 years at Etna [Allard et al., 2006]. Finally, the
temporal analysis performed by Smethurst et al. [2009] revealed that flank eruptions follow a non-homogeneous Poisson process with a piecewise intensity increasing nearly linearly since the mid-1900s. This Chapter describes a methodology to evaluate the spatiotemporal probability of future vent opening at Mt Etna which combines both the temporal and spatial analysis of flank eruptions. The basic assumption is that the temporal patterns extracted from the records of past eruptions are useful to predict the future behaviour of a volcano, as well as the regions at high density of volcanic structures are the most probable emission zones of future lava flows.
2.1 Etna volcanic eruptions: types, frequencies and structural features
Periodic flank eruptions in the last four centuries
Before the beginning of the 17th century, the catalogue of Etna flank eruptions is fragmentary and incomplete, but since 1610 an almost complete account of eruptions is available, which has been summarized by Sartorius von Waltershausen [1880], Imbo [1928, 1965] and more recently by Wadge [1977].
The eruptive behavior of Etna in the last 400 years is undoubtedly irregular, with important fluctuations in eruption frequencies, type of eruptions and output rates, both in the long-terms (centuries) and short-terms (decades) [Hughes et al., 1990; Behncke and Neri, 2003;
Allard et al., 2006].
The period spanning from 1600 to 1669 was characterized by very high output rates (mean of ~1.4 m3s-1) [Behncke and Neri, 2003] and represents the culminating stage of an earlier long cycle lasted several centuries [Tanguy et al., 2003; Clocchiatti et al., 2004]. Since 1669, a new long cycle has started, which is still continuing today. This new long cycle is made up of a first phase (up to mid-1700) characterized by very few, low-fed eruptions (mean effusion rate less than 0.03 m3s-1), occurred mostly at the volcano summit. Then, a second phase (up to 1865) marked an increase in the mean output rate (~0.2 m3s-1) and the resumption of a frequent flank eruptive activity (16 events). Flank eruptions and erupted volumes further increased in the third phase (mean output ~0.47 m3s-1), up to the present [Wadge et al., 1975; Guest and Murray, 1979; Allard et
al., 2006]. Moreover, short-term eruptive cycles have been observed
since 1865 to date, a period during which flank eruptions have occurred in clusters separated by intervals of quiescence and summit activity [Behncke and Neri, 2003]. Also these short cycles consist of
three phases: (i) a period of eruptive quiescence lasting less than 3.5 years, (ii) a period of continuous summit activity lasting 6-16 years, and finally (iii) a period marked by flank eruptions alternating with summit activity, lasting 9-22 years. Each short cycle ends with a highly-fed and/or voluminous flank eruption.
An evident increase in the lava output and frequency of eruptions began in 1950, although the behavior remained cyclic [Allard et al., 2006]. Effectively, more than 1.6 km3 of volume of products have been erupted starting from 1950 at an average rate higher than 0.83 m3s-1. The last short eruptive cycle began after the 1991-1993 flank eruption (~235 x 106 m3 volume of erupted products), evolving into a couple of years of quiescence, six years of gradually more frequent summit activity, followed by a series of flank (5) and summit (33) eruptions [Behncke et al., 2005; Allard et al., 2006; Neri et al., 2009, 2011a; Vicari et al., 2011b].
Based on numerous and detailed studies conducted on the structural features of flank eruptions at Etna [Neri et al., 2011a, and references therein], the eruptive fissure systems occurring between 1610 and 2012 (Figure 2b-d) were examined. Specifically, a total of 61 flank eruptions were analyzed, which formed 130 segments of eruptive fissures.
During the 17th and 18th centuries, the eruptions generated 22 fissures; 27 eruptive fissures opened during the 19th century, and finally 81 fissures formed during the 20th and 21st centuries. The increasing number of eruptive fissures over time confirms the general increase in frequency of the eruptions.
The length of eruptive systems ranged from a few hundred meters to about 11500 m, with an average of ~3000 meters. About 60% of the eruptive fissures were located above 2400 m altitude; they were mainly radial with respect to the volcano summit, even if most follow a ~N-S trend, namely perpendicular to the direction of regional extension in the area of Etna volcano [McGuire and Pullen, 1989;
Lanzafame et al., 1996; Monaco and Tortorici, 2000; Solaro et al.,
2010].
At lower altitude (below 2400 m), the eruptive fissures were clustered in NE, ENE, SE, S and W alignments, following the rift zones. The minimum altitude (~650 m above sea level) of an eruptive vent was reached during the 1669 eruption.
In many cases eruptive fissures do not erupt along their entire lengths (except at the very beginnings of the event); during the propagation of the fissure, the eruptive activity migrates downward and the main vents are commonly located on the lower portions of the fissure itself.
Persistent summit activity during the last 110 years
The summit area of Mt Etna has frequently undergone major morphological changes due to its persistent eruptive activity, both effusive and explosive [Neri et al., 2008].
Four summit craters are active today: the Voragine, the NE Crater, the Bocca Nuova, and the SE Crater (Figure 9). Their eruptive activity consists of: (i) continuous degassing; (ii) mild Strombolian explosions accompanied by slow and poorly-fed (~0.1-1 m3 s-1) lava effusion from vents inside or on the flanks of the summit craters; and (iii) highly-fed paroxysmal (up to 300-400 m3 s-1) eruptions, characterized by lava fountains, lava overflows and tephra-rich eruption columns several kilometers high.
This morphological conformation has not always been as it is today. Just 100 years ago there was only one summit crater: the Central Crater (CC) [Guest, 1973]. Indeed, during 17th - 18th century, the summit of the volcano had a single deep and wide crater depression, which was formed because of the collapse of the summit area triggered by the huge 1669 eruption [Corsaro et al., 1996]. Later on, during 19th - 20th century, the volcanic activity resumed within this crater, causing its gradual filling.
Figure 9 –Topographic map of Etna's summit area carried out in 2007 (from
Neri et al., 2008, modified). Equidistance = 10 m. Dashed black line
indicates the rim of the former Central Crater mapped in 1932 (Istituto Geografico Militare, 1934). Light grey numbers indicate the age of the main lava flows in the period 1996-2007.
During the almost persistent activity of the Central Crater (CC), the NE Crater (NEC) formed in 1911. At the beginning it was a pit located ~3160m above sea level (a.s.l.) on the northern slope of the CC cone [Guest, 1973] and characterized mainly by Strombolian activity. NEC became very active in the second half of the last century, producing numerous and occasionally violent and long eruptions (especially in 1947-1960, 1974-1986, and 1995-1998), up to becoming a major pyroclastic cone as well as the highest point of the volcano (3329.7 m a.s.l. in 2007; Neri et al., 2008).
Starting from the middle of the last century, the CC changed its internal morphology frequently due to the intracrater volcanic activity alternating with subsidence and collapse phenomena. One of these events led to the creation of the Voragine (VOR; also known as “The Chasm”) in 1945. VOR formed in the north-eastern portion of the fairly flat floor of CC [Guest, 1973]. Major eruptive phases occurred at CC in 1960-1964, which culminated in the opening of eruptive fissures, several paroxysmal events accompanied by huge tephra emissions, continuous lava overflows, and the growth of some pyroclastic intracrater cones [Behncke et al., 2004].
Four years later, in 1968, the Bocca Nuova (BN) was formed still inside the CC, a few tens of meters west of the VOR [Behncke et al., 2003]. The BN widens and deepens gradually, always within the CC,
becoming even larger than the VOR. Later, in 1998, the Strombolian activity resumed at the crater floor, generating several lava fountaining episodes (in 1999) that filled the crater and triggered numerous lava overflows [Behncke et al., 2003; Calvari et al., 2003]. After the 2001 flank eruption, BN and VOR were involved in subsidence, sporadic phreato-magmatic explosions and progressively they collapsed, becoming almost a single crater depression whose edges are, in part, modeled on those of the CC. [Giammanco et al., 2007]. Therefore, it is evident that VOR and BN are internal, minor vents of the CC itself (see dashed black line in Figure 9).
The SE Crater (SEC) formed during the 1971 eruption. Since its origin, SEC has been the most active among the summit craters of the volcano. At first, it was a degassing pit located close to the southeast base of the CC cone, at ~3070 m a.s.l. [Behncke et al., 2006]. During the first twenty-five years of activity, SEC erupted quite frequently and built a cone about 100 m high. The cone has grown dramatically in the periods 1996-2001 and 2006-2012, through over 143 paroxysmal episodes and effusive eruptions. Today it has reached an altitude of ~3300 m, forming also a huge new pyroclastic cone on its eastern slope [Alparone et al., 2005; Behncke et al., 2006; Neri et al., 2008; Vicari et al., 2011b; Ganci et al., 2012a].
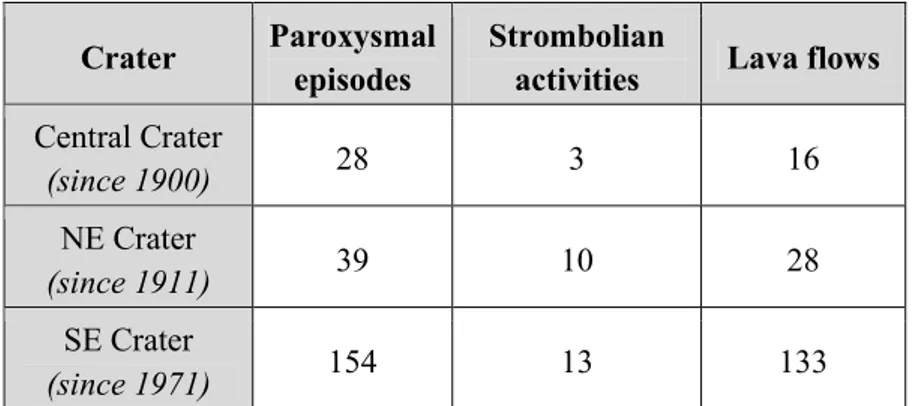
The progressive increase in eruptive activity characterizing the Mt Etna summit area during the last 110 years can be readily seen in Table 1. But what is most striking is the fact that the appearance of the SEC marks a real change in the eruptive frequency. Over the past 41 years, the SEC has produced a number of eruptive events that correspond to more than double the events produced jointly by the CC and NEC in 110 years.
Crater Paroxysmal episodes
Strombolian
activities Lava flows
Central Crater (since 1900) 28 3 16 NE Crater (since 1911) 39 10 28 SE Crater (since 1971) 154 13 133
Table 1 – Number and type of eruptions per each summit crater. The
Central Crater includes the activity of Voragine and Bocca Nuova. The last column (Lava flows) indicates the number of paroxysmal and strombolian events that were also characterized by (i) rheomorphic lavas formed during highly-fed explosive activity; (ii) lava overflows emerging from one of the summit crater; and (iii) lavas erupted from short fissures opened along the external slope of the summit cone (above ~3000 m a.s.l.).
Never in the recent past, has Mt Etna been so active; to find similar levels of activity, we would probably have to go back several hundred years, when the historical chronicles, however, were certainly not as accurate as today.
2.2 Statistical analysis of Etna flank eruptions
Over the last four centuries, the completeness and accuracy of historical data at Mt Etna provides a robust basis for conducting an in-deep statistical analysis to detect spatial and temporal patterns in the distribution of past events, and hence to formulate the appropriate spatiotemporal probabilistic model for the future flank eruptions. The spatial pattern of eruptive fissures was analyzed using the Clark
and Evans [1954] index R that measures the ratio between the
expected nearest-neighbor distances under complete spatial randomness and the observed mean nearest-neighbor distances:
(6)
where dmin(i) is the distance between each eruptive fissure and its nearest neighbor, A is the area of the region, and N is the number of structures considered in the calculation.
In order to consider the eruptive fissures in full, dmin is calculated as the “minimax distance”, that is the minimum value of the maximum distances between each end point of the i-th eruptive fissure and all the end points of the j-th eruptive fissure [Cappello et al., 2012].
R values less than 1 highlight a cluster tendency, since the observed
mean distance between neighboring fissures is less than that expected in random patterns. R equal to 1 points out that casualness is present among data, while R greater than 1 indicates uniformity. The theoretical maximum of R is 2.149 occurring when data are maximally dispersed. With historical data at Etna, an R value equal to 0.027 was obtained, which proves the non-homogeneous spatial distribution of eruptive fissures.
In addition to the spatial analysis, the historical records during the last four centuries were examined to detect the presence of trends or patterns characterizing the temporal distribution of eruption occurrences. It was calculated the cumulative number of eruptive fissure systems linked to flank eruptions over time and the inter-event periods, i.e. the repose times between subsequent eruptions (Figure 10). Both distributions underline the temporal non-stationarity of eruption occurrences, since a growing trend is evident for the number of flank eruptions, while a mainly decreasing tendency stands out for repose times during the last 30 years. This highlights that volcanic
eruptions occurred with a higher frequency in this last period than in the previous ~370 years of activity.
Figure 10 - Cumulative number of eruptive fissure systems opened since
1610 (blue curve). Black dots indicate the repose times in years between the formations of successive eruptive fissures. The straight green line highlights the decreasing trend of repose times, i.e. eruptions occurring more frequently in recent years than in the past centuries.
To evaluate the possible shift over time of the location of the eruptive activity, the centroids of the eruptive fractures in the last 400 years were also calculated, grouping them every 50 years (Figure 11).
Figure 11 - Centroids of the eruptive fissures opened in the last 400 years,
grouped in short periods of 50 years. A spatial shift is evident over time in the location of the eruptive activity, which becomes progressively closer to the summit of the volcano, on the high eastern side. Coordinates are in UTM projection, zone 33N.
The result indicates that the increasing trend in volcanic activity is accompanied by a migration of the centroids that became progressively closer to the summit of the volcano, on the high eastern side. This fact is testified by the rapid morpho-structural evolution of
the summit area during the last decades: the former Central Crater (the single summit crater existing up to early 1900) was modified by the growth of the NE Crater (formed in 1911 on the northern side), the Bocca Nuova (formed in 1968 inside the Central Crater and close to the its western rim) and the SE Crater (formed in 1971 on the southeastern side), which represent the connections of the three main volcanic rifts in the summit area [Neri et al., 2011].
The in-deep analysis conducted on flank eruptions in the last four centuries demonstrates the spatial non-homogeneity and the temporal non-stationarity of flank activity, hence suggesting that the most appropriate space-time probabilistic model for the future flank eruptions at Etna volcano is a non-homogenous Poisson process (NHPP) with a time-varying intensity function.
2.3 The space-time probabilistic modeling of flank eruptions
The first and maybe most important step in forecasting lava flow hazards involves the construction of a spatiotemporal probability map for the identification of the most probable emission zones of future lava flows.
In order to accurately assess the distribution of future vent opening, the methodology for building the probability map should include the
analysis of the spatial location of past eruptive events, as well as the eruption frequency within a time window. At Etna, the probabilistic modeling was based on the locations of the pre-1600 eruptive fissures, dykes and faults (for which an exact dating cannot be established), and on the spatial positioning and temporal sequencing of the post-1600 flank eruptions occurred at Etna (that are accurately documented and well-dated).
Over the same grid of potential vents vi(x,y)defined in Figure 5, separate PDFs were calculated using the formula of the Gaussian kernel:
(7)
where N is the total number of volcanic structure considered in the calculation, di is the distance between the potential vent vi(x,y) and the i-th volcanic structure, ti is the elapsed time since the eruption at the i-th eruptive fissure, h is the smoothing factor, and k is a constant. The smoothing factor h determines the intensity of influence of each volcanic structure, giving them high emphasis (for small values of h) or yielding a more uniform distribution across the area (for large values of h). The h smoothing factors used in Equation 7 are the same
obtained with the LSCV: 1000 m for the post-1600 fissures, 1200 m for the pre-1600 fissures, 1050 m for the dykes and 1350 m for the faults [Cappello et al., 2012].
The constant k serves the purpose of assigning larger weights to more recent events with respect to older ones. For the pre-1600 eruptive fissures, dykes and faults, k has the value of zero since an exact date
ti for these ancient volcanic structures cannot be established. For the post-1600 fissures, the best fit for the constant k was estimated using the back analysis approach described in Paragraph 1.2 to quantify how the distribution of the oldest eruptive fissures has affected the formation of the most recent ones.
Specifically, the best fit for the constant k was retrieved by evaluating the mean square error of each probability forecast with the Brier score [Brier, 1950]:
(8)
where pi is the forecast probability of each grid cell and oi indicates whether an eruptive fissure has been formed in that cell after 1981 (oi = 1 if at least a fissure has occurred and oi = 0 if not).