UNIVERSITY OF CATANIA
DEPARTMENT OF CHEMICAL SCIENCES
INTERNATIONAL PhD IN CHEMICAL SCIENCES – XXXI CYCLE
Antonella Di Francesco
Proteomic analysis of the metabolic fractions
in modern and old wheat genotypes: a
qualitative and quantitative comparison
PhD Thesis
Tutor: Prof.ssa Rosaria Saletti
PhD Coordinator: Prof. Salvatore Sortino
III
Abstract
Wheat, due to its adaptability to a wide range of environments and for the unique functional properties of its flour, represents the most widely grown, processed, and consumed cereal by humankind of temperate regions. Most of the modern wheat genotypes are derived from old wheats and have appreciable properties in terms of grain yield. Wheat is also the causing factors of many adverse reactions, such as celiac disease, allergies and non-celiac wheat sensitivity (NCWS) in susceptible people. This has led to an increasing interest for the old wheat genotypes which are generally considered better tolerated than the modern ones, but without any scientific evidence. The aim of the present work is the qualitative and quantitative comparison by a proteomic approach of the metabolic protein fractions extracted from the mature kernel of two old Sicilian durum wheat landraces (Russello and Timilia reste bianche), and Simeto, an improved durum wheat variety, widely spread in Italy and other Mediterranean countries, chosen as representative of the most widely commercial cultivars. The qualitative comparison of the protein composition revealed a remarkable similarity between old and modern cultivar. The quantitative evaluation of the identified proteins shows that some proteins are differentially expressed in old and modern varieties.
IV
TABLE OF CONTENTS
LIST OF ABBREVIATIONS ... 1
1.INTRODUCTION... 3
1.1CLASSIFICATION OF WHEAT PROTEINS ... 7
2. PROTEOMIC ANALYSIS ... 9
2.2HIGH PERFORMANCE LIQUID CHROMATOGRAPHY (HPLC) ...10
2.3MASS SPECTROMETRY ...13
2.3.1 Ion sources ...14
2.3.2 Mass analyzer ...17
2.4BIOINFORMATIC SEARCH ...20
2.4.1 Peaks 8.5 (Bioinformatics Solutions Inc.) ...20
3.LABEL-FREE PROTEOMIC ANALYSIS ...21
4. AIM OF WORK ... 23
5. MATERIAL AND METHODS ... 24
5.1MATERIALS ...24
5.2EXTRACTION OF THE METABOLIC AND CM-LIKE PROTEIN FRACTIONS FOR THE QUALITATIVE COMPARISON...24
5.3IN-SOLUTION DIGESTION OF METABOLIC AND CM-LIKE PROTEINS ...25
5.3EXTRACTION OF THE METABOLIC PROTEINS FOR THE QUANTITATIVE COMPARISON ...25
5.4IN-SOLUTION DIGESTION OF THE METABOLIC PROTEINS...25
5.5LIQUID CHROMATOGRAPHY AND TANDEM MASS SPECTROMETRY (LC–MS/MS) ANALYSIS ...26
5.6DATABASE SEARCH ...27
6. RESULTS AND DISCUSSION ... 28
6.1QUALITATIVE COMPARISON ...28
6.1.2 Qualitative comparison of the metabolic protein fractions of Timilia reste bianche and Simeto ...33
6.1.2 Qualitative comparison of the metabolic protein fractions of Timilia reste bianche and Russello ...35
6.1.3 Qualitative analysis of CM-like protein fractions of old and modern varieties ...37
V
6.2QUANTITATIVE COMPARISON ...38
6.2.1 Quantitative comparison of the metabolic protein fractions between old cultivar and Simeto ... 396.2.2 Quantitative comparison of the metabolic protein fractions between old cultivar ...47
7. A MANUALLY CURATED DATABASE OF METABOLIC PROTEINS FROM TRITICUM AESTIVUM ... 50
7.1INTRODUCTION ...50
7.2MATERIALS AND METHOD ...51
7.2.1 Identification of wheat seed protein sequences accession in UniProt ..51
7.2.2 Database construction and curation ...51
7.2.3 Phylogenetic analysis ...52
7.3RESULT AND DISCUSSION ...53
7.3.1 Database development and characterization ...53
8. CONCLUSION ... 55 9. LIST OF FIGURES ... 57 10. LIST OF TABLES ... 59 11. LIST OF PUBLICATIONS... 61 12. CONFERENCE CONTRIBUTIONS ... 62 13. ACKNOWLEDGMENTS ... 64 14. BIBLIOGRAPHY ... 65
1
LIST OF ABBREVIATIONS
CD NCWS cv IgE CM LTP Serpin S-rich S-poor HMW MALDI TOF RP-HPLC nESI EI Q IT CI CID HCD ETD LC Q-OT-qIT AUC Celiac DiseaseNon-Celiac Wheat Sensitivity cultivar
Immunoglobulin E
Chloroform/Methanol-soluble Lipid Transfer Protein
Serine Proteinase Inhibitor Sulfur-rich
Sulfur-poor
High Molecular Weight
Matrix-Assisted Laser Desorption/Ionization Time Of Flight
Reverse Phase-High Performance Liquid Chromatography nano ElettroSpray Ionization
Electron Impact Quadrupole Ion Trap
Chemical Ionization
Collision Induced Dissociation High-energy Collision Dissociation Electron-transfer dissociation Liquid Chromatography Orbitrap Fusion Tribrid Area Under the Curve
2 MuDPIT PSM Pfam FDR BLAST GO PANTHER DTT IAA FA ACN
Multidimensional Protein Identification Technology Peptide spectral matches
Protein Family False Discovery Rate
Basic Local Aligment Search Tool Gene Ontology
Protein ANalysis THrough Evolutionary Relationship dithiothreitol
iodoacetamide Formic Acid Acetonitrile
3
1.Introduction
Wheat is one of the most important cereal for the humankind. In 2016, the global production of wheat exceeded 749 million tonnes, making it the second most-cropped cereal after maize.1 Wheat contributes between 20%
and 50% of the total calories in countries where this crop is cultivated, USA, China, Russia, India, Pakistan, Canada, Argentina, Australia and some countries of European Union, but the consumption of wheat is also increasing in countries where there aren’t specific climate conditions, such as Sub-Saharan Africa, and particularly in countries undergoing urbanization.2 Wheat is not only a source of calories but it also contains
essential amino acids, minerals, vitamins and bioactive compounds for the human diet.2 The importance of wheat depends on the possibility to
transform its seeds into flour, semolina, etc., which give origin to a lot of food products and make substantial contributions to the dietary intake of energy and consequent impact on human health.3 All types of wheat are
included in the grass Poaceae family and in particularly they belong to the genus Triticum.3 The most common varieties of this crop are Triticum
aestivum (“common”, “bread” or “soft” wheat) and T. durum (durum wheat).1 The first one is an hexaploid species (AABBDD) whereas the second
4
Figure 1. Phylogeny of domesticated species of the common wheat varieties4
In particularly the durum wheat is largely cultivated in the Mediterranean areas and predominantly used for making pasta. The main components of the wheat kernel are carbohydrates (70 – 80% of dehydrate flour), lipids (1.5 – 2.5% of dehydrate flour) and proteins (8 – 18% of dehydrate flour).
Wheat is also the causing factors of many adverse reactions, such as celiac disease (CD), allergies and non-celiac wheat sensitivity (NCWS) in susceptible people. At the present two main groups of wheat allergens are known: gliadin/glutenin insoluble proteins) and albumin/globulin (salt-soluble proteins) fractions. The first fraction is caused of celiac disease, a condition that results in a chronic inflammatory of the gastrointestinal tract, which affects the small intestine, causing atrophy of the absorbent apparatus and malabsorption of nutrients.5 Nowadays, the only treatment
available for this condition is a lifelong diet gluten-free. On the other hand, albumins and globulins are cause of wheat allergies, that is the result of immunological reactions, mediated by allergen-specific immunoglobulin E (IgE). A typical example of wheat allergy is the Baker’s asthma, a typical condition in which water soluble flour proteins bond to serum IgE as a result of inhalation of flour particles.3 In particularly, the most important allergens
5
are the α-amylase/trypsin inhibitor subunits, a class of hydrolytic enzymes, which catalyze the cleavage of the α-1,4 glycosidic linkage, and are widely diffused in nature. The plant α-amylase inhibitors exist in different polypeptides such as monomers of about 12 kDa, homodimers of 24 kDa and heterotetramers of about 60 kDa. The wheat tetrameric inhibitors are constituted by three different subunits belonging to the class of the CM (Chloroform/Methanol-soluble) proteins, which typically result in 13–15 kDa polypeptides under dissociating conditions.6 Recently, other several proteins
have been linked to wheat allergy; in particular, lipid transfer protein (LTP), peroxidase, thioredoxin, serine proteinase inhibitor (serpin), thaumatin-like protein, acyl-CoA oxidase, fructosebisphosphate aldolase, triosephosphate isomerase, and glycerinaldehyde-3-phosphate dehydrogenase.
In conclusion, NCWS shows similar symptoms to CD and wheat allergy, but without the serologic or histologic evidence of CD.7 It has also been
defined as a variety of immunological, morphological, or symptomatic manifestations that is possible to observe after the ingestion of gluten in individuals in whom CD has been excluded.7 Nowadays, there isn’t a specific
test to reveal the diagnosis of NCWS; the diagnosis of this condition is most the time achieved by elimination: it is not CD and it is not wheat allergy.8
There are two important differences from people suffering of CD and people with NCWS. NCWS patients have the possibility to reintroduce the gluten in their diet and do not appear to be at risk for nutritional deficiencies, whereas CD patients have to follow a lifelong gluten-free diet.7
Beside to people who need to follow a gluten-free diet for health reasons, a new segment of consumers who consume gluten-free products as a lifestyle choice has arisen. Currently, a consistent percentage of the general population considers oneself to be suffering from problems caused by wheat and/or gluten ingestion, even if they are not celiac. This has led to an increasing interest for the old wheat genotypes, but the nutritional comparison between ancient and modern wheat varieties is still controversial. In literature, it is reported that the health benefit of ancient grains is not related to a single compound but to a general composition of these varieties.1 In particular, ancient wheat species suggest that they could
present a healthier and a better nutritional profile than modern wheats, because rich in vitamins, minerals and nutraceutical compounds.1 The wheat
6
agriculture, about 10,000 years ago. Einkorn and emmer were the earliest cultivated forms, which are diploid (AA) and tetraploid (AABB) species, respectively. Modern durum wheat was developed from the same wild ancestor as emmer. Now, emmer and durum are regarded as forms of the same species (Triticum turgidum). Triticum aestivum (bread wheat) goes back about 9,000 years ago by hybridization of cultivated emmer with wild “goat grass” (Triticum tauschii). Today, bread and durum wheat are the varieties more cultivated, but some “ancient wheats” (emmer, einkorn, etc.) continue to be produced in small amounts to satisfy the increasing demand for the health food market.2 Although there is no precise definition, it is
generally accepted that ancient wheat has remained unchanged over the last hundred years. On the contrary the modern wheats were modified and subjected to the “Green-Revolution”. This revolution was a mix of research and technological transfer initiatives that occurred between the 1930s and the late 1960s. The Green- Revolution was initiated by Strampelli, who was among the first, in Europe and in the World, to systematically apply Mendel's laws to modify some proprieties of this crop. At the end of this revolution modern varieties characterized by higher yield, a reduced susceptibility to diseases and insects, an increased tolerance to environmental stresses, a homogeneous maturation (to optimize harvest) were obtained. By using these modern varieties it was possible to increase the production of wheat with a concomitant decrease in genetic variability as well as a gradual impoverishment of the nutritional and nutraceutical properties.1 On the contrary, the ancient varieties are
cultivated with environmentally sustainable organic agriculture. The most common ancient wheat species commercially available are einkorn (Triticum monococcum), emmer (Triticum dicoccum), khorasan (Triticum turgidum ssp. turanicum) and spelt (Triticum spelta). In addition, there are several old cultivars of both Triticum aestivum and Triticum durum that remained unchanged over the years, namely Russello, Senatore Cappelli, Timilia or Tumminia and Urria (Triticum durum), as well as Autonomia B, Frassineto, Gentil Rosso, Inallettabile, Maiorca, Sieve, Solina, and Verna (Triticum aestivum).1 The characteristic nature, low-input and organic managements,
have increase the interest on ancient wheat cultivars, and for these reasons they are considered more “natural” with respect to modern wheats.Today, research performed on ancient wheat varieties is scarce and in particular
7
exhaustive proteomic comparisons of these species with respect to the modern wheat varieties are lacking.
1.1 Classification of wheat proteins
The classification of wheat proteins is based on their solubility and extrability in various solvent, named Osborne’s classification (Fig. 2). By using this Osborne’s classification, these proteins are grouped in:
albumins, which are soluble in water;
globulins, which are soluble in dilute salt solution; gliadins, which are soluble in 70% ethyl alcohol, and;
glutenins, which are soluble in dilute acid solution or 70% ethyl alcohol under reducing conditions.3
Figure 2. Protein fractions from wheat grain obtained by sequential extraction in different solvent9
8
The terms “albumins” and “globulins” are also more widely used for proteins with similar solubility properties from other organism while the prolamins are named specifically in different cereals: gliadins in wheat, hordeins in barley, secalins in rye, and zeins in maize.
Another classification of the cereal proteins is based on their functions: structural and metabolic proteins, protective proteins and storage proteins. The first group include a wide number of proteins, which contribute to cell, structure and function, such as enzyme, proteins involved in transport, growth, gene transcription and protein synthesis. This group include albumins and globulins of Osborne’s classification. The group of protective proteins comprises components involved in defence mechanism of the plant. The last group includes proteins deposited in seeds. These proteins provide a store of amino acids and carbon skeletons for germination and represent more than 50% of the total protein content in the mature cereal seeds.
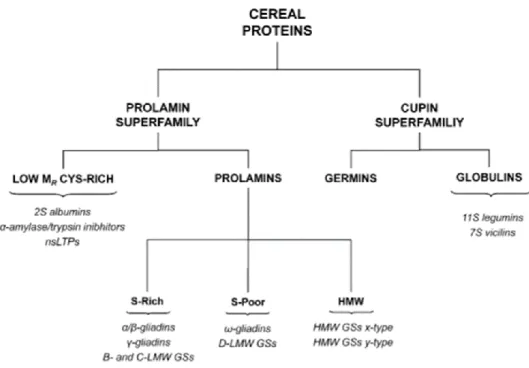
Today the cereal proteins are classified into superfamilies: prolamins and cupins (Fig. 3). The prolamin superfamily includes seed proteins mainly, which can be divided into two types low-molecular-mass sulfur-rich seed proteins and the prolamins themselves. The proteins of the first group have molecular mass of about 7-16 KDa. This group include three major classes of cereal food allergens, 2S albumins, non-specific lipid transfer proteins and cereal α-amylase/trypsin inhibitors. The prolamine themselves shows a large variety of structure and properties. A classification, based to structure, divides these proteins in three groups: sulfur-rich rich), sulfur-poor (S-poor) and High Molecular Weight (HMW) prolamins. The proteins of cupin superfamily are divided in germins and storage globulins. They are involved in the response to various stress conditions. The storage globulins, on the basis on their sedimentation coefficient, can be divided into 7S vicilin-type globulins and the 11S legumin-type globulins.10
9
Figure 3. Classification of wheat proteins based to their structural and evolutionary relantionships10
2. Proteomic analysis
The term "proteomics", proposed by analogy with the word genomics, indicates study in large-scale of proteome. Proteomics is more complex to genomics for various reasons. One reason is that several proteins may come from the expression of a single gene. Today, is almost never valid the old idea that to a gene corresponds a protein. Phenomena such as splicing and numerous post-translational modifications that characterize the mature product, may take place from the gene transcription to the "final protein product", which increase the variability of a single protein species.
There are three different proteomic approaches: "Bottom-up", "Shot-gun" and "Top down" (Fig. 4) methods. In the first approach a complex mixture of proteins is separated by mono or two-dimensional
10
electrophoresis. Subsequently, the protein of interest is excised from the gel and subjected to enzymatic digestion. This is followed by mass spectrometry analysis (MALDI-TOF or RP-HPLC/nESIMSMS) and bioinformatics research. The second approach is commonly named "Shot-gun" or "MuDPIT" (Multidimensional Protein Identification Technology). By using this method, the mixture of proteins is directly subjected to enzymatic digestion and peptides are separated by on-line chromatography coupled to tandem mass spectrometry.11 In this case, the experimental procedure is more easy but
the processing of the data is difficult for the complexity of the system. The "top-down" approach consists in the study of intact protein ions and their direct fragmentation within the instrument without previous digestion12.
Figure 4. Schematic illustration of the difference between “top-down” and “bottom-up” proteomics
2.2 High Performance Liquid Chromatography (HPLC)
High-Performance Liquid Chromatography (HPLC), allows to perform separations of very complex mixtures. The principle of separation of this
11
technique is based on the formation of a pseudo-equilibrium between each component of the sample, the stationary phase and the liquid mobile phase flowing between the particles of the stationary phase. The dimensions of the particles, which thus confer a high efficiency, of the stationary phase are comprised between 3 and 10 µm. At the head of the column there is a pump to apply a pressure to elute the liquid mobile phase. In this way, the separation is faster, but the process takes place through a larger number of theoretical plates, which results in better resolution. Usually, the reverse-phase chromatography (RP-HPLC) is the common type of liquid chromatography used for the separation of protein and peptide mixtures. This technique uses apolar stationary phase, consists of more or less long alkyl chains (C4, C12, C18), linked to small spheres of silica and polar mobile phase, generally a mixture of two or more different solvents, whose flow rate is regulated by the respective pump. This makes possible to work in two different conditions of flow:
• isocratic conditions, where there is the same mobile phase composition during the analysis;
• conditions of gradient elution; in this case the solvent composition and consequently polarity are variable during the analysis. In this way, the gradient separates the analytes contained in the mixture in function of their affinity for the specific mobile phase compared to the stationary phase.
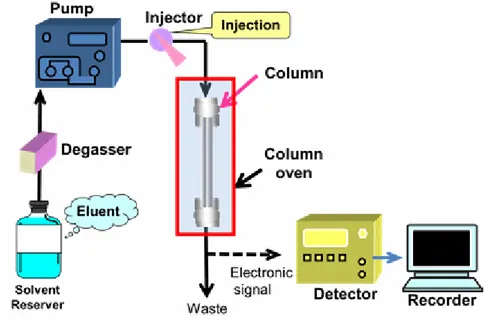
When a separation is effected with elution gradient, at the beginning of the separation the mobile phase is rich in the more polar solvent and, thereafter, the solvent with non-polar characteristics is increased over the time. Usually, in RP-HPLC water is the polar solvent and methanol or acetonitrile are the apolar organic solvents. In this way, initially the more polar components of the mixture are eluted, whereas the more apolar ones, which have a greater affinity for the organic eluent are eluted later. The main components of a modern HPLC are (Fig. 5):
• containers for solvents with degassing system;
• pumps, used to apply high pressures to elute the mobile phase in the system. The pump allows to maintains a stable and reproducible flow during the analysis;
12
• system for the introduction of the sample (sampling loop);
• column, in which the separation of the analytes occurs; the HPLC columns can have different dimensions and characteristics depending on the type of analyses to be performed, on the system used, the type of detector and, not least, the amount of sample available;
• detector, which generates a signal when reached by the eluted components of the mixture. The selection of the detector depends on the needs dictated by the nature of the sample, because universal and highly sensitive detectors for HPLC do not exist. Usually, the detectors used for liquid chromatography are based on the measure of the absorption of ultraviolet or visible light by the sample. For instance, detection of proteins is carried out at 220-224 nm. On the other hand, a particularly sensitive and versatile detector is represented by a mass spectrometer with electrospray ionization, which today is widely used in proteomic studies.
13
2.3 Mass spectrometry
Mass spectrometry is an analytical technique based on the production of ionized molecules, the subsequent separation on the basis of their different mass/charge ratio (m/z) and detection of the ions produced. At the end, a graph of relative abundance versus m/z ratio is obtained. The principal constituents a mass spectrometer are (Fig. 6):
system for the introduction of the sample;
source, where the ionization of the sample occurs;
analyzer, which performs a separation of the ions produced in the source according to their m/z ratio;
detector, where the separated ions are detected;
vacuum system, whose task is to keep the various parts of the instrument under vacuum, the presence of which (the pressure is around 10-6-10-8Torr) is needed primarily to avoid the collision of the
ions produced with the atmospheric gases.
14
2.3.1 Ion sources
The electron impact (EI) and the chemical ionization (CI) were the first sources for ionization of the sample, suitable only for molecules with low molecular weight and easy to transfer in the gas phase. In the late 1980, thanks to the introduction of two new methods for desorption/ionization, respectively known as MALDI (Matrix-Assisted Laser Desorption/Ionization) and ESI (Electrospray Ionization), mass spectrometry has assumed an important role also in the study and characterization of biomolecules.
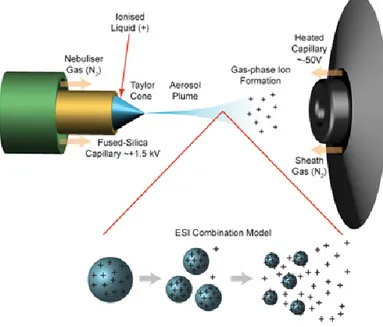
In particular, the electrospray ionization (ESI) is a soft ionization technique since it does not produce fragmentation of the sample. This ionization technique is the ideal interface for the on line coupling of a chromatographic system (RP-HPLC/ESI MS) and a mass spectrometer, and assumed an important role in the field of mass spectrometry for the ability to bring into gas phase and ionize macromolecules of biological origin. Electrospray mass spectrometry (ESI-MS) allows to obtain, from a solution of analyte introduced into the source by direct infusion or coming from a chromatographic column, single-charged ions and multiple charged ions which are thus sent to the analyzer and to the detection system.
By using a capillary tube of silica the protein solution is introduced into the source. Inside the ionization chamber, a spray is produced between the metallic tip of the needle and a counter electrode, where it is present a strong electric field (3-5 kV) that disperses the solution emerging from the needle into an aerosol of droplets with a high charge concentration. The desolvation of the droplets of the spray is obtained by using a stream of nitrogen suitably heated or just the high temperature of the capillary tube. The generally used solvent is water mixed with an organic solvent (acetonitrile, methanol, or propanol) and small amounts of or a weak acid (trifluoroacetic acid, acetic acid or formic acid) or a weak base (ammonia solution) to facilitate the ionization of the sample and the formation, respectively, of positive or negative ions. The mechanism through which the ions are formed starting from the charged drops of sample has not yet been completely
15
clarified; several models have been proposed, including a qualitative model compatible with the mechanisms proposed by Smith, Fenn and Röllgen.13,14,15 According to this model, in a first moment the formation
of micro-droplets fillers whose dimensions are related to their surface tension is observed; the hot gas stream causes the desolvation of these micro-droplets, tending to bring together the charged molecules. When the force of the Coulomb repulsion equals the surface tension of the droplet (Rayleigh limit), it explodes producing other smaller droplets (nano-droplets)16 that are subject to further desolvation (Fig. 7).
Figure 7. ESI source and model of ions formation
The pre-chamber is located at a pressure of 10-1-10-2 Torr, only a part
of the ions arrives to this part of the instrument. Subsequently, the ion beam is focused, through a series of electrostatic lenses (skimmers), and reaches the analyzer (10-6 - 10-7 Torr), where separation takes place
based on the value of the m/z ratio. The formation of multiple charged ions allows to display ions with high masses even working with analyzers that have limited mass range and, therefore, makes this ionization method an excellent tool for the analysis of peptides and proteins. A
16
typical ESI spectrum of positive ions of a protein consists of a set of peaks, each of which is generated from the analyte that has linked a specific number of protons. The proteins are usually analyzed as positive ions because a series of multi-charged protein ions generated in the source is mainly related to the protonation of basic sites of molecules. In general, in a protein, the number of basic amino acid residues determines the maximum number of protons that the molecule can take. The ESI spectrum of small molecules shows a precise correlation between the number of basic sites present in the structure and multi-charged ions. When the size of the molecule increases, this correlation is not so rigorous because some of the basic sites will be located inside the protein itself according to a particular conformation, and will be protonable with difficulty. The capacity to protonate a protein of high molecular weight is closely related to the conformation that the protein assumes in solution under the experimental conditions (pH, temperature, presence of denaturing agents). ESI mass spectrometry constitutes a particularly powerful and versatile detector for high performance liquid chromatography (HPLC). Tandem mass spectrometry is employed in order to select an ion with a given m/z ratio ("precursor" ion) and subsequently to fragment it; fragmentation leads to the formation of lower mass ions ("fragment" ions), which are analyzed in a second stage of analysis of mass 17. The characteristic
fragmentation peaks in the MS/MS spectra allow to obtain important information on the molecular structure of the precursor ion. In the case of peptides, the fragment ions are generated by cleavage of the peptide bond with retention of the positive charge at the N-terminal (b series) or in the C-terminal part (y series) along the main chain (Fig. 8), and allow to go back to the amino acid sequence of the precursor peptide.
17
Figure 8. Scheme of the typical peptide fragmentation
2.3.2 Mass analyzer
The ion source can be interfaced with different mass analyzers. The most commonly used are quadrupole (Q), ion trap (IT), time-of-flight (TOF) and Orbitrap. The characteristics of these mass analyzer are different both in principles of operation and performance.
In particular, in 1999 Alexander Makarov developed the “Orbitrap” (Fig. 9), a new mass analyzer constitutes by an inner electrode (central) and external electrode, axially symmetrical, which create a combined square logarithmic electrostatic potential.
Figure 9. Ion motion within an Orbitrap analyzer
The ions rotate around a center electrode and oscillate with harmonic motion along its axis (z direction) with a frequency characteristic of their m/z values. As mentioned, within this analyzer,
18
the axial symmetric electrodes create a square logarithmic U (electrostaticpotential), which can be calculated through the equation:
where r and z are the cyclic coordinates, C is a constant, k is the field curvature and Rm is the characteristic radius. In this U field, a rotational
motion around the electrode and an oscillatory motion along the axes create stable trajectories of the ions, which result in a complex spiral. The equations that describes this motion for this mass analyzer are very complex. From these equations it follows that the mass and the charge are correlated with the
frequency of axial oscillations, expressed in
radiant/second:
ω is completely independent of the energy and position of the ions, and
thus can be used for analysis of mass (in fact in the expression appears the ratio q/m). All ions have then a harmonic oscillatory motion of the same amplitude but of different ω frequency. These frequencies are measured in a non-destructive way by a differential amplifier, which acquires the signals of the current image in the time domain. For each ion is produced a wave function; therefore, a mixture of ions gives rise to overlapped signals that can be converted to a mass spectrum thanks to Fourier transform.
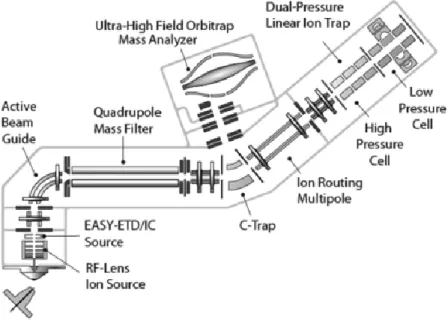
In 2013, a new instrument was introduced, the Orbitrap Fusion Tribrid Mass Spectrometer (Fig. 10). This instrument combines the best of quadrupole, linear ion trap and Orbitrap mass analysis in a new instrument. The resolution of this instrument is up to 450,000 FWHM. Moreover, the precursor selection using a quadrupole mass filter allows the ion trap and Orbitrap mass analyzer to operate in parallel for
19
excellent sensitivity and selectivity. Also, multiple dissociation techniques (CID, HCD and ETD) are possible.
Collision Induced Dissociation (CID) in the most commonly method of fragmentation in proteomics.18 By using anelastic collision, selected
precursor ions are collided with an inert gas. CID fragmentation occurs at the peptide bond between the carboxyl group and amino group. The produced fragments are y-ions and b-ions.19 High-energy Collision
Dissociation (HCD) is a fragmentation method which produces the same y/b-ions and Y/B-ions as CID. It can be performed only in instrument with HCD fragmentation cell and uses higher energy than CID. The theory of precursor ion fragmentation the in Electron-transfer dissociation (ETD) is still debated, but it is known that ETD produces fragments of c/z-type, given complementary information about peptide sequence.
20
2.4 Bioinformatic search
Adequate support of software to analyze the collected data is fundamental in proteomic analysis. Today, there are a variety of algorithms for the interpretation of peptide fragmentation data.LC-MS/MS data in this work were processed using PEAKS 8.5 (Bioinformatics Solutions Inc.) software.
2.4.1 Peaks 8.5 (Bioinformatics Solutions Inc.)
In order to identify proteins, LC-MS/MS data were processed using PEAKS 8.5 (Bioinformatics Solutions Inc.). Usually, the algorithm to identify the identity of a peptide compare the fragmentation pattern to theoretical fragmentation pattern derived from protein sequence databases. PEAKS Q 8.5 (Bioinformatics Solutions Inc.) employed in the present work to process LC-MS/MS data for proteins identification uses this method and integrates database search with de novo sequencing for peptide identification. De novo sequencing derives directly the peptide sequence from the MS/MS spectrum without the need of a sequence database.21
Label-free quantification is included in the PEAKS Q module. It is used in the study of large scale proteomics to obtain a fast protein profiling. This quantification method is based on the detection of peptide features (mass, retention time and signal intensity) in multiple samples. For each sample is obtained a feature detections and than by using the EM (expectation-maximization) algorithm, these features can be overlapped. The features of the same peptide from different samples are aligned together using a high performance retention time alignment algorithm.22
21
3.Label-free proteomic analysis
Mass spectrometry plays an important role in proteomic analysis. The new techniques, developed in recent years, gel-free based “shotgun” proteomic, such as Multidimensional Protein Identification (MudPIT) allow to study the protein expression in complex biological system.23,24 Proteomic studies can be performed to obtain both absolute
(using internal standards) or relative quantification by different techniques including label-based and label-free approaches.
In label-based approach a stable isotope is used to label the sample by biosynthetic or chemical reactions.25 Labelling strategies are often
preferred because they are considered more accurate in quantitating protein abundances. However, this technique requires expensive isotope labels, specific software and expertise to analyse data.32
Moreover, most of the label-based methods require more steps in sample preparation and higher sample concentration, are more expensive and can only be performed for a limited number of samples.26,27
MS-based label-free quantitative proteomics avoids the use of isotopes to label the samples under investigation and this approach can be used in “shotgun” analysis (analysis of the whole proteome) or in targeted analysis (analysis of specific proteins) and it can be applied when labelling is not possible.28 There is a correlation between protein
abundance and peaks areas29,30 or number of MS/MS spectra.31 Today,
label-free methods are divided in two groups: (i) measurement of the intensity of the ion precursor signal or area under the curve (AUC) and (ii) spectral counting, which is based on counting of the number of peptides assigned to a protein in an MS/MS experiment (Fig.
22 11).32
Figure 11. Schematic diagram of the two main approaches used in label-free proteomics. AUC quantitation is performed at the MS level and peptides found to have differential expression are identified by MS/MS. In Spectral counting quantitation and identification are performed simultaneously at the MS/MS level.32
Regardless of which label-free quantitative proteomics method is used, the analysis includes the following fundamental steps:
sample preparation including extraction, reduction, alkylation and digestion;
sample separation using liquid chromatography and ESI-MS/MS;
data analysis, including protein identification, quantification andstatistical analysis.
After the acquisition of MS/MS spectra, the raw data need to be processed by a software. Label-free proteomics software workflows typically consist of multiple steps: peptide peak picking, peptide identification, feature finding, matching of the features with identified peptide, alignment of the features in different samples. Protein quantifications is finally obtained from quantified peptides.33,34
23
4. Aim of work
Wheat flour is the main ingredient in most type of breads, pastries and pastas worldwide, because of its unique protein composition.2
However, as above reported, wheat is also the causing factors of many adverse reactions, such as celiac disease, allergies and non-celiac wheat sensitivity in susceptible people. A consistent percentage of the general population considers oneself to be suffering from problems caused by wheat and/or gluten ingestion, even if they are not celiac. These people follow a gluten-free diet for health reasons as a lifestyle choise. Moreover, the close relationship between diet and health is now generally recognized and the increased wellness and consciousness, especially in developed Countries, has led to an increasing interest for the old wheat genotypes, which are generally considered better tolerated than the modern ones, but without any scientific evidence.
This work is aimed to the comparative proteomic analysis and a quantitative evaluation by using a MS label-free approach of the metabolic proteins in old ad modern durum wheat varieties. Proteins were extracted from the mature kernel of Russello and Timilia reste bianche, two old Sicilian durum wheat landraces, and Simeto, an improved durum wheat variety, widely spread in Italy and other European countries (Spain, Greece, etc.). Russello and Timilia are cultivated in areas such as Agrigento, Caltanissetta, Ragusa e Trapani. They are used in the production of high digestible bread and pasta. Simeto is a durum wheat variety, common in southern Italy and in islands, which has an excellent capacity to adapt to different temperature conditions. The protein profile of this variety can be considered representative of the commercial cultivars most widely used in the current practice.
To improve the qualitative comparison between these cultivar an enrichment of two fractions, metabolic and CM-like proteins, was carried out. Although the separation of these protein fractions is not selective and consequently a cross contamination between the two fractions is observed, this method allows to enhance the number of protein identifications in each fractions.
24
The quantitative evaluation was performed by using a “shotgun” approach on the whole metabolic protein fraction, without any separation. It was not possible to use the same extracts to carry out the qualitative and quantitative comparison because the cross contamination undermined the quantitative results.
5. Material and methods
5.1 Materials
The wheat flour of Russello, Timilia Reste Bianche and Simeto were provide from Cereal Research Centre (CREA), Foggia.
All chemicals were of the highest purity commercially available and were used without further purification. KCl, NaCl, K2HPO4, acetone,
methanol and Tris-HCl were purchased from Carlo Erba (Milan, Italy). Formic Acid (FA), Protease Inhibitor Cocktail, EDTA, ammonium acetate, dithiothreitol (DTT), iodoacetamide (IAA) and lysozyme were obtained from Aldrich (St. Louis, Missouri, USA). Modified porcine trypsin was purchased from Promega (Madison, WI, USA). Water and acetonitrile (OPTIMA® LC/MS grade) for LC/MS analyses were purchased from Fisher
Scientific (Milan, Italy).
5.2 Extraction of the metabolic and CM-like protein fractions for
the qualitative comparison
Wheat flours (200 mg) were suspended in 2 mL of cold (4°C) extraction solution (50 mM Tris-HCl, 100 mM KCl, 5 mM EDTA, Protease Inhibitor Cocktail, pH 7.8) in order to extract the metabolic and CM-like proteins. The solution was incubated on ice for 5 minutes with intermittent mixing and centrifuged at 12000 rpm for 15 minutes at 4°C. The obtained soluble fraction was collected and five volumes of 0.1 M ammonium acetate in methanol was added. Following incubation over
25
night at -20°C, the solution was centrifuged at 3000 rpm for 15 minutes at room temperature. The pellet (constituted by the metabolic proteins) was collected and rinsed in 3 mL of ammonium bicarbonate buffer 0.1 M, pH 8.2. The proteins in the supernatant (CM-like proteins) were precipitated by addition of four volumes of cold acetone. The resulting mixture was kept overnight at -20°C and subsequently centrifuged at 3000 rpm for 15 minutes at room temperature. Finally, the pellet (CM-like proteins) was rinsed in 1.5 mL of ammonium bicarbonate buffer 0.1 M, pH 8.2.35 The concentration for each extract was determined by
fluorimetric assay.
5.3 In-solution digestion of metabolic and CM-like proteins
40 µL (about 60 µg) of each protein extract were reduced by DTT (3 hours, 20°C), alkylated with IAA (1 hour, 20°C) and digested by porcine trypsin overnight at 37°C.5.3 Extraction of the metabolic proteins for the quantitative
comparison
200 mg of wheat flour were extracted in 2 mL of extraction buffer (0.4 M NaCl, 0.067 M K2HPO4, pH 7.6) for 15 min under continuous
stirring at 20°C. The insoluble fraction was spinned down at 12,000 x g for 15 min in an Eppendorf centrifuge. The pellet material was separated and the extraction procedure was repeated twice. The supernatants from these extractions were pulled and stored at -80°C until required.
5.4 In-solution digestion of the metabolic proteins
Lysozyme (0.8 µg) was added internal standard to 50 µg (about 50 µL) of each protein extract. Each sample was reduced by DTT (3 hours, 20°C), alkylated with IAA (1 hour, 20°C) and digested by porcine trypsin
26
overnight at 37°C. In each sample a 5% aqueous solution of formic acid was added to obtain a final volume of 2 mL.
5.5 Liquid chromatography and tandem mass spectrometry (LC–
MS/MS) analysis
Mass spectrometry data were acquired on a Thermo Fisher Scientific Orbitrap Fusion Tribrid (Q-OT-qIT) mass spectrometer (Thermo Fisher Scientific, Bremen, Germany). Liquid chromatography was carried out using a Thermo Scientific Dionex UltiMate 3000 RSLCnano system (Sunnyvale, CA). One microliter of the reconstituted sample was loaded onto an Acclaim ®Nano Trap C18 Column (100 µm i. d. x 2 cm, 5 µm
particle size, 100 Å). After washing the trapping column with solvent A (H2O + 0.1% FA) for 3 min at a flow rate of 7 μL/min, the peptides were
eluted from the trapping column onto a PepMap® RSLC C18 EASY-Spray
column (75 µm i. d. x 50 cm, 3 µm particle size, 100 Å). Peptides were separated by elution at a flow rate of 0.25 µL/min at 40°C with a linear gradient of solvent B (ACN + 0.1% FA) in A, 5% for 3 min, followed by 5% to 20% in 32 min, 20% to 40% in 30 min, 40% to 60% in 20 min and 60% to 98% in 15 min. We finished by holding 98% B for 5 min, 98% to 5% in one minute and re-equilibrating the column at 5% B for 20 min. The eluting peptide cations were converted to gas-phase ions by electrospray ionization using a source voltage of 1.75 kV and introduced into the mass spectrometer through a heated ion transfer tube (275 °C). Survey scans of peptide precursors from 200 to 1600 m/z were performed at 120K resolution (@ 200 m/z). Tandem MS was performed by isolation at 1.6 Th with the quadrupole, HCD fragmentation with normalized collision energy of 35, and rapid scan MS analysis in the ion trap. Only those precursors with charge state 2–4 and an intensity above the threshold of 5∙103 were sampled for MS. The dynamic exclusion
duration was set to 60 s with a 10 ppm tolerance around the selected precursor and its isotopes. Monoisotopic precursor selection was turned on. The instrument was run in top speed mode with 3 s cycles, meaning that the instrument would continuously perform MS2 events until the
27
shorter. MS/MS spectral quality was enhanced enabling the parallelizable time option (i.e. by using all parallelizable time during full scan detection for MS/MS precursor injection and detection). Mass spectrometer calibration was performed by using the Pierce® LTQ Velos
ESI Positive Ion Calibration Solution (Thermo Fisher Scientific). MS data acquisition was carried out by utilizing the Xcalibur v. 3.0.63 software (Thermo Fisher Scientific).
5.6 Database search
LC–MS/MS data were processed using PEAKS de novo sequencing software (v. 8.5, Bioinformatics Solutions Inc., Waterloo, ON Canada). Data were searched against a dedicated protein database (7612 protein sequences), including only entries of Triticum, Oryza, Hordeum, Avena, Secale, Maize and Brachypodium species from UniProt database (release July 2018).
Database search in the qualitative analysis was carried out using the following parameters: i) full tryptic peptides with a maximum of 3 missed cleavage sites; ii) cysteine carbamidomethylation as fixed modification; iii) oxidation of methionine, transformation of N-terminal glutamine and N-terminal glutamic acid residue in the pyroglutamic acid form as variable modifications. The precursor mass tolerance threshold was 10 ppm and the max fragment mass error was set to 0.6 Da. Peptide spectral matches (PSM) were validated using a Target Decoy PSM Validator node based on q-values at a 0.1% FDR. A protein was considered identified if a minimum of two peptides were matched. Proteins containing the same peptides and that could not be differentiated based on MS/MS analysis alone were grouped to satisfy the principles of parsimony.
Finally, the identified unique gene products were classified, when available, by their Gene Ontology annotation (biological processes and molecular functions).
Label-free quantification analysis was performed processing LC– MS/MS data by PEAKS Q (v. 8.5, Bioinformatics Solutions Inc., Waterloo, ON Canada). This quantification method is based on the detection of
28
peptide features (mass, retention time and signal intensity) in multiple samples. For each sample is obtained a feature detections and than by using the EM (expectation-maximization) algorithm, these features can be overlapped. The features of the same peptide from different samples are aligned together using a high performance retention time alignment algorithm.24 Proteins were considered as differentially expressed, for
fold change ratios > 2 and significance > 20.
6. Results and discussion
6.1 Qualitative comparison
Three biological replicates for each cultivar were analyzed. The extraction procedure of metabolic and CM-like proteins was carried out one time for each biological replicate of each cultivar. The extraction of these protein fractions is not selective, therefore a cross-contamination between these protein groups was obtained. Then, each extract was subjected to in-solution digestion followed by triplicate RP-nHPLC/nESI-MS/MS analysis and database search, in order to assess the reproducibility of the available MS data. Fig. 12 show a scheme of the adopted procedure for each cultivar.
29
Figure 12. Scheme of the adopted analytical procedure for each cultivar In order to obtain the two final lists of proteins (metabolic and CM-like proteins) for each variety here investigated, the following approach was adopted. Firstly, for each extract (i.e. metabolic or CM-like fraction) the lists of the proteins identified in the triplicate LC-MS/MS analyses were compared. Only those proteins identified at least twice were considered reliable. Then, the lists of proteins reliably identified in each biological replicate were compared, and only those proteins identified at least twice were considered to compile the final list for each cultivar.
The approach above described allowed the identification of 408 for Russello, 423 for Timilia Reste Bianche and 483 for Simeto, in their respective metabolic fractions. The lists of the identified proteins for each cultivar are reported in Tab. 1, 2 and 3, respectively. By the same approach, 100 proteins for Russello, 113 for Timilia Reste Bianche and 104 for Simeto, were identified in the CM-like fractions. The lists of the identified proteins for each cultivar are reported in Tab. 4, 5 and 6, respectively.
In order to perform a qualitative comparison among the cultivar investigated, the list of the identified proteins in the metabolic fraction of each ancient cultivar was compared with that obtained for the modern cultivar Simeto.
To carry out the Gene Ontology analysis for each cultivar, gene symbols were assigned to all the identified proteins by using the Uniprot Knowledge
30
database (http://www.uniprot.org/). It should be noted that the limited annotation of the wheat proteins in many cases required an additional step aimed to obtain coding gene information. So that, when the gene symbol was not available, the corresponding protein sequence was subjected to a sequence similarity search by BLAST (Basic Local Aligment Search Tool;
http://blast.ncbi.nlm.nih.gov/Blast.cgi). Via this strategy, it was also possible to classify many “uncharacterized proteins” by finding homologous proteins present in databases, generally sharing more than 70% sequence similarity. By this approach, the proteins were grouped into protein families (unique gene products), taking into account, when available, the corresponding gene symbol and were subjected to gene ontology (GO) analysis through the PANTHER (Protein ANalysis THrough Evolutionary Relationship) system (http://www.pantherdb.org) by using the Oryza sativa, Brachypodium and Arabidopsis thaliana genome annotations as background.
A general qualitative comparison of the metabolic fractions of Russello, Timilia and Simeto revelead that 332 proteins are common to all cultivar (Fig. 13).
Figure 13. Venn diagram of the number of identified proteins in the metabolic fractions of cultivar Russello, Timilia reste bianche and Simeto
It was found that 78, 27 and 33 proteins are exclusive of the cultivar Simeto, Russello and Timilia respectively. The lists of these proteins are reported in Tab. 7, 8 and 9.
The identified metabolic proteins were classified in Molecular Function and Biological Process by Gene Ontology (Fig. 14). The lists of gene symbols used in the classification for each cultivar, Russello, Timilia and Simeto, are
332 17
32 41
SIMETO
31
reported in Tab. 10, 11 and 12, respectively. The qualitative proteomic analysis of these durum wheat varieties revealed a remarkable similarity in the protein composition between old and modern cultivar. In particular, this comparison reveals that most of them are involved in binding, structural molecule activity and catalytic activity and play a role in the same biological processes.
Figure 14. Gene Ontology of the metabolic proteins identified in Russello, Timilia
reste bianche and Simeto
6.1.1 Qualitative comparison of the metabolic protein fractions of
Russello and Simeto
Qualitative comparison of the metabolic protein fraction of Russello and Simeto, revealed that these two cultivar shared 364 proteins, whereas 44
32
and 119 are exclusively identified in the cultivar Russello and Simeto, respectively.
Figure 15. Venn diagram of the number of identified proteins in the metabolic fractions of cultivar Russello and Simeto
Gene Ontology analysis of the proteins identified exclusively in Russello and Simeto, allowed to ascertain their molecular function and the biological process in which they are involved (Fig. 16).
As depicted by the Molecular Function distribution, the proteins exclusively found in Russello or in Simeto, are mainly involved in catalytic activity, binding and structural molecular activity. The antioxidant activity is higher in the old variety (10.6%) respect to Simeto (3.8%). The proteins involved in this molecular function are different in the cultivars: superoxide dismutase, peroxidase in Russello and L-ascorbate peroxidase in Simeto, with only one protein, catalase, common to both varieties.
The comparison of Biological Process distribution does not show significant differences for almost all the biological processes reported, with the exception of the response to stimulus. Indeed, the cv. Simeto shows a percentage (5.5%) of proteins playing a role in this biological process which is lover with respect to that reported for the cv. Russello (14.3%). This biological process is divided in two sub processes: response to endogenus stimulus and response to stress. For the cv Russello there are two proteins involved in the first one (pyruvate kinase 1 cytosolic and ras-related protein RIC1) and seven proteins involved in the second one (belonging to the families superoxide dismutase, peroxidase, catalase and heat shock protein).
364
33
The proteins involved in the response to endogenus stimulus in cv Simeto is the pyruvate kinase 2 cytosolic, whereas the proteins involved in the response to stress are six proteins belonging to ribosomial proteins, L-ascorbate peroxidase, catalase and ubiquitin-activating enzyme.
Figure 16. Gene Ontology of the unique proteins identified in the comparison
Russello with Simeto
6.1.2 Qualitative comparison of the metabolic protein fractions of
Timilia reste bianche and Simeto
The list of proteins identified in the metabolic fraction of Timilia reste bianche and Simeto, shared 373 proteins. On the contrary, 50 components were unique for the cv Timilia and 110 were exclusively found in the cv Simeto.
34
Figure 17. Venn diagram of the number of identified proteins in the metabolic fractions of cultivar Timilia reste bianche and Simeto
Gene Ontology analysis (e.g. classification based on their molecular function, biological process and protein class) of the unique proteins for these two cultivars are reported in Fig. 18.
Comparison of Molecular Function distributions, shows that most of the exclusive proteins of these two cultivars are mainly devoted to catalytic, binding and structural molecular activities. However, the cultivar Simeto also presents exclusively proteins involved in structural molecule activity (tubulin alpha and beta, 60s and 39s ribosomial protein family) and in receptor activity (V-type protein family), two molecular functions absent in exclusive proteins of Timilia. On the contrary, the cultivar Timilia is characterized for the presence of a higher antioxidant activity (12.2%) respect to 2% in Simeto but the proteins involved in this activity belong to the same families.
As above reported for the comparison between Simeto and Russello, the Biological Process distribution of unique proteins of Timila and Simeto does not show significant differences for almost all the biological processes reported.
373
35
Figure 18. Gene Ontology of the unique proteins identified in the comparison
Timilia reste bianche with Simeto
6.1.2 Qualitative comparison of the metabolic protein fractions of
Timilia reste bianche and Russello
The list of proteins identified in the metabolic fraction of Timilia reste bianche and Russello, shared 349 proteins. On the contrary, 74 components were unique for the cv Timilia and 59 were exclusively found in the cv Russello.
36
Figure 19. Venn diagram of the number of identified proteins in the metabolic fractions of cultivar Timilia reste bianche and Russello
The exclusive proteins of Russello and Timilia are mainly involved in the same Molecular Function: catalytic activity, binding and structural molecule activity. The signal trasducer (receptor for activated C kinase 1A and Guanine nucleotide-binding protein subunit beta-like protein A) and receptor activity (V-type proton ATPase subunit B1) are present only in the cultivar Russello. As above reported for the previous comparisons, the Biological Process distribution of unique proteins of Russello and Timilia does not show significant differences for almost all the biological processes reported (Fig. 20).
349
37
Figure 20. Gene Ontology of the unique proteins identified in the comparison
Russello with Timilia reste bianche
6.1.3 Qualitative analysis of CM-like protein fractions of old and
modern varieties
As expected, a selective separation of protein fractions was not achieved in the extraction method used. In fact, a cross contamination between the metabolic and CM-like fractions was observed. Therefore, a comparative analysis between the CM-like fraction of modern and ancient cultivars was conducted only considering the effective CM-like proteins. The CM-like enriched fractions contained mainly nine amylase and alpha-amylase/trypsin inhibitors (Tab. 13), together with minor amount of metabolic proteins. Comparison of these class of proteins revealed that all the investigated cultivar shows a very similar qualitative composition.
38
Table 13. CM-like proteins identified in the comparative analysis between old and modern cultivar
Acc. Number Description
Q43723 Trypsin/alpha-amylase inhibitor CMX1/CMX3 Q43691 Trypsin/alpha-amylase inhibitor CMX2 P01885 Alpha-amylase inhibitor 0.19
P01083 Alpha-amylase inhibitor 0.28 P01084 Alpha-amylase inhibitor 0.53 P10846 Alpha-amylase inhibitor WDAI-3 P16159 Alpha-amylase/trypsin inhibitor CM16 P16851 Alpha-amylase/trypsin inhibitor CM2 P17314 Alpha-amylase/trypsin inhibitor CM3
6.2 Quantitative comparison
Three biological replicates of each cultivar were analyzed. The extraction procedure of the whole metabolic protein fraction was carried out one time for each biological replicate of each cultivar. Then, lysozyme was added as an internal standard in each extract and the solution was subjected to in-solution digestion followed by triplicate RP-nHPLC/nESI-MS/MS analysis and database search. Fig. 21 shows a scheme of the adopted procedure for each cultivar.
39
Figure 21. Scheme of the adopted procedure for each cultivar
The approach above described allowed the quantitative evaluation among the varieties investigated. Each old cultivar was compared with the modern cultivar Simeto and finally a comparison between the old genotypes was performed.
6.2.1 Quantitative comparison of the metabolic protein fractions
between old cultivar and Simeto
In the comparison between Russello vs Simeto and Timilia vs Simeto, 34 and 46 proteins were found differentially expressed, respectively (Tab. 14-15). These proteins are displayed in the heat maps (Fig. 22-23). The relative protein abundance is represented in the map by a color and the map displays the expression trend of each protein in each sample. The protein abundance determined in the LC-MS replicate runs and in the biological replicates is reported in the heat map for each cultivar. Simeto was chosen as a reference. Over-expressed proteins in old cultivar are in the red zone of the map, instead the under-expressed proteins are in the green zone. On the left of the map there is a graph explaining the relationship between these proteins.
41
Table 14. List of proteins differentially expressed in the comparison between Russello and Simeto
Accession Significance Description Fold change
P17314|IAAC3_WHEAT 200 Alpha-amylase/trypsin inhibitor CM3 OS=Triticum aestivum OX=4565 PE=1 SV=1 6.53 P82993|AMYB_HORVS 200 Beta-amylase OS=Hordeum vulgare subsp. spontaneum OX=77009 GN=BMY1 PE=1 SV=1 4.33 P16851|IAAC2_WHEAT 200 Alpha-amylase/trypsin inhibitor CM2 OS=Triticum aestivum OX=4565 PE=1 SV=2 11.51 P52589|PDI_WHEAT 200 Protein disulfide-isomerase OS=Triticum aestivum OX=4565 GN=PDI PE=2 SV=1 4.30 D2KFH1|AVLA4_WHEAT 200 Avenin-like a4 OS=Triticum aestivum OX=4565 PE=2 SV=1 25.92 P01084|IAA5_WHEAT 200 Alpha-amylase inhibitor 0.53 OS=Triticum aestivum OX=4565 PE=1 SV=1 3.37 P24296|NLTP1_WHEAT 200 Non-specific lipid-transfer protein (Fragment) OS=Triticum aestivum OX=4565 PE=1 SV=2 7.96 P0CZ08|AVLA3_WHEAT 200 Avenin-like a3 OS=Triticum aestivum OX=4565 PE=2 SV=1 27.19 P11143|HSP70_MAIZE 200 Heat shock 70 kDa protein OS=Zea mays OX=4577 GN=HSP70 PE=3 SV=2 4.58 P16347|IAAS_WHEAT 200 Endogenous alpha-amylase/subtilisin inhibitor OS=Triticum aestivum OX=4565 PE=1 SV=1 7.18 P37833|AATC_ORYSJ 200 Aspartate aminotransferase cytoplasmic OS=Oryza sativa subsp. japonica OX=39947 GN=Os01g0760600 PE=2 SV=1 3.63 P12810|HS16A_WHEAT 200 16.9 kDa class I heat shock protein 1 OS=Triticum aestivum OX=4565 GN=hsp16.9A PE=2 SV=1 6.42 Q9FRV0|CHIC_SECCE 200 Basic endochitinase C OS=Secale cereale OX=4550 GN=rscc PE=1 SV=1 5.30 Q10A30|ALFC2_ORYSJ 200 Fructose-bisphosphate aldolase 2 cytoplasmic OS=Oryza sativa subsp. japonica OX=39947 GN=FBA2 PE=2 SV=1 3.16 P82900|NLT2G_WHEAT 200 Non-specific lipid-transfer protein 2G OS=Triticum aestivum OX=4565 PE=1 SV=2 19.45 P30271|AMYB_SECCE 200 Beta-amylase (Fragment) OS=Secale cereale OX=4550 GN=BMY1 PE=2 SV=1 12.96 P62787|H4_MAIZE 200 Histone H4 OS=Zea mays OX=4577 GN=H4C7 PE=1 SV=2 8.45 P10846|IAA3_WHEAT 200 Alpha-amylase inhibitor WDAI-3 (Fragment) OS=Triticum aestivum OX=4565 GN=IHA-B1-2 PE=1 SV=1 4.70 P01543|THNB_WHEAT 200 Purothionin A-1 OS=Triticum aestivum OX=4565 GN=THI1.3 PE=1 SV=2 5.97 O64394|TRXH_WHEAT 200 Thioredoxin H-type OS=Triticum aestivum OX=4565 PE=2 SV=3 10.85 P10385|GLTA_WHEAT 200 Glutenin low molecular weight subunit OS=Triticum aestivum OX=4565 PE=3 SV=1 64.00 B8AL97|CUCIN_ORYSI 200 Cupincin OS=Oryza sativa subsp. indica OX=39946 GN=OsI_13867 PE=1 SV=1 6.04 Q43691|IACX2_WHEAT 200 Trypsin/alpha-amylase inhibitor CMX2 OS=Triticum aestivum OX=4565 PE=2 SV=1 4.09
42
Accession Significance Description Fold change
P21569|CYPH_MAIZE 200 Peptidyl-prolyl cis-trans isomerase OS=Zea mays OX=4577 GN=CYP PE=2 SV=1 3.47 P23901|ALDR_HORVU 156,54 Aldose reductase OS=Hordeum vulgare OX=4513 PE=1 SV=1 3.13 P16159|IAC16_WHEAT 146,54 Alpha-amylase/trypsin inhibitor CM16 OS=Triticum aestivum OX=4565 PE=1 SV=1 3.00 Q75KH3|GRDH_ORYSJ 143,53 Glucose and ribitol dehydrogenase homolog OS=Oryza sativa subsp. japonica OX=39947 GN=Os05g0140800 PE=2 SV=2 2.96 P26517|G3PC1_HORVU 140,1 Glyceraldehyde-3-phosphate dehydrogenase 1 cytosolic OS=Hordeum vulgare OX=4513 GN=GAPC PE=2 SV=1 2.93 P08477|G3PC2_HORVU 135,82 Glyceraldehyde-3-phosphate dehydrogenase 2 cytosolic (Fragment) OS=Hordeum vulgare OX=4513 GN=GAPC PE=2 SV=1 3.33 Q948T6|LGUL_ORYSJ 82,89 Lactoylglutathione lyase OS=Oryza sativa subsp. japonica OX=39947 GN=GLYI-11 PE=1 SV=2 2.25 O64392|WHW1_WHEAT 82,48 Wheatwin-1 OS=Triticum aestivum OX=4565 GN=PR4A PE=1 SV=1 2.24 Q9ST57|SPZ2A_WHEAT 35,94 Serpin-Z2A OS=Triticum aestivum OX=4565 PE=1 SV=1 2.17 P82901|NLT2P_WHEAT 20,49 Non-specific lipid-transfer protein 2P OS=Triticum aestivum OX=4565 PE=1 SV=1 22.97
Table 15. List of proteins differentially expressed in the comparison between Timilia reste bianche and Simeto
Accession Significance Description Fold change
P82993|AMYB_HORVS 200 Beta-amylase OS=Hordeum vulgare subsp. spontaneum OX=77009 GN=BMY1 PE=1 SV=1 5.94 P16159|IAC16_WHEAT 200 Alpha-amylase/trypsin inhibitor CM16 OS=Triticum aestivum OX=4565 PE=1 SV=1 3.28 P17314|IAAC3_WHEAT 200 Alpha-amylase/trypsin inhibitor CM3 OS=Triticum aestivum OX=4565 PE=1 SV=1 3.38 P16851|IAAC2_WHEAT 200 Alpha-amylase/trypsin inhibitor CM2 OS=Triticum aestivum OX=4565 PE=1 SV=2 10.41 P52589|PDI_WHEAT 200 Protein disulfide-isomerase OS=Triticum aestivum OX=4565 GN=PDI PE=2 SV=1 7.94 P01084|IAA5_WHEAT 200 Alpha-amylase inhibitor 0.53 OS=Triticum aestivum OX=4565 PE=1 SV=1 5.34 P26517|G3PC1_HORVU 200 Glyceraldehyde-3-phosphate dehydrogenase 1 cytosolic OS=Hordeum vulgare OX=4513 GN=GAPC PE=2 SV=1 3.48 D2KFH1|AVLA4_WHEAT 200 Avenin-like a4 OS=Triticum aestivum OX=4565 PE=2 SV=1 14.89 Q2A783|AVLB1_WHEAT 200 Avenin-like b1 OS=Triticum aestivum OX=4565 GN=AVNLB PE=1 SV=1 27.43
43
Accession Significance Description Fold change
P42895|ENO2_MAIZE 200 Enolase 2 OS=Zea mays OX=4577 GN=ENO2 PE=2 SV=1 4.83 P08477|G3PC2_HORVU 200 Glyceraldehyde-3-phosphate dehydrogenase 2 cytosolic (Fragment) OS=Hordeum vulgare OX=4513 GN=GAPC PE=2 SV=1 6.04 P11143|HSP70_MAIZE 200 Heat shock 70 kDa protein OS=Zea mays OX=4577 GN=HSP70 PE=3 SV=2 4.53 Q42971|ENO_ORYSJ 200 Enolase OS=Oryza sativa subsp. japonica OX=39947 GN=ENO1 PE=1 SV=2 5.32 P24296|NLTP1_WHEAT 200 Non-specific lipid-transfer protein (Fragment) OS=Triticum aestivum OX=4565 PE=1 SV=2 8.00 P24067|BIP2_MAIZE 200 Luminal-binding protein 2 OS=Zea mays OX=4577 GN=BIPE2 PE=1 SV=3 3.71 P16347|IAAS_WHEAT 200 Endogenous alpha-amylase/subtilisin inhibitor OS=Triticum aestivum OX=4565 PE=1 SV=1 6.38 P12810|HS16A_WHEAT 200 16.9 kDa class I heat shock protein 1 OS=Triticum aestivum OX=4565 GN=hsp16.9A PE=2 SV=1 5.58 P37833|AATC_ORYSJ 200 Aspartate aminotransferase cytoplasmic OS=Oryza sativa subsp. japonica OX=39947 GN=Os01g0760600 PE=2 SV=1 4.64 P0CZ08|AVLA3_WHEAT 200 Avenin-like a3 OS=Triticum aestivum OX=4565 PE=2 SV=1 18.02 P23951|CHI2_HORVU 200 26 kDa endochitinase 2 OS=Hordeum vulgare OX=4513 PE=1 SV=1 3.38 P23901|ALDR_HORVU 200 Aldose reductase OS=Hordeum vulgare OX=4513 PE=1 SV=1 3.63 Q6F2Y7|CLPB1_ORYSJ 200 Chaperone protein ClpB1 OS=Oryza sativa subsp. japonica OX=39947 GN=CLPB1 PE=2 SV=1 3.86 Q43772|UGPA_HORVU 200 UTP--glucose-1-phosphate uridylyltransferase OS=Hordeum vulgare OX=4513 PE=2 SV=1 3.99 P12783|PGKY_WHEAT 200 Phosphoglycerate kinase cytosolic OS=Triticum aestivum OX=4565 PE=2 SV=1 10.10 P82901|NLT2P_WHEAT 200 Non-specific lipid-transfer protein 2P OS=Triticum aestivum OX=4565 PE=1 SV=1 22.89 Q10A30|ALFC2_ORYSJ 200 Fructose-bisphosphate aldolase 2 cytoplasmic OS=Oryza sativa subsp. japonica OX=39947 GN=FBA2 PE=2 SV=1 5.23 Q9FRV0|CHIC_SECCE 200 Basic endochitinase C OS=Secale cereale OX=4550 GN=rscc PE=1 SV=1 5.12 P82900|NLT2G_WHEAT 200 Non-specific lipid-transfer protein 2G OS=Triticum aestivum OX=4565 PE=1 SV=2 21.57 P30271|AMYB_SECCE 200 Beta-amylase (Fragment) OS=Secale cereale OX=4550 GN=BMY1 PE=2 SV=1 12.95 P62787|H4_MAIZE 200 Histone H4 OS=Zea mays OX=4577 GN=H4C7 PE=1 SV=2 9.27 P01083|IAA2_WHEAT 200 Alpha-amylase inhibitor 0.28 OS=Triticum aestivum OX=4565 GN=IMA1 PE=1 SV=3 64.00 P10846|IAA3_WHEAT 200 Alpha-amylase inhibitor WDAI-3 (Fragment) OS=Triticum aestivum OX=4565 GN=IHA-B1-2 PE=1 SV=1 3.36