ON
DEVELOPMENT
O
ONN
Sub-Saharan africa in global trendS of
inveStment in renewable energy. driverS and the
challenge of the water-energy-land nexuS.
Prof giorgia giovannetti, University of Florence and European University Institute, dr elisa ticci, University of Siena
SynoPSiS
this paper explores recent patterns of domestic and foreign investments in renewable energies. It describes drivers and features of investment in renewable energies, with special attention to biofuels, highlighting that these forms of energy are likely to contribute to competition for land and water as the latter become increasingly scarce. ON EUROPEAN REPORT
DEVELOPMENT
O ONN 2This paper served as a background paper to the European Report on Development 2011/2012: Confronting scarcity: Managing water, energy and land for inclusive and sustainable growth. The European Report on Development was prepared by the Overseas Development Institute (ODI) in partnership with the Deutsches Institut für Entwicklungspolitik (DIE) and the European Centre for Development Policy Management (ECDPM).
Disclaimer: The views expressed in this paper are those of the authors, and should not be taken to be the views of the European Report on Development, of the European Commission, of the European Union Member States or of the commissioning institutes.
Contents
Contents 4
Tables, figures & boxes 5
Abbreviations 6
Executive Summary 7
1 Introduction 8
2 General trends and issues in (public, private and foreign) investment 10 3 Drivers of investment in renewable energy 13
3.1 Factors which boost investment in renewable energy 13
3.2 Barriers to investment in renewable energy 18
4 Global and regional trends in renewable energy investment 21
4.1 Total investments 21
4.2 FDI in renewable and alternative energy sector 24
5 Energy poverty and energy investment in sub-Saharan Africa 27
5.1 Trends in renewable energy investment in sub-Saharan Africa 28
6 Biofuel production in sub-Saharan Africa and the energy-land-water nexus31
6.1 The current wave of land investments 32
6.2 The state of biofuel development 34
6.3 The way forward 38
7 Concluding remarks 40
Appendix 1 – Land deals in SSA: a look at the data 42
Tables, figures & boxes
Tables
Table 3.1 The role of investment in modern renewable energy for achieving the MDGs 17
Table A1 Land deals by country, a comparison of different sources of information (in ha) 44
Table A2 Unsigned, pending and cancelled land deals 45
Table A3 Purposes of land deals, by country 46
Table A4 Value of land in selected countries 47
Table A5 Evidence of impacts of biofuel and biogas projects in sub-Saharan Africa 48
Figures
Figure 2.1 FDI to developing countries as % of GDP 10
Figure 2.2 Trends in FDI, private and public investment in SSA, 1980-2009 11
Figure 3.1 Energy and oil price index (base year 2005) 13
Figure 3.2 World oil demand (1000 barrels/day) 14
Figure 3.3 Regional distribution of energy use and of population, 2008 14
Figure 3.4 Net energy imports (% of energy use) 15
Figure 4.1 Global trends in total financial investment in renewable energy (US$ billion) 21 Figure 4.2 a-b Financial new investment in renewable energy by technology (US$ billion) 22 Figure 4.3 Global financial new investment in 2004–2010 by technology (US$ billion and %
shares) 23
Figure 4.4 a-b-c-d Investment in renewable energy by technology by top four countries and
Rest of World (RoW) 23
Figure 4.5 Trends in total financial investment in renewable energy in selected areas (US$
billion) 24
Figure 4.6 Value of greenfield FDI projects in energy sector 2003–2010 (US$ million) 25
Figure 4.7 Number of greenfield FDI projects in energy sector, 2003–2010 25
Figure 5.1 Net energy imports in sub-Saharan African countries – 2008 (Mtoe) 28
Figure 5.2 Total value of greenfield FDI projects in renewable energy sector by region, 2003–
2009* (US$ millions) 29
Figure 5.3 Trends in greenfield FDI projects in renewable energy sector by region, 2003–2008
(US$ millions) 30
Figure 5.4 Value of greenfield FDI projects in renewable energy sector in Sub-Saharan Africa’s
country, 2003-2009*(US$ millions) 30
Figure 6.1 World fuel ethanol production in 2006, million litres (ML) 35
Figure 6.2 Planned and executed biofuel investments in 22 SSA countries by ha of land
accessed for estate cultivation and by origin of lead investor 36
Figure 6.3 Land deals in Ethiopia, Madagascar and Mozambique by nature of investment 37
Figure A1 Percentage of arable land by country and years 42
Boxes
Abbreviations
ASEAN Association of South-East Asian Nations BNEF Bloomberg New Energy Finance
CEO Chief executive officer
CGE Computable general equilibrium
CIFOR Center for International Forestry Research
CO2 Carbon Dioxide
DRC Democratic Republic of Congo FDI Foreign direct investments GhG Greenhouse gas
HICs High Income Countries Kwh Kilowatt hour
LDCs Least Developed Countries LICs Low-income countries
MDGs Millenium Development Goals
MENA Middle East and North Africa MICs Middle-income countries ML Million litres
MNC Multinational corporation Mtoe Million Tons of Oil Equivalent NGLs Natural gas liquids
NGOs Non-governmental organisations ODA Official development assistance ODA Official development assistance
OECD Organisation for Economic Co-operation and Development OPEC Organization of the Petroleum Exporting Countries
PPPs Public–private partnerships RoW Rest of World
SOEs State-owned enterprises SSA Sub-Saharan Africa
Executive Summary
This paper explores recent patterns of domestic and foreign investments in renewable energies. It describes drivers and features of investment in renewable energies, with special attention to biofuels, highlighting that these forms of energy are likely to contribute to competition for land and water as the latter become increasingly scarce. The analysis focuses on trends and developments in sub-Saharan Africa (SSA). Here capital is particularly needed not only because of low rates of savings and domestic tax collection, but also to permit the higher rates of growth necessary to overcome developmental and energy gaps. Despite large oil and gas reserves, Africa is still very far from meeting its energy needs. But the financial gap is not the only obstacle. The paper identifies and discusses a range of institutional, market and technological barriers thwarting the likelihood of meeting energy goals. Investment in renewable energies, especially biofuels, represents a valuable opportunity to break the unfair and unsustainable pattern caused by the inability of the current energy system to satisfy the energy needs of the poor without also compromising the ability of future generations to satisfy their needs. But domestic and foreign investors play distinct roles, and to help local populations to fully benefit from investments, land and water rights have to be clearly defined and governments must make strong commitments to doing so. The paper also seeks to bring together scattered information on investment in land, renewable energies and biofuels, including recent public–private partnerships (PPPs).
1
Introduction
‘It’s time for Africa … There is an increasing recognition that the continent is on an upward trajectory; economically, politically and socially’ (Ernst & Young, 2011: j). Indeed, during the last decade, many developing countries, including in sub-Saharan Africa (SSA), have attracted private capital. Due to limited domestic resources, the expansion of the private sector has been heavily dependent on external capital resources. This is particularly so in SSA, which is characterised by very low domestic private resources because of the low tax base and saving rates (OECD and AfDB, 2010). Among foreign sources, official development assistance (ODA) is increasingly under discussion, while foreign direct investments (FDI) and remittances are becoming more central. Some have argued that FDI has ‘the potential to contribute to accelerating growth and progress towards reaching development goals in Africa’ (Ndikumana and Verick, 2008).
Against this background, this paper focuses on recent patterns of both domestic and foreign investment (FDI)1, with a focus on the renewable energy sector and its links with investments
in water and land, and on sub-Saharan Africa. Foreign private capital flows surged in the early noughties until the 2008–2009 global economic crisis. Yet it is far from obvious that FDI had the expected impact on growth and development in many developing countries. A recent literature review (Reiter and Steensma, 2010) shows that empirical findings on the role of FDI in economic development remain mixed, while Wooster and Diebel (2010) find that ‘evidence of intrasectorial spillovers from FDI in developing countries is weak, at best’. UNCTAD (2011) observes that the literature on crowding in (out) of domestic investments has had controversial results. The heterogeneity of evidence on the developmental impact of FDI is explained by a wide range of arguments: institutional and legal contexts, corruption and social capability, the degree of the competition or complementarities with local activities, the technological gap, the level of human capital and development of host economies, the development of financial markets and receptiveness to trade, as well as investment regulation and labour intensity in investment sectors.2 On the one hand, FDI cannot match the rapid pace
of development in many countries, particularly in SSA, and is often inappropriate due to the nature of the projects financed.3 On the other hand, the impact of FDI on growth and
employment depends crucially on the sector through which it is channelled. In terms of its impact on development, the type of FDI and its structural composition matter at least as much as its volume.
Bonassi et al. (2006), for instance, find that the developmental impact cannot be calculated at the aggregate level since the effects in different sectors are very different. If the impact of FDI in the primary sector is considered to be limited or even negative, further-reaching positive connections and spillovers are expected in the case of capital flow into the manufacturing sector.4 A closely linked issue is that not only do the effects on growth differ (in terms of
stimulus on domestic consumption, employment, etc.) but so do the externalities. For instance, some investments in water-intensive manufacturing industries can have positive growth effects in the short run but negative long-term impacts because of depletion of resources or pollution.5
1 We maintain that an investment-friendly environment attracts both domestic and foreign private capital and that there are several synergies between private and public investment, since the latter could improve the environment (for instance by financing infrastructures etc) and could therefore increase private investments, initiating a virtuous circle. 2 See for instance, Alguacil et al., 2011; Alfaro et al., 2004; Blomstrom et al., 1994; Balasubramanyam and Sapsford, 1996; Borensztein et al., 1998; Kemeny, 2010; Lim, 2001; Reiter and Steensma, 2010.
3 In SSA the needs are often higher than elsewhere, due to a higher poverty and the distance from attaining the MDGs. Furthermore, domestic funds are lower and foreign capital is lacking and at best concentrated in minerals/fuels, so that its development impact tends to be low.
4 See also UNCTAD, 2001; Aykut and Sayek, 2007; Chakraborty and Nunnenkamp, 2008; and Doythc and Uctum, 2011.
5 There has been a debate on the so-called ‘dirty industries’, which tend to be highly water-intensive and polluting. When environmental laws become more restrictive in developed countries these are outsourced to developing
In summary, both the source (domestic or foreign) and the sector of destination (services, manufacturing – whether ‘dirty’ or not – raw materials and further disaggregation) are crucial to assessing the development impact of investments: capital can be an important and powerful engine for growth, but its effects depend largely on its nature, the sectors in which it is focused, and to what extent – if any – there is a substitution effect between foreign and domestic investments.6
Against this background, this paper addresses FDI and domestic investment trends and characteristics by analysing specific sectors of destination. We focus on investment in renewable energy and in land. In the companion paper, Massa (2011) examines the drivers and challenges of investment in water sector.
The paper is structured as follows. After a brief sketch of the general trends in domestic and foreign investment in SSA (Section 2), it discusses drivers of and barriers to investments in renewable energy (Section 3), trends in investments, with a focus on renewable energies and SSA (Section 4). It then discusses the energy-land-water nexus and the current wave of land investments in SSA (Section 5), and draws conclusions (Section 6). An Appendix describes more in detail the recent land deals in SSA.
countries (often in those with weak institutions). For instance, water is used intensively in textile production (for cleaning, bleaching, dyeing etc), where several labour-intensive phases of productions are outsourced; also food manufacturing, thermal power, integrated circuits and electronic components, pulp and paper industries are water-intensive and highly polluting and often delocalised in developing countries. See for instance, Grether and de Melo (2003).
6 Erengha (2011) estimates the dynamic links between FDI in ECOWAS and provides a detailed survey of both theoretical and empirical literature on relationships between these different flows. He highlights the importance of sector: in manufacturing crowding-in prevails, while in the primary sector it is crowding-out.
2
General trends and issues in (public, private and
foreign) investment
The last decades have witnessed significant increase both in domestic capital and in the inflows of foreign direct investment to developing countries, where the gap between domestic savings and the desired level of investment has in many cases been filled by external resources, FDI being one of the most important. In the 1990s, FDI represented around 30% of total investments, rising to 50% by 2010: a substantial increase, despite a fall in 2009 in the aftermath of the economic and financial crisis and a limited recovery in 2010. Furthermore, in 2010, flows to developing and emerging countries for the first time ‘absorbed more than half of FDI global flows’ (OECD et al., 2011), a marked change from the past.
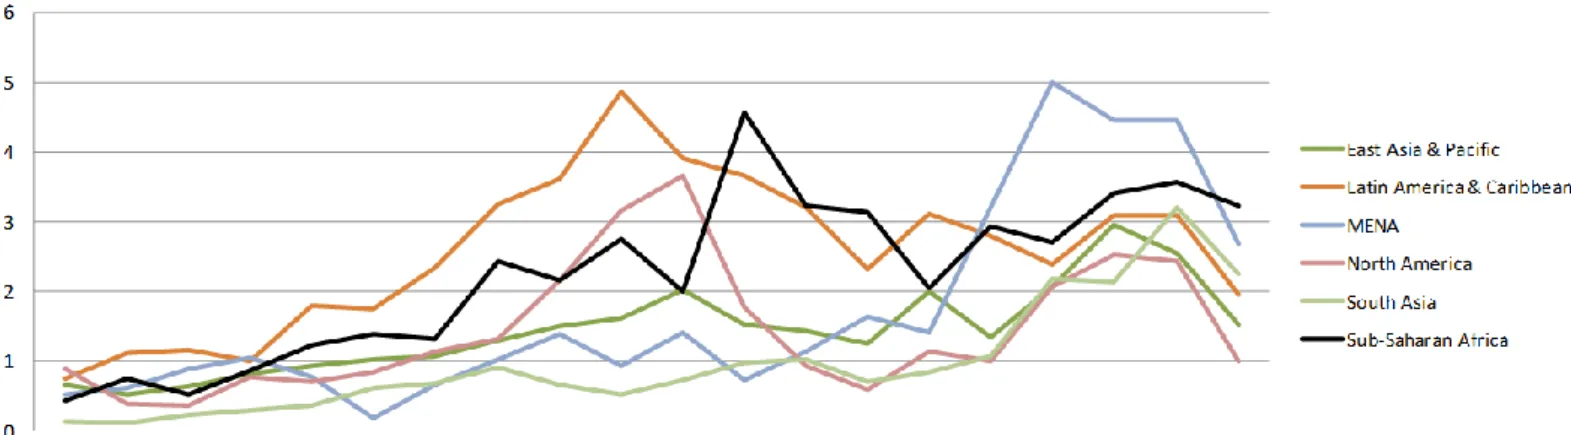
Figure 2.1 shows that the last 20 years are still characterised by differences in levels and patterns of FDI as a percentage of GDP across groups of developing countries.
Figure 2.1 FDI to developing countries as % of GDP
Source: UNCTAD, 2011
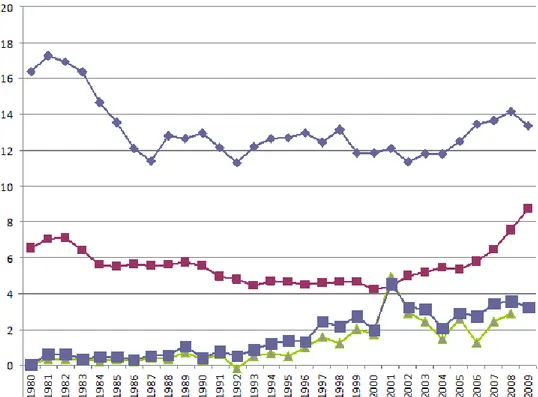
Until 2000, middle-income countries (MICs) (especially in Latin America) benefited more from foreign flows, while low-income countries (LICs) in general and SSA countries in particular were left behind. This is explained by higher investment risk, low liberalisation and weak infrastructure. Since 2000, however, there has been a rapid increase of capital flows. According to the African Economic Outlook (2011), total investment to Africa increased almost fivefold from 2000 to reach US$126 billion in 2010. And, even more importantly, FDI increased while official development assistance (ODA) declined. Figure 2.2 below shows the evolution of domestic and foreign investments in SSA countries as well as the private versus public investments (at home). It shows that, between 1980 and 1995 private and public domestic capital fell while FDI was low but fairly stable. After 1995 average growth in FDI has been greater than domestic private flows. Public flows after a long period of stagnation (1980–2001) have recovered since 2005 (see also Ernst & Young, 2011).
Figure 2.2 Trends in FDI, private and public investment in SSA, 1980-2009
Source: African Development Indicators, accessed September 2011
Trends in domestic and foreign investment are closely connected. Ndikumana and Verick (2008), for example, find that in SSA the relationship runs both ways, but the impact of private domestic investment on FDI is stronger and more robust than the reverse relation. This suggests that strong private investment is likely to act as a signal and attract foreign capital. Given their close links, both domestic and foreign investment is likely to be driven by similar factors. Indeed, a widespread negative perception of SSA affected both domestic and foreign investments up to the early noughties (the lost decades). Things have recently changed (McKinsey, 2010; Ernst & Young, 2011; Radelet, 2010), as also shown by developments since 2005 (Figure 2.2).
FDI to some countries in SSA increased in absolute terms and as a share of GDP, fuelled by high commodity prices and improved macroeconomic stability and investment environment (World Bank Doing Business indicators, Ernst &Young, 2011). The increase was higher in Africa than in emerging economies in other continents (though the level is still lower, as pointed out by Ernst &Young, 2011).7 This growth pattern continued until the start of the global economic
crisis in 2008–2009, which reduced the total amount of funds and led to delays or cancellations of investment projects (Brambila-Macias and Massa, 2010; Allen and Giovannetti, 2011). In SSA the risks can be high, but so can profits, with competition in some sectors comparatively low.8 According to Ernst & Young (2011) ‘This investment window may not remain open for
long, but it suggests that Africa actually appears to be relatively well positioned, with the only emerging region clearly ahead in terms of investor perceptions at this time being Asia’ (p. 9). Over the last decade ‘FDI’s share of gross fixed capital formation in Africa has, at 20%, been
7 Since 2005 Africa has attracted more FDI than ODA.
8 Warnholz (2008) presents very interesting comparisons of profitability at macro and micro (firms) level, showing that investments in Africa (at least the countries of his sample) can be very profitable and that the main problem in exploiting the potential is the low level of human capital.
twice the global average and 8% above that of other developing countries’ (African Economic Outlook, 2011: 44).
Despite the marked improvement of the last few years, there are still a number of elements deterring investments in African countries with respect to other developing countries: political risk and often inadequate human capital, macroeconomic instability, low productivity, exchange rate volatility and lack of infrastructure9 (Asiedu, 2001; Razafimahefa and Hamori,
2005; Khadaroo and Seetanah, 2007; Ernst & Young, 2011). In highly unstable situations such as the current period of multiple crises, with uncertain environment and property rights, a significant obstacle to high-risk investment is that of contract enforceability and lack of commitment not to default. Recent research has also pointed to the importance of a sound legal framework and stable political environment to attract (foreign) capital, as well as to the influence of a country’s history of default. A related issue concerns the lack of capacity to manage public resources, which can lead to substantial problems of corruption.10 The existence
of good institutions in general helps to attract – and keep – FDI (Naudé and Krugell, 2007). However, this view is sometimes challenged in relation to Africa: in some sectors (e.g. manufacturing) foreign investments ‘crowd in’ domestic investments and in others (e.g. primary sector) they ‘crowd them out’,11 while some specific investments, for instance those in
land and ‘dirty industries’, are often outliers as they tend to be focused on countries with weak governance in order to avoid strict rules and laws. Furthermore, according to Egger and Winner (2005) in the presence of excess regulation, weak enforcement rules and government bureaucracy, corruption provides a helping hand to foreign investors rather than being a disruptive element).
Data on domestic and foreign capital flows at sectoral level are at best scattered. Given abundant natural resources in SSA it is not surprising that extractive industries are a major area for foreign investment. Recently, however, many investors have started to diversify, investing in tourism, consumer products, construction, telecommunications, financial sectors, land and renewable energies (Ernst & Young, 2011:31; McKinsey, 2010; UNCTAD, 2011). In the following section, we analyse trends in and drivers of investment in different areas of renewable energy in order to assess how far the global energy market is evolving towards a green and equitable energy system. We focus on trends in renewable energy investment in SSA, with particular reference to biofuel investment. Sub-Saharan Africa is characterised by high rates of energy poverty, a large gap in energy financing, and water scarcity, and is attracting large-scale land investments for biofuel projects. This review will shed some light on the interrelationships between energy, land and water, a nexus that is receiving growing attention (e.g. Bazilian et al., in press) together with a greater awareness of increasing scarcity of natural resources.
9 Adequate public infrastructure (for instance through public investment) reduces the costs of doing business and increases the marginal return to investment.
10 One solution is a mechanism that creates external controls on revenue-generating entities.
11 Erengha (2011) claims that this is related to the different elasticity of the demand for export in different sectors. There is a need for further analysis at more disaggregated level to examine these issues.
3
Drivers of investment in renewable energy
Recent oil-price fluctuations around a general upward trend have revealed the growing vulnerability and limits of a global energy system that relies on non-renewable resources. In particular, the current energy system has largely failed to meet energy needs of the poor while also compromising the ability of future generations to satisfy their needs. The large-scale deployment of renewable energy could be a valuable opportunity to break out of this unfair and unsustainable pattern. Global investment in renewable energy grew from US$33 billion in 2004 to US$211 billion in 2010 (UNEP and BNEF, 2011). Yet, after years of international policy commitments to deploy low-carbon technologies, renewable energy sources accounted for only 16% of global final energy consumption in 2009. If we exclude traditional biomass and hydropower, the other renewables (solar, modern biomass, wind, geothermal, and biofuels) accounted for only 3% of world final energy consumption (REN21, 2011). In 2010, total investment in renewable energies, including hydroelectric power, reached US$233 billion, of which US$187 billion financed generation, approaching investment in fossil-fuel power plant, which was estimated at US$219 billion. However, if investment in energy also includes coal, gas and other upstream investment costs the estimate rises to US$1.2 trillion in 2010 (UNEP and BNEF, 2011). Thus, at global level, the renewable energy sector is growing fast but from a very small base. A series of factors have contributed to this pattern.
3.1
Factors which boost investment in renewable energy
The role of fossil fuels ‘scarcity’: One factor that is fostering renewable technologies
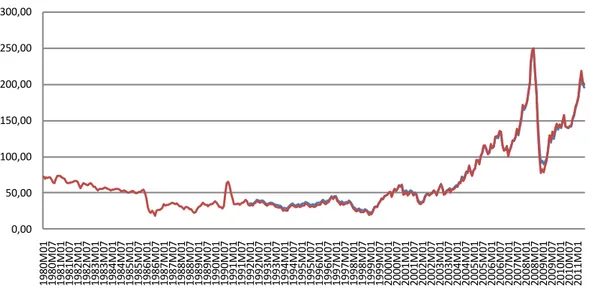
investment is the recent trends and future projections of the high and growing price of fossil fuels. Until the 1990s and early 2000s, the global economy was characterised by a polarisation between a narrow elite of countries in the ‘North’ that import commodities and energy from the ‘South’, which supplied these goods in a context of resource abundance and high price elasticity. Development in the North has been characterised by unsustainably high energy intensity. The emergence of a group of new industrialised small countries did not alter this equilibrium and supply continued to accommodate increased demand, which contained the effect on prices – with the exception of the 1970s energy crises, which were caused mainly by geo-political factors. This situation is changing. The New Industrialised Countries (mainly China and India) are real giants with huge populations. Moreover, starting from weaker environmental regulations and technological development, their production tends to be highly energy-intensive. As a result, their economic boom has brought a rapid increase in demand for energy and primary commodities, leading to rising oil prices (Figure 3.1).
Figure 3.1 Energy and oil price index (base year 2005)
Source: IMF 0,00 50,00 100,00 150,00 200,00 250,00 300,00 19 80 M 01 19 80 M 07 1 9 8 1 M 0 1 1 9 8 1 M 0 7 19 82 M 01 19 82 M 07 1 9 8 3 M 0 1 1 9 8 3 M 0 7 19 84 M 01 19 84 M 07 1 9 8 5 M 0 1 1 9 8 5 M 0 7 19 86 M 01 19 86 M 07 19 87 M 01 1 9 8 7 M 0 7 1 9 8 8 M 0 1 19 88 M 07 19 89 M 01 1 9 8 9 M 0 7 1 9 9 0 M 0 1 19 90 M 07 19 91 M 01 19 91 M 07 1 9 9 2 M 0 1 1 9 9 2 M 0 7 19 93 M 01 19 93 M 07 1 9 9 4 M 0 1 1 9 9 4 M 0 7 19 95 M 01 19 95 M 07 1 9 9 6 M 0 1 1 9 9 6 M 0 7 19 97 M 01 19 97 M 07 19 98 M 01 1 9 9 8 M 0 7 1 9 9 9 M 0 1 19 99 M 07 20 00 M 01 2 0 0 0 M 0 7 2 0 0 1 M 0 1 20 01 M 07 20 02 M 01 20 02 M 07 2 0 0 3 M 0 1 2 0 0 3 M 0 7 20 04 M 01 20 04 M 07 2 0 0 5 M 0 1 2 0 0 5 M 0 7 20 06 M 01 20 06 M 07 2 0 0 7 M 0 1 2 0 0 7 M 0 7 20 08 M 01 20 08 M 07 20 09 M 01 2 0 0 9 M 0 7 2 0 1 0 M 0 1 20 10 M 07 20 11 M 01
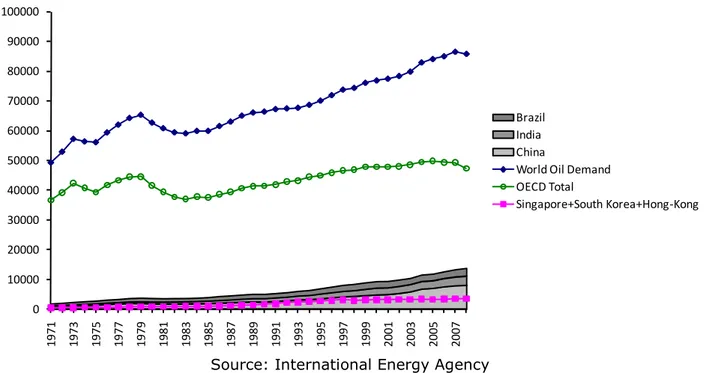
This pattern is reflected in global trends of energy use and demand. Between 1993 and 2008, world demand for oil grew by 27% compared to a rise of 5% in the previous 15 years; the Asian Tigers’ contribution to the global oil demand is quite modest in the entire period, while Brazil, India and China account for a significant and increasing share of the increased demand (Figure 3.2).
Figure 3.2 World oil demand (1000 barrels/day)
Source: International Energy Agency
Per-capita energy use in HICs has been always between four and ten times higher than in the rest of the world (WDI data): they represent less than 17% of the global population but account for almost 48% of global energy use (Figure 3.3).
Figure 3.3 Regional distribution of energy use and of population, 2008
Source: WDI
Moreover, at regional level, HICs and South Asia (mainly driven by India) were until the mid-2000s the only net energy importers (Figure 3.4). With China’s booming energy demand, whose share of global energy use rose from 11% in 2000 to almost 18% in 2008, the East Asia and Pacific region has been a net energy importer since 2006.
The growth in world energy demand is projected to reach more than 40% more than current levels by 2030 (OPEC, 2010). Even assuming cautious implementation of current government policy commitments, oil demand will rise constantly: in this scenario, energy demand is estimated to grow by 36% between 2008 and 2035 and fossil fuels will continue to represent over 50% (OECD/IEA, 2010). 0 10000 20000 30000 40000 50000 60000 70000 80000 90000 100000 1971 1973 1975 1977 1979 1981 1983 1985 1987 1989 1991 1993 1995 1997 1999 2001 2003 2005 2007 Brazil India China
World Oil Demand OECD Total
Singapore+South Korea+Hong-Kong
East Asia & Pacif ic; 22,3%
Latin America & Caribbean ; 6,1% Middle East & North
Af rica; 3,6% Sub-Saharan Af rica; 4,2% Europe & Central
Asia ; 10,2% South Asia; 6,4% High income countries; 47,7%
Regional energy use as a share of world energy use, 2008
East Asia & Pacif ic; 28,8%
Latin America & Caribbean ; 8,5% Middle East & North
Af rica; 4,9% Sub-Saharan
Af rica; 12,2% Europe & Central
Asia ; 6,0% South Asia; 23,1%
High income countries; 16,6%
Figure 3.4 Net energy imports (% of energy use)
Source: WDI
Other supply-side factors can push oil prices up. Public opinion and international NGOs exert growing pressure to consider environmental and social damage often associated with resources extraction. This greater awareness of externalities in the production of fossil fuels can make them more costly or create supply constraints. With the exception of Latin America, in non-OPEC countries, for instance, the supply of oil crude and natural gas liquids (NGLs) is forecasted to flatten or decline and in OECD countries especially, increasing costs and stricter regulations are regarded as possible factors that will contribute to a decline in crude oil production (OPEC, 2010). In sum, although reserves of fossil fuels are not yet scarce they are no longer available at such low cost. According to the International Energy Agency (OECD/IEA, 2010), because supply and demand are becoming less sensitive to oil prices this will lead to price rises. Indeed, in the last few years, the correlation between price commodities and world economic growth rate has increased and, as noted by Lopez (2011), for the first time in history, the recent oil-price shock was linked to a spike in demand rather than to political factors or other exogenous factors.
Energy security: governments’ reluctance to depend on the Middle East and on oil-producing
countries facing political turmoil has contributed to the development of renewable energy. Renewable energy sources are better distributed across regions than fossil fuels, which tend to be highly concentrated. Moreover, the production of renewable energy has spread worldwide, especially in Europe and Asia. This geographical expansion increases the trust that renewable energy markets are less vulnerable to political instability and the policy options of specific countries (REN21, 2011).
Declining costs and competitiveness gains of several renewable energy technologies:
production and distribution costs may constrain the competitiveness and economic viability of renewable energies. Indeed, the IPCC (2011) estimates that the average lifetime costs of many renewable energy-generating systems are higher than current energy prices, although there are large variations across regions and sources of energy. However, the reduced cost of solar PV, wind turbines and biofuel processing has contributed to the growth of the renewable sector (REN21, 2011) to the extent that some applications are becoming economically viable. BNEF analyses show that prices of solar modules, for instance, have more than halved since 2008 and that small solar projects are more competitive, especially in sunny places (such as
-80 -60 -40 -20 0 20 40 1971 1973 1975 1977 1979 1981 1983 1985 1987 1989 1991 1993 1995 1997 1999 2001 2003 2005 2007
East Asia & Pacific (developing only) High income
Latin America & Caribbean (developing only)
Sub-Saharan Africa (developing only)
South Asia China
Italy and Turkey) where prices have gone down to US$22 cents/kwh (BNEF, 2011). A World Bank study (Kulichenko and Wirth, 2011) estimates that the costs of several components for concentrating solar thermal power will decrease by between 15% and 30% by 2020. Learning by doing and economies of scale are expected to further reduce costs as the technology spreads. Some promising signals on competitiveness also come from developing countries. In a study on Ethiopia, Ghana and Kenya, Deichmann et al. (2011) find that in several rural areas, although decentralised renewable power has a higher unit production cost than fossil electricity, it is competitive compared to centralised power provision, usually based on fossil fuels, once the cost of extending transmission and distribution are taken into account. Nouni et al. (2008) found similar results in areas of rural India.
International efforts to combat climate change: the IPCC estimates that fossil fuels
contribute to more than half of anthropogenic greenhouse gas (GhG) concentrations that are the main cause of the global warming. The extensive deployment of renewable energies is one of the main options to mitigate GhG emissions. Existing evidence shows that, in general, renewable energy technologies produce significantly lower lifecycle GhG emissions than those generated by non-renewable resources, although the GhG balance for bioenergy generation critically depends on land-use management and indirect effects in terrestrial carbon stocks (IPCC, 2011).
It is estimated (OECD/IEA 2010) that, in order to meet the goal agreed at the 2009 UN Climate Change Conference in Copenhagen to limit the global temperature increase to 2°C, over 60% of the contribution to reducing global warming between 2010 and 2035 should come from renewable plants improvements, even when greater energy efficiency is included. The international agenda against climate change, therefore, is pushing for a large-scale deployment of renewable energy technologies.
MDG agenda: increasing awareness that the attainment of the MDGs depends on the
development of renewable energy is another factor behind investment in this sector, since it can contribute to enhancing access to reliable and affordable energy in poor countries and for poor populations. Reducing energy poverty is critical to the MDGs since energy is behind all human activities. Several studies and institutions have underlined the link between each MDG and access to modern energy sources, renewable or non-renewable (Modi et al., 2005; GNESD 2007; Bazilian et al., 2010; OECD/IEA, 2010). Renewable energy, however, presents several advantages. Many applications are devised to produce decentralised electricity and energy and several renewable energy sources, such as wind, solar irradiance, crop residues and animal wastes are often widespread in rural areas. This means that they could be harnessed to provide energy to rural areas, which are usually the poorest and the most excluded from energy access since the cost of grid connection and fuel transport seriously impede access and investment. Some renewable energy applications (such as solar energy for water heating, bioenergy for transport, heating, cooking and lighting) can also serve informal settlements in peri-urban areas where many households are not served by the electricity grid. Finally, in non-oil-producing countries the development of renewable energy can reduce dependence on imports of oil, coal and natural gas (see Table 3.1).
Table 3.1 The role of investment in modern renewable energy for achieving the MDGs
MDGs Investment in modern renewable energy
MDG 1: Eradicate extreme poverty
Access to modern, affordable and sustainable energy and electricity sources can enhance household incomes by increasing production and work hours, labour productivity, educational attainment and health conditions and by reducing the burden of time-consuming domestic labour.
Energy access enhances returns to labour and productive assets as well as labour and business opportunities since energy services such as lighting, heating, cooking, locomotion, mechanical power, transport and telecommunications are essential for economic activities and socioeconomic development.
Providing more energy for agriculture, irrigation and transport will increase food production and food security, thus helping alleviate world hunger.
MDG 2 and 3: Achieve universal primary education and promote gender equality and empower women
Access to energy can reduce child labour by increasing adults’ productivity.
Access to energy reduces time-consuming domestic work needed to collect traditional fuels, fetch water, prepare food or perform other labour-intensive chores. This may enable children to attend school and to study at home. Women can be more productive and also have more opportunities to participate in social and community life, which may contribute to their economic and social empowerment.
Street lighting improves safety, facilitating children’s school attendance and women’s participation in community activities.
Electricity facilitates access to telecommunication services.
MDG 4, 5 and 6: Reduce child mortality; improve maternal health; combat HIV/AIDS, malaria and other diseases
Substitution of cooking, heating and lighting systems based on traditional biomass with modern appliances reduces indoor air pollution, which causes respiratory diseases, and facilitates the use of boiled water, which reduces the risk of waterborne diseases, a major cause of child mortality.
Pumping and treating water, which requires energy, contributes to a clean water supply.
Having electricity enables health facilities to stay open longer, maintain a cold chain, and improve their general functioning. Transport and communication facilitate access to healthcare and emergency medical services and information campaigns to combat preventable diseases.
MDG 7: Ensure environmental sustainability
Most modern renewable energy sources produce fewer GhG emissions and are less polluting, and make
less intensive use of water and natural resources than non-renewable and traditional biomass energy. Thus, their large-scale development can contribute to global and local environmental sustainability.
All these factors create market incentives for investment in the renewable energy sector and encourage governments to introduce enabling policies such as incentives, subsidies and targets. Between 2005 and 2011, the number of countries adopting targets or policy measures to favour renewable energies rose from 55 to 119, over half of which are developing countries (REN21, 2011). Policy support seems to be one of the main drivers of investments in renewable energy in view of the large range of market policy, institutional and information barriers the sector faces. It is widely recognised that without government support the renewable energy industry cannot take off and that governments have played a crucial role in fostering the development and deployment of renewable energy technologies.
3.2
Barriers to investment in renewable energy
Recent studies suggest that a complete transition to a renewable energy system is economically and technically feasible. Jacobson and Delucchi (2011) simulated an energy system that could meet the world’s energy needs from wind, water, and sunlight. They find that energy costs might be similar as today’s, and that the development of such a system is unlikely to be constrained by the availability of raw materials such as steel, platinum or lithium. Fthenakis et al. (2009) find that solar energy alone has the technical, geographical, and economic potential to provide more than one third of US energy needs by 2050. Despite these encouraging findings, several barriers still hinder the large-scale development of renewable energy, especially in the poorest countries.
Unfavourable relative prices: subsidies to conventional energy, cheap gas and exclusion of externalities: Fiscal support for fossil fuels, such as fuel subsidies, exploration
concession waivers, investment tax holidays, export guarantees and soft loans, still obtain in many countries, especially but not exclusively in oil-rich nations. In non-OECD countries, governments use subsidies on the consumption and production of fuel to enhance access to energy, reduce dependence on traditional biomass energy and sustain economic growth and employment. Consumption subsidies are rare in OECD countries, but production subsidies are quite widespread – although in 2009, G-20 leaders committed themselves to phasing out and rationalising fossil-fuel subsidies. These financing mechanisms work against investment in renewable energy since they undermine their competitiveness and discourage the transition to clean energy production. To illustrate their importance, the IEA estimates that in 2009 government subsidies for fossil-fuel final consumption and electric power generation amounted to US$312 billion globally12 compared to only US$57 billion in total government support for
electricity from renewables and for biofuels. Interestingly, the average annual investment required to achieve universal access to modern forms of energy by 2030, estimated at US$36 billion, would be less than 8% of 2009 global consumption subsidies for fossil fuels (OECD/IEA 2010).
Natural gas represents an important challenge to renewable energy. According to UNEP and BNEF (2011), low prices of natural gas have undermined renewable energy projects especially in the wind and solar sectors. If such competition grows, given that increased demand, abundant recoverable resources, and increasing international trade in natural gas make its prospects very promising (OECD/IEA 2011).
The pricing of different energy sources exludes both externalities of energy production and uses and their potential contribution to reducing GhG emissions or other adverse social and environmental impacts. A study conducted in Senegal, for instance, shows, that in three remote rural regions, once environmental externalities are taken into account, the electricity from PV technologies costs less than energy from grid extension (Thiam, 2010).
Costs and financing barriers: as mentioned above, several renewables are not
cost-competitive in current market conditions. The levelised cost of electricity for renewable energy sources, in many cases, has a higher range than that of traditional power sources (IPCC 2011).13 Moreover, high up-front capital costs, immaturity of technologies, uncertainties 12Note that 37 countries account for 95% of global subsidies for consumption of fossil fuels.
13 A recent World Bank study (Kulichenko and Wirth, 2011) finds that in several emerging economies (such as in India, Morocco, and South Africa) the levelised cost of electricity for concentrating solar thermal power are still too
regarding prices and regulatory frameworks, inadequate data and mapping of the technical potential of renewables, can increase the financial and premium risks of the projects, which heightens investors’ perception of risk and hampers their access to financing.
Costs are decreasing, but most analysts and researchers agree that policy support is needed in order to make renewable energy more competitive and promote its large-scale development (IPCC, 2011; OECD/IEA, 2010, 2011; UNEP and MISI, 2009; Hamilton, 2010). Based on evidence from MENA countries, India and South Africa, Kulichenko and Wirth (2011), for instance, underscore several regulatory frameworks that could help in improving the economic and financial affordability of concentrating solar thermal power, such as properly designed feed-in tariff schemes, combined with auctioning mechanisms, Renewable Portfolio Standard schemes, concessional financing, sovereign guarantees for power purchase agreements for solar thermal power projects. Looking at a different aspect of renewable energy competitiveness and diffusion, namely innovation capacity, Johnstone et al. (2010) show that public policies, from public expenditures on R&D to feed-in-tariffs, and renewable energy certificates, had a positive influence on patent activity in OECD countries over the period 1978–2003.
Integration of renewable energy with the current energy system: This requires
institutional and market changes as well as the adaptation and expansion of current infrastructure. Substantial efforts are required in order to create hybrid, flexible and integrated energy systems since distribution, variability, production scale and techniques greatly differ from those of dominant fossil-fuel energy systems. Integration into the current energy system, therefore, can represent a narrow bottleneck for the large-scale development of renewable energy. Available evidence based on stakeholder surveys in ASEAN countries show that grid-connection and infrastructure barriers are major concerns for investors in the renewable energy sector (Ölz and Beerepoot, 2010). Where conventional power grids are underdeveloped, as in most SSA countries, the challenges to create efficient and reliable energy networks with a high renewable energy penetration are even greater.
Low competition, monopoly or oligopoly market structure: In several countries, energy
and power sectors are characterised by a monopolistic or oligopolistic structure. Foster and Briceño-Garmendia (2008) find that state-owned enterprises (SOEs) in SSA manage the largest share of public expenditure on infrastructure, the power sector included, and Nkwetta et al. (2010) observe that in many cases national energy supply is based on a monopoly. Ölz and Beerepoot (2010) underscore that in the ASEAN region the power sector is characterised by the dominance of state-owned or controlled utilities. In these contexts, independent power producers might face serious entry-market obstacles due to low competition, centralised infrastructure, institutional arrangements and prevailing standards, which are conceived for concentrated market structures.
Low awareness of benefits, information barriers, lack of human capital: In addition to
the capacity to pay, consumers’ and policy-makers’ awareness of potential benefits, applications, technically and economically feasibility of renewable energy technologies are a key determinant of political commitment to their development as well as of demand for renewable energy.14 These factors, in turn, can exert a negative influence on investors’
decisions. At the same time, the shortage of trained technical personnel to operate and maintain the energy systems and inadequate expertise on the part of energy regulators can discourage demand and investments in the sector (Ölz and Beerepoot, 2010).
Social barriers: Popular opposition to the use or production of renewable energy can be
another barrier to investment. Cooking habits, for instance, help to explain why in some cases the installed improved fuelwood stoves are not used (Bailis et al., 2009; Neudoerffer et al., 2001; Zuk et al., 2007). Concerns about the implications for biodiversity and the landscape can also undermine social acceptance of renewable energy plants, but the strongest resistance is likely to come from population groups claiming land and water rights. As discussed in the
high and projects at current investment costs have a rate of return that make it impossible to meet commercial infrastructure investment requirements.
14 One of the key messages of 2011 Bloomberg New Energy Finance Summit, for instance, points out that decision-makers are insufficiently informed about the options, progress and benefits of renewable energy (BNEF, 2011).
section on land and biofuel investment, the expansion of the area under biofuel cultivation can reduce or hamper local uses of land and water. While they are not the focus of this paper, large hydropower plants and dams can also have devastating effects on downstream communities and in causing population displacement.15
15The Report of World Commission on Dams (2000) is clear in this sense. One of its main findings is that, despite the significant contribution of dams to human development, ‘[i]n too many cases an unacceptable and often unnecessary price has been paid to secure those benefits, especially in social and environmental terms, by people displaced, by communities downstream, by taxpayers and by the natural environment’ (p. xxviii).
4
Global and regional trends in renewable energy
investment
The key role of policy measures, specific institutional arrangements, coordination and integration between different energy sources and existing energy networks, and access to capital and information is mirrored by the trends and spatial distribution of renewable energy investment. High-income countries and some emerging economies, which enjoy greater policy support, purchasing power and investment capacity, lead the sector, while poorer areas are still at the margins of this growing market.
4.1
Total investments
16As mentioned above, the renewable energy sector is experiencing rapid growth: between 2004 and 2010, global investment rose at a compound annual growth rate of 36% (UNEP and BNEF, 2011). Overall, the impact of financial crisis was relatively contained, albeit with some variations across regions, technologies and types of investment.
The total investment in renewable energy companies and utility-scale (medium and large) generation and biofuel projects (Figure 4.1) rebounded in 2010 after a downturn in 2009, which was mainly due to a 18% decline in investment in Europe and USA as a result of the financial and economic crisis. However, the global trend in total renewable energy investment was constantly positive thanks to an increase in government expenditure in R&D, rapid expansion of small projects in some HICs17 and, above all, China’s performance, which more
than doubled financial investment in renewable energy between 2008 and 2010, from US$23.9 billion to US$48.9 billion.
Figure 4.1 Global trends in total financial investment in renewable energy (US$
billion)
16 Figures in this section are drawn from the Bloomberg New Energy Finance’s (BNEF) data reported in Global Trends in Renewable Energy Investment 2011 (UNEP and BNEF, 2011) unless otherwise specified. Renewable energy projects include all biomass, geothermal, and wind-generation projects of more than 1 MW, all hydro projects of between 0.5 and 50 MW, all solar power projects of more than 0.3 MW, all ocean energy projects, and all biofuel projects with a capacity of 1 million litres or more per year. BNEF defines utility-scale solar parks as greater than 500 kW in capacity. 17Notably Germany, Italy and the USA.
19 43 76 33 57 90 129 159 160 211 132 143 122 111 0 50 100 150 200 250 2004 2005 2006 2007 2008 2009 2010
Europe and North America China India
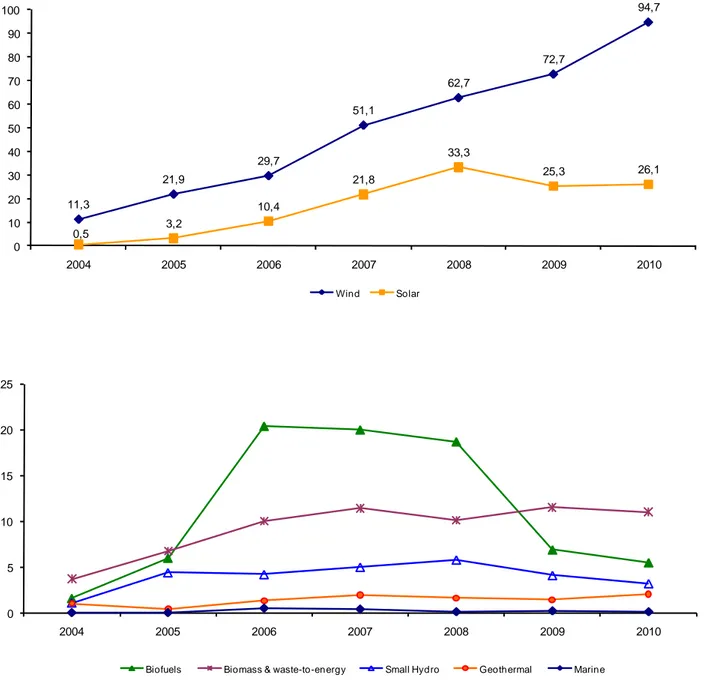
Investment trends in the renewable energy sector investment also vary across technologies (Figure 4.2.a-b). Biofuel investment rose to US$20 billion in 2006–2008, in conjunction with the oil price shock, but has since reverted to the 2005 level (around US$6 billion) with the persistence of the global economic crisis. Investment in biomass and waste-to-energy sectors was less affected by the economic crisis as it steadily increased over the 2004–2010 period. Investment in small-hydro, geothermal and marine energy presents a stable trend fluctuating around much lower levels (US$4 billion, US$1.4 billion and US$0.2 billion, respectively). The dominant sectors in investment trends are wind and solar energy. The global economic downturn did not affect total investment in wind energy, which benefited from mega-projects in China and rose from US$12 billion to US$94 billion between 2004 and 2011, accounting for 53% of all investment in renewables over the period (Figure 4.3). Starting from a very low base (US$0.4 billion in 2004), solar energy saw investment peaking at US$33 billion in 2008. Despite a 24% slowdown in 2009, it still attracted about 20% of all investment in renewable energy over the period, the second highest by sector.
Figure 4.2 a-b Financial new investment in renewable energy by technology (US$
billion)
11,3 21,9 29,7 51,1 62,7 72,7 94,7 0,5 3,2 10,4 21,8 33,3 25,3 26,1 0 10 20 30 40 50 60 70 80 90 100 2004 2005 2006 2007 2008 2009 2010 Wind Solar 0 5 10 15 20 25 2004 2005 2006 2007 2008 2009 2010Figure 4.3 Global financial new investment in 2004–2010 by technology (US$ billion
and % shares)
The renewable energy sector is also characterised by a pronounced geographical concentration. In 2010, four countries accounted for about 70% of existing and added capacity in wind power and PV solar markets, while four countries covered more than 75% of global biofuel production and solar water heating installed capacity (Figure 4.4). China leads the wind and solar hot-water sectors, the USA accounts for 20% of total wind capacity and it is the top producer of biofuels, followed by Brazil. Germany is one of the top markets in solar PV and wind power capacity and investment. Given that the technical potential and supply of renewable energies tend to be more evenly distributed than fossil fuels, such a spatial concentration of renewable energy production and investment indicate that institutional, policy and economic factors hinder the expansion of this sector.
Figure 4.4 a-b-c-d Investment in renewable energy by technology by top four
countries and Rest of World (RoW)
Source: REN21, 2011. Data cover all biomass and wind-generation projects of more than 1MW, all solar projects of more than 0.3MW, and all biofuel projects with a capacity of 1 million litres or more per year.
Wind ; 344,1; 53% Solar ; 120,6; 19% Biofuels ; 79,1; 12%
Biomass & waste-to-energy; 64,4; 10%
Small Hydro; 27,8; 4% Geothermal ; 9,6; 2% Marine ; 1,3; 0%
Trends in renewable energy investment exhibit the same spatial concentration. As shown in Figure 4.5, Europe, North America and the largest emerging economies (Brazil, China and India) attract the bulk of global investment in renewables. In 2010, all other countries combined accounted for about 12% of total new investment, although they saw a growing interest in the renewable energy sector. In South America (Brazil excluded), investment increased from US$0.1 billion in 2004 to US$2.1 billion in 2009 before jumping to US$6.2 billion in 2010. Africa and the Middle East also experienced a strong acceleration of renewable energy investment in the last years, but from a far lower base.
Figure 4.5 Trends in total financial investment in renewable energy in selected areas
(US$ billion)
4.2
FDI in renewable and alternative energy sector
It is not easy to analyse the role of FDI in the renewable energy sector since data disaggregated by country and sector are not always collected systematically or are not fully comparable with information on total energy investment flows. We try to delineate trends in FDI in renewable energy using the fDi Markets database of the Financial Times Ltd, one of the most widely used databases on greenfield investment projects. Figure 4.6 reports the estimated global value of greenfield FDI projects in alternative and renewable energy compared to other sectors, by sector from 2003 to 2010, while Figure 4.7 shows the number of FDI projects in renewable and non-renewable energy sector over the same period.
According to fDi Markets data, the total value of greenfield FDI projects in alternative and renewable energy over the 2004–2010 period is estimated at US$312 billion, while Bloomberg New Energy Finance’s (BNEF) data recorded US$430 billion of asset financing18 of utility-scale
renewable energy projects in the same period. Thus, FDI seems to play an important role in financing new projects, but the evidence does not permit any further conclusions to be drawn about the contribution of foreign capital to renewable energy investment because of the difference in coverage between the two data sources.19
18 Asset financing is defined as all money invested in renewable energy generation projects, whether from internal company balance sheets, from debt finance, or from equity finance.
19 For instance, the fDi Markets database, unlike the Bloomberg New Energy Finance’s (BNEF) database, includes only greenfield projects and does not specify upper limit of project scale, covering also large hydropower plants.
0 0 0.9 0.8 1.3 1.7 1.4 0.3 0.1 0.6 0.7 1.1 0.7 3.6 2.8 3.6 5.3 6.9 6.4 4.4 6.6 0.1 1.0 0.5 1.3 2.5 2.1 6.2 0 1 2 3 4 5 6 7 8 2004 2005 2006 2007 2008 2009 2010
Figure 4.6 Value of greenfield FDI projects in energy sector 2003–2010 (US$ million)
Source: UNCTAD (2011) based on Financial Times Ltd, fDi Markets. Data refer to estimated capital investment.
Figure 4.7 Number of greenfield FDI projects in energy sector, 2003–2010
Source: UNCTAD (2011) based on information from the Financial Times Ltd, fDi Markets. Note: Data refer to estimated capital investment.
The estimated value of greenfield FDI projects in renewable energy surged from US$8.2 in 2003 to more than US$93 billion in 2008. In this period, renewable energy was one of the fastest-growing sectors in terms of greenfield FDI projects, together with business activities, non-renewable energy and, to a lesser extent, food, beverages and tobacco. Starting from very low levels, in 2008–2009 renewable energy greenfield FDI reached values that were similar to those of other important sectors, such as machinery and electronic equipment, but also transport equipment and transport, storage and communications.
0 50000 100000 150000 200000 250000 300000 350000 400000 2003 2004 2005 2006 2007 2008 2009 2010
Coal, oil and natural gas
Alternative/renewable energy
Textiles, wood and wood products
Rubber, chemical and plastic products
Machinery and equipment, electrical and electronic equipment
Motor vehicles and other transport equipment
Transport, storage and communications
Business activities
Food, beverages and tobacco
-100 200 300 400 500 600 2003 2004 2005 2006 2007 2008 2009 2010 Alternative/renewable energy Coal, oil and natural gas
Compared to FDI in non-renewable energy, renewables still lag behind, but the gap is narrowing: while FDI in coal, oil and natural gas were about 23 times higher than FDI in renewable energy in 2003, the gap has now decreased to about 3 times and the recovery is even more marked in terms of number of projects.
Unlike total renewable energy investments, which have been fairly resilient during the current economic crisis, greenfield FDI projects were heavily hit and saw a drop both in 2009 (-14%) and 2010 (-49%) when their estimated value declined to US$40.7 billion. The number of projects followed the same trend: almost doubling in 2008 and then returning to pre-boom levels.
5
Energy poverty and energy investment in
sub-Saharan Africa
Sub-Saharan Africa is one of the world’s most energy-poor regions, despite its technical potential. The continent has almost 10% of the world’s oil reserves (UNECA, 2011). Some countries have been important oil producers (notably Angola and Nigeria) for many years and, recently, the petroleum industry is showing increased interest in oil reserves in West Africa. Côte d’Ivoire, Liberia and Sierra Leone, for instance, are already hosting intense oil exploration. In Ghana, there was an important discovery in 2007. Analysts believe that this region might represent a new frontier for non-OPEC oil production, although political and economic risks and the unfavourable investment climate make difficult to predict when investment and production will really take off (EIA, 2010). But Africa’s real energy wealth is its solar, wind, water and bioenergy resources. According to REN21 data, Africa and the Middle East have about 57% and 8% of the world’s potential solar and wind power respectively (Ecofys NL – REN21, 2008). Africa has also a large hydropower capability that is less exploited than in other regions: the continent accounts for 11% of exploitable capability but it hosts 3% of world current installed hydropower capacity (World Energy Council, 2010a).
Despite this potential energy wealth, the quality and quantity of energy supply in most of SSA is very poor. About 80% of the population relies on traditional biomass fuel for cooking, the largest share in the world (OECD/IEA 2010). Moreover, 585 million people (69% of the population) lack access to electricity, representing more than 40% of the 1.4 billion people worldwide who live without electricity. Energy access is particularly problematic in rural areas where 80% of those lacking any electricity supply live. Finally, all SSA countries, with the exception of South Africa, are in the bottom half of the Energy Development Index ranking, an aggregate indicator which takes into account per-capita electricity and energy consumption, modern fuels use and access to electricity (OECD/IEA 2010).
Sub-Saharan Africa’s energy sector faces multiple challenges: low generation capacity, high costs, unreliable and underdeveloped energy infrastructure and a large financing gap (AfDB, 2010). Electricity networks are often weak and unstable, affected by high power losses and failures, and are usually made up of non-interconnected systems (Nkwetta et al., 2010). The resulting frequent power cuts affect agricultural and manufacturing productivity. Hidden costs due to under-pricing, under-collection and unaccounted losses in the power sector are also widespread. Briceño-Garmendia et al. (2008) observe that inefficiency improvements could considerably enhance government revenues, as they estimate that average annual hidden costs amount to 0.8% of Africa’s GDP.
Finally, low energy consumption is combined with particularly constrained systems of energy production and distribution. This weakness further hampers energy security and aggravates exposure to international market fluctuations. Indeed, most SSA countries are net energy importers20 (Figure 5.1), although the region as a whole is a net energy exporter.
While SSA countries need to invest in energy generation, this is not enough in the absence of other measures. Such investment does not necessarily reduce energy poverty. In the poorest countries, where grid-based access to energy is particularly low, improvements in power-generating capacity face greater obstacles to translating this into greater access, and are more likely to increase supply to those who already have access (Bazilian et al., 2011). There is also a need for investment in maintenance, expansion and development of power grids, in energy efficiency, in capacity-building and in setting alternative financing and incentives mechanisms which are appropriate to different technologies and to different types of user (large and small firms, poor households, rural and urban population).
Figure 5.1 Net energy imports in sub-Saharan African countries – 2008 (Mtoe)
Source: IEA (2010), ’World energy balances’, IEA World Energy Statistics and Balances. Recent estimates (Briceño-Garmendia et al., 2008) find that SSA’s aggregate power infrastructure needs between 2006 and 2015 – both for new investment and operations and maintenance – amount to about US$43 billion a year (7% of GDP), significantly higher than the annual average spending of US$11 billion in the 2001–2006 period. Capital expenditure in energy infrastructure accounted for US$4.6 billion a year (about 40% of total spending). New investments in energy infrastructure were, therefore, similar to those in the water and sanitation sector (US$4.6 billion a year) but about half of the capital expenditure in the transport sector (US$8.4 billion a year). With an average annual expenditure of US$2.4 billion, domestic public finance was the largest source of funds for the energy sector, followed by non-OECD financiers (mainly the Export-Import Bank of China) and by ODA which, on average, provided US$1.1 billion (24%) and US$0.7 billion (15%) a year respectively. The contribution of the private sector was quite low: US$0.5 billion (11%).
Renewable energy has many advantages for improving access to affordable and clean energy. It reduces the dependence on imported fuels, enhancing national trade balance and energy security. It has been calculated that decentralised renewable technologies are cost-competitive in remote and large rural areas of SSA (Deichmann et al., 2011) and they could therefore play a key role in enhancing rural energy access. Finally, large-scale deployment of wind, solar and hydropower energy could also reduce dependence on traditional biomass, which is harmful for health, the environment and workloads, especially for women. A decline in the use of biomass energy could also alleviate pressure on water resources: according to some estimates, Africa produces only 9% of world’s total primary energy, but its energy production consumes more than one-third of water used in the energy sector worldwide (data referred to 2005), mainly due to the extensive use of biomass energy (World Energy Council, 2010b).
Renewable energy markets in SSA are still largely underdeveloped. In 2009, for instance, SSA (South Africa excluded) produced only 74 GWh of electricity from solar, wind, tide and wave compared to 51480 GWh in all non-OECD countries (IEA, 2011).
5.1
Trends in renewable energy investment in sub-Saharan Africa
Data on renewable energy investment in Africa are sparse, largely incomplete and seldom comparable. This section will use different data sources in order to provide a snapshot of the trends in and characteristics of Africa’s renewable energy market.
Information on medium and large projects highlights that investment in renewable energy (large hydropower excluded) is still very low but is growing fast: in 2010 (Figure 4.5) it jumped to US$3.6 billion from US$0.7 billion in the previous year. The data include North African countries and show that the boom was geographically concentrated. In both Egypt and Kenya investment rose to $1.3 billion (UNEP and BNEF, 2011). UNEP and BNEF (2011) report
-120,0 -100,0 -80,0 -60,0 -40,0 -20,0 0,0 20,0 N ig er ia A n go la C o n go G ab on C am er oo n M oz am bi qu e C o te d 'Iv o ir e D R C Er it rea To go Za m bi a Z im b a b w e B o ts w a n a B en in N am ib ia Ta n za n ia Et hi op ia Se n e g a l G h a n a Ken ya
that, in the same year, other countries (notably Cape Verde, Morocco and Zambia) have seen some advances in renewable energy, but in 2010 Egypt and Kenya accounted for more than 70% of all money invested in Africa’s renewable energy market.
UNEP and BNEF data on small-scale generation projects do not include solar water heaters, biomass and other heating systems that might be more appropriate in developing countries. The available evidence suggests, however, that the recent surge in small-scale generation projects, which might enhance energy access in rural areas through decentralised and distributed energy generation, has been dominated by HICs and MICs. Investment in small distributed capacity rose from US$13 billion in 2007 to US$60 billion in 2010, but the boom was driven by ten countries (Germany, Italy, the USA, Japan, France, Czech Republic, Australia, China, Belgium, Israel, in order of magnitude) accounting for almost US$53 billion. Data on greenfield investment confirm the minor role of SSA in the clean energy market. Mirroring the regional trends in FDI flows, as shown in Figure 5.2, between 2003 and 2009, SSA attracted less FDI in renewable energy than all the other regions, with the sole exception of Middle East and North Africa (MENA).
Figure 5.2 Total value of greenfield FDI projects in renewable energy sector by
region, 2003–2009* (US$ millions)
Source: Authors' calculations based on information from Financial Times Ltd, fDi Markets (www.fDimarkets.com). Note: the secondary axis refers to the category ‘All sectors’. *2009 data include only first months of the year.
Recent years have seen an acceleration of FDI in renewable energy in SSA (see Figure 5.3), though the boom has been more pronounced in East Asia and the Pacific, Europe and Central Asia and in Latin America and the Caribbean.
0 500000 1000000 1500000 2000000 2500000 3000000 0 20000 40000 60000 80000 100000 120000 Alternative/Renewable energy All sectors