UB Riskcenter Working Paper Series
University of Barcelona
Research Group on Risk in Insurance and Finance www.ub.edu/riskcenter Working paper 2018/01 \\ Number of pages 17
Ageing and health-related quality of
life: evidence from Catalonia (Spain)
Ageing and health-related quality of life: evidence from Catalonia (Spain)
Manuela Alcañiz1 and Aïda Solé-Auró2
1 Riskcenter, Department of Econometrics, Statistics and Applied Economy University of Barcelona
Av. Diagonal 690, 08034 Barcelona, Spain ORCID: 0000-0002-5028-1926
2 DemoSoc Research Group, Department of Political and Social Sciences Universitat Pompeu Fabra
C/ Ramon Trias Fargas, 25-27, 08005, Barcelona, Spain ORCID: 0000-0003-3726-2509
Corresponding author*: Manuela Alcañiz
Funding: This study was funded by the Spanish Ministry of Economy and Competitiveness (grant numbers ECO2015-66314-R, CSO2016-80484-R and PCIN-2016-005).
Abstract
Background: Reaching advanced old age is more common now than ever. The sustained growth in longevity raises questions about why some people can feel in good quality of life until the last stages, while others seem to accuse the natural deterioration to a larger extent. The self-perceived quality of life has a subjective component, but is also mediated by some easily measurable factors such as sociodemography, health, functioning and lifestyles.
Methods: This study uses nationally representative data for Catalonia (Spain) to explain the health-related quality of life (HRQL) of the population aged 80 and above. Cross-sectional data from 2011 to 2016 was provided by an official face-to-face survey. HRQL was measured through the EuroQol-5D, consisting of a 5-question descriptive system (EQ-5D), plus a visual analogue scale (EQ-VAS) that summarizes the current self-perceived health. Linear regression was used to identify variables influencing the EQ-VAS score.
Results: The dimensions of the EQ-5D that more severily disturbed the HRQL were mobility problems, pain/discomfort and anxiety/depression. Self-care or usual activity problems had a milder impact. Other variables were significantly associated with HRQL. Adjusting for age and sex, low education, low social class, being underweighted or obese, having chronic conditions and disabilities, the presence of hospitalizations or visits to the emergency department, taking prescription drugs and limitations in sensory-related abilites were predictors of a poor HRQL.
Conclusions: Our study identified the impact of several social, health and healthcare variables on the HRQL on 80-plus population. The multidimensional nature of the results suggests the need for a comprehensive approach to HRQL. Health prevention and promotion policies must address the old age as a specially sensitive stage of life.
Keywords: longevity, health-related quality of life, EuroQol-5D, Spain.
Introduction
Life expectancy today is higher than ever before, with the modal length of life in low-mortality regions approaching 91 years for women and 86 years for men [1].At the global scale, low- and middle-income countries are recording large declines in mortality at younger ages [2], while in high-income countries the gains in life expectancy are due mainly to the decreasing trends in mortality rates among the elderly [3]. Although in these more advanced economies current life expectancy at older ages reflects current mortality conditions, and reaching the fourth age has become a relatively normal ageing phenomenon, exposure to different conditions across the lifespan results in lower rates of survival to old age for earlier- than for later-born cohorts [4]. Nevertheless, the ‘long-lived’ population continues to grow rapidly in many countries thanks to increasing rates of survival at all ages, particularly among the elderly, and past fertility trends [5].
Adding years to the lifespan gives rise to new challenges, as the dynamics of health in older age are both complex and require addressing from a multidisciplinary perspective [6-7]. While living a long life in good health is a universal aim, ageing is a multifaceted, long-term process that is not faced with equal success by all individuals [8]. A consideration of only the specific diseases or limitations that might affect an older person would be an overly simplistic approach to take here, given that what is required is an evaluation of their impact on trajectories of health and functioning [9]. Ultimately, it is assessments of the quality of life (QoL) that are indicative of poor or successful ageing processes [10].
QoL is neither readily defined nor operationalized given its multidimensional nature [11]. One of its most critical dimensions can be identified as health-related quality of life (HRQL), which is concerned with the effects of health, illness and treatment on QoL, but which excludes cultural, political or societal attributes of life. There is an extensive literature describing different methods for measuring HRQL (see, among others, Guyatt et al. [12]; Hawthorne et al. [13]; Hays and Morales [14]), but Tengs and Wallace [15] identify two main types. The first is that of direct elicitation, which includes such methods as time trade-off and rating scales. The time trade-off
method involves asking subjects to imagine having to live in a given state of poor health for “x” years, and then to identify the number of years in full health that they consider to be of equal value [16]. For example, if a respondent considers that living for six years in full health is equivalent to being confined to a wheelchair for ten years, the utility that that person assigns to the state of being in a wheelchair can be used to calculate their QoL in that state of health. Alternatively, rating-scale methods, such as visual analogue scales (VAS), involve asking subjects to rate their state of health on a scale from 0 to 100, ranging from worst to best health imaginable. The second type of methods for assessing HRQL involves indirect procedures. These use health status instruments such as the Health Utilities Index [17] or the EuroQol [18]. None of these methods requires subjects to self-assign a QoL score; rather, an index is estimated on the basis of their responses to questions about different dimensions of their health, including mobility and pain [19-20].
This study is conducted in Catalonia, a high-income Spanish region, and focuses on a population that is currently undergoing an accelerated ageing process. According to information released for 1990 by the region’s official website, 176,565 individuals were then aged 80 and above, that is, 2.9% of the whole Catalan population. More recently, in 2016, the size of this oldest-old age group had more than doubled, and today it represents 6.0% of the overall population [21]. Under an average scenario, demographic projections indicate that this rate is set to reach almost 10.0% by 2040. Aside from the challenges this represents for the public pension system [22], from a healthcare perspective this process highlights the need for optimal resource management, along with well-designed prevention and promotion actions.
Within this demographic context, our study has two objectives: first, we seek to develop a model that can provide a better understanding of the way in which demographic, educational, health and lifestyle variables impact HRQL in old age; and second, we aim to identify those factors frequently linked to poor ageing that can actually be modified in earlier stages of life. Our ultimate goal is to be able to provide policymakers with valuable insights on how they might promote good HRQL in the oldest-old population to ensure successful ageing.
Methodology
Data
We conducted a cross-sectional study in Catalonia (Spain), a region with 7.5 million inhabitants, whose capital and largest city is Barcelona. Our microdata are drawn from the Catalan Health Survey [23], which provides extensive information on individuals’ health-related behaviour and state of health, in relation to a set of sociodemographic variables. This official survey was first conducted in 1994 and since 2010 it has been repeated on a twice-yearly basis. The sample uses a random complex design, with strata based on age, gender and geographical area [24]. Personal interviews are used to collect the data, and the questionnaires used in each time-period are designed to be comparable.
To obtain a sufficiently large sample size, we used data from the last six years of data available (2011 to 2016). Our final sample comprised a randomly selected population of 2,264 home-dwellers (1,025 males and 1,239 females) aged 80 years and above. Most of these respondents corresponded directly to the units sampled, but in the case of 567 individuals responses were obtained indirectly, owing to problems of ill-health or other impediments presented by the selected respondent.
Measures
EuroQol-5D was used to assess the HRQL of our population of individuals aged 80 and over. This standardized instrument was developed in Europe in 1990 by the EuroQoL Group [18] and has since been widely used. It comprises two parts – an indirect and a direct procedure for assessing HRQL: that is, a descriptive health classifying system (EQ-5D) and a visual analogue scale (EQ-VAS), respectively. The EQ-5D is a self-report questionnaire that asks respondents to classify their own health according to five dimensions: mobility, self-care, usual activities, pain or discomfort, and anxiety or depression. Since 2011, the ESCA questionnaire has incorporated the five-level Spanish version [25], with five degrees of severity ranging from no problems to extreme impairment [26]. Additionally, the EQ-VAS, a rating-scale method, allows respondents
to provide a global assessment of their health status “today”, from 0 to 100. Here, we opted to group the EQ-VAS values into four intervals delimited by quartiles, ranging from worst to best HRQL: i) interval 1: ≤ 40; ii) interval 2: 41 to 55; iii) interval 3: 56 to 70; and iv) interval 4: >70. The EuroQol Group recommends the use of both parts of the instrument for research purposes [27].
We also took into consideration several sociodemographic, health status, and healthcare variables associated with HRQL. The sociodemographic characteristics included gender, age (three groups: 80-84; 85-89; 90-plus), level of education (low – less than high school vs. middle/high – upper secondary or tertiary), social class based on the classification proposed by the Spanish Society of Epidemiology [28] (middle/high vs. low social class), and household size (lives alone or lives with other household members). Levels of sensory and physical limitation were included by drawing on several different indicators. Specifically, the severity of sensory impairment was constructed by summing the number of affirmative responses when reporting the presence of limitations in: (i) hearing; (ii) seeing; (iii) speaking; and (iv) writing or reading. The level of functional loss was likewise constructed from affirmative responses indicating: (i) severe limitations in getting out of the house alone; (ii) walking problems that require mobility aids, the help of another person, or a wheelchair; and (iii) other physical movement impairments, such as difficulties in climbing ten steps without help. Chronic morbidity was measured through the number ofself-reported chronic conditions, with subjects being asked if they currently have or had had various conditions selected from a list of 32, including hypertension, hypercholesterolemia, diabetes, etc. We also considered the occurrence of falls in the previous 12 months, the need for help to complete activities of daily living (ADLs), and the level of physical activity (from sedentary to highly active). A range of variables has typically been used as indirect controls of health indicators and to help classify individuals into a specific category. As risky health behaviours, body mass index (normal or overweight, that is, a BMI of 18.5 or < 30 vs. underweight or obese, that is, a BMI of < 18.5 or ≥ 30, respectively), smoking (current smoker, former smoker or never smoked), and drinking (non-drinker, moderate drinker or at-risk drinker)
were considered. Alcohol intake categories were defined according to the classification provided by the Spanish Society of Family and Community Medicine [29]. As for healthcare and the use of medical resources, respondents reported about the number of prescription drugs taken during the previous two days, the number of overnight stays in a hospital within the preceding 12 months, and the number of visits or calls to the emergency department during the same period.
Statistical analysis
We analysed the descriptive data of the sociodemographic characteristics and health status of Catalan adults aged 80-plus in relation to the EuroQoL instrument. Specifically, we provide the severity distribution for each dimension on the EQ-5D questionnaire, and the individual characteristics according to the quartile interval on the EQ-VAS. Continuous variables are described using means and standard deviations (SD), and categorical variables using percentages (%). Sampling weights provided by the ESCA are used in the analyses to correct for age and gender deviations between our sample and the Catalan population.
A multivariate linear regression model was fitted using ordinary least squares (OLS), to detect which components affected the EQ-VAS score for HRQL. To this end, we estimated and compared three different regression models. In a first step, Model 1 estimated the effect of the EQ-5D scale measures on the EQ-VAS score. In a second step, we omitted the EQ-5D measures, and included all the control variables, so as to identify their effect on the EQ-VAS score (Model 2). Finally, Model 3 combined Models 1 and 2, to provide our final adjusted model. The outcomes of the OLS models are presented as coefficients with their respective p-values (significance levels at 1, 5 and 10%). All statistical analyses were conducted with Stata version 13.1.
Results
Univariate analysis
Table 1 shows the distribution of individuals according to the reported level of severity on the EQ-5D dimensions. The dimensions identified as causing respondents the most frequent severe/extreme problems were limitations related to usual activities (26.2%) and mobility (24.6%). Indeed, mobility issues, together with pain/discomfort, affected about two-thirds of the population to some degree, although only relatively small proportions identified them as extreme problems (4.8 and 3.2%, respectively). In contrast, roughly two-thirds of individuals reported no limitations as regards self-care and anxiety/depression (60.4 and 63.1%, respectively).
The study sample, of which 64.4% were women, presented a mean age of 85.9 years (SD 4.3), with slightly more than half falling in the youngest age group (80-84) (Table 2). The vast majority of respondents had not completed secondary education (86.5%) and were of low social class (75.5%), while almost three quarters (72.2%) reported not living alone. As for their health, 32.4% of the respondents reported sensory problems of some degree; 44.5% presented a severity level of 2 or 3 in terms of functional loss; and, the average number of chronic diseases reported was 7.2 (4.0 SD). About a fifth of respondents reported suffering a fall in the previous 12 months, while more than half reported needing help with activities of daily living (ADLs) and being sedentary (with just 35.6% being slightly active or more). The average number of prescription drugs taken over the previous two days was 4.1 (SD 2.6). In the case of the three risk factors studied, 83.1% reported a normal/overweight BMI, 78.6% never smoked, and almost all reported being non-drinkers (52.7%) or moderate drinkers (46.6%). Finally, 17.4% of the elderly had been hospitalized in the previous year, with an average of 0.7 emergency visits (SD 1.6).
Table 2 also shows the characteristics of the 80-plus population according to their EQ-VAS scores (broken down into four intervals delimited by quartiles). The first interval (those with the lowest HRQL score) comprised the largest proportion of women (70.3% vs. 55.3% in the fourth interval, reporting the highest scores), with the highest average age (86.0 vs. 84.5), the largest proportions with a low education level (92.4% vs. 79.4%) and low social class (80.4% vs.
66.6%) and the highest proportion living in a shared household (79.5% vs. 73.1%). As expected, the least advantaged group according to the EQ-VAS score reported the worse state of health in relation to all sensory, functioning and health variables, as well as the greatest use of health resources. The differences between intervals were especially notable in relation to reported levels of some sensory loss (51.7% in the first interval vs. just 17.1% in the fourth), the severest level of functional loss (63.2% vs. 9.7%), the average number of chronic diseases (9.5 vs. 4.9) and the need for help with ADLs (87.2% in the first vs. 20.6% in the fourth). BMI and lifestyles were healthier in the group with the highest HRQL scores. Differences between the first and fourth intervals were notable in the cases of sedentarism (80.3% versus 37.7%), being underweight or obese (33.0% versus 8.9%), and the proportion of non-drinkers (65.5% versus 39.9%). Likewise, while 28.8% of the elderly in the first interval had been hospitalized in the previous 12 months, with an average of 1.3 emergency visits, the corresponding figures for those in the fourth interval were 10.4% and 0.4. In short, a persistent pattern is evident with conditions improving across the board as we move from the first (lowest EQ-VAS score) to the fourth (highest EQ-VAS score) interval.
Multivariate analysis
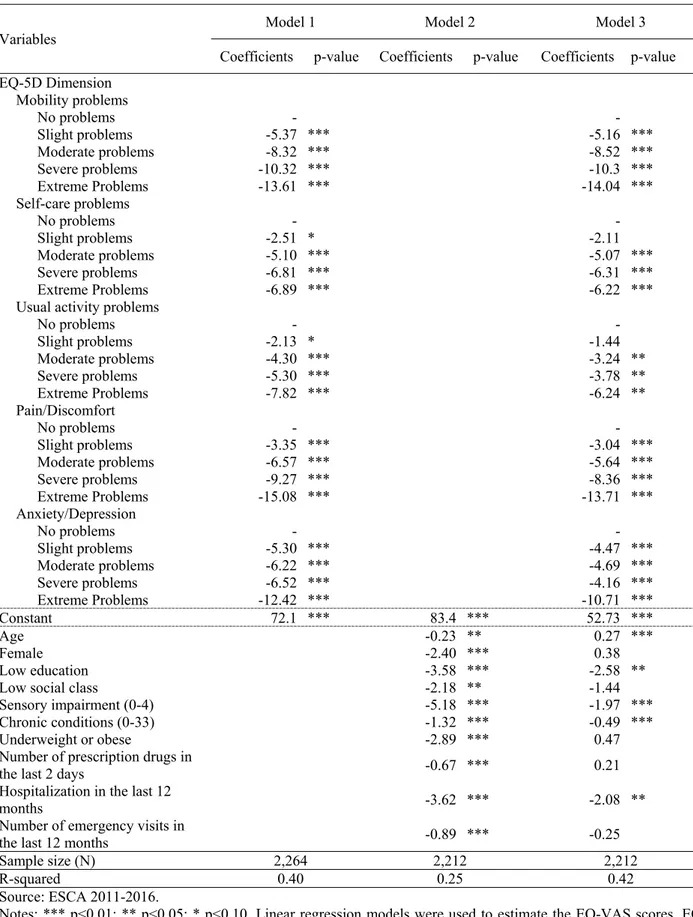
In the multivariate analysis stage, we estimated the linear regression coefficients for the EQ-VAS scores in three sequential models. The five standardized dimensions of the EQ-5D scale explained a large proportion (40.0%) of the variation of the EQ-VAS scores (Model 1, Table 3). We found a strong, significant negative association between severe/extreme problems in all five dimensions and the EQ-VAS scores. The expected value for the dependent variable fell as the severity of the disorder increased. By order of magnitude, advanced stages of mobility issues, pain/discomfort, and anxiety/depression caused the largest falls in the EQ-VAS scores, while limitations as regards self-care and usual activities seemed to have a milder impact.
Model 2 includes selected control variables that showed statistical significance. The EQ-5D measures were excluded from Model 2 to facilitate identification of the net effect of the control variables on the assessment of the HRQL measured with this scale. We performed a binary
correlation analysis among all the control variables and did not find any strong association; therefore, we retained them all in the model. Being older, female, low educated and belonging to the low social class reduced the expected EQ-VAS score. Individuals presenting some level of sensory impairment showed reductions of around 5 units on our HRQL measure for each additional issue reported. A similar outcome was found for those with chronic conditions (-1.32 for each clinical condition). Being underweight or obese also had a significant negative effect (-2.89). Similarly, individuals taking prescription drugs in the previous two days, or who had been hospitalized or attended emergency units in the preceding twelve months presented lower expected HRQL values. The R-squared coefficient for this model was 0.25. Model 3 merges Models 1 and 2, allowing us to determine how the control variables interact with the EQ-5D dimensions. This last model presented the highest R-squared value (0.42), suggesting a good explanatory capacity. We found similar results to those presented above, except in relation to self-care and usual activity limitations whose coefficients for slight problems were no longer significant. Age presented a significant positive coefficient, suggesting that the EQ-5D scale might underestimate the dependent variable when combined with the controls, but the expected self-assessment of HRQL did not differ by gender or social class. Finally, being underweight or obese, a higher number of prescription drugs taken in the last two days and the number of emergency visits were no longer significant.
Discussion
This study has aimed to further our understanding of the ways in which sociodemographic, educational, health and lifestyle variables impact the HRQL of the Catalan population aged 80-plus living in the community. In so doing, we used a rating-scale method, the EQ-VAS, to measure the HRQL. Our findings confirm the multifaceted nature of HRQL in old age. The five dimensions of the EQ-5D were found to explain a significant proportion of the variability detected in the responses of the oldest-old about their HRQL. However, the inclusion of additional
variables proved critical for better outlining the profile of the population at risk of poor ageing due to bad HRQL. Our results seem to confirm the widely reported negative influence on HRQL of being female and of getting older (see, for example, Rendas-Baum et al. [30]). But, more interestingly, we detected a persistent pattern whereby other factors typically defined in younger stages of the life course have a strong impact on HRQL in later life. Specifically, middle/high levels of educational attainment and middle/high levels of social class were associated with a better HRQL for individuals aged 80-plus. These outcomes reveal the influence of education and income as social determinants of health, particularly in the oldest-age group [31], and highlight the importance of promoting policies to improve levels of educational attainment among the young. In addition to countless benefits across the lifespan, a higher education is an obvious facilitator of a better occupation-based socioeconomic status and, according to our results, of a better HRQL during old age.
Thus, while the design of effective public health strategies for palliating the physical and mental deterioration caused by a long life remains important, we believe it equally crucial to increase awareness among the population of the importance of preparing for successful ageing at younger stages in the lifecycle. For example, actions promoting an active lifestyle are essential to help prevent mobility issues or ADL difficulties in later life. In short, components of both health care and broader social issues need to be addressed to promote the best ageing trajectories [32].
The findings from our study are of considerable interest; however, a number of limitations should be noted that might affect our results. First, as the ESCA does not target individuals in nursing homes, our results cannot be generalized to the entire oldest-old population. Indeed, our respondents may well be younger than those living in nursing homes, the latter generally being individuals at a higher risk of morbidity and mortality. According to the Catalan Statistics Institute [33], the institution-dwelling elderly represented about 0.6% of the Catalan population in 2011, with one in every five individuals aged 90-plus living in a nursing home. Second, the ESCA questionnaire was answered indirectly (owing to impairment of sample unit) in 25% of cases. Even though sensitive questions are avoided in this indirect questionnaire, some response bias
might exist. Third, as our results cover a 6-year period, there could be some concealed trends. However, we were obliged to work with this long period in order to have a large enough sample to guarantee the robustness of the results.
As Machón et al. [34] conclude, the multifaceted nature of quality of life in old age highlights the need to implement a more multidisciplinary approach to understanding its complexity. A closer consideration of such domains as psychological and social support needs should provide a better insight as to why one elderly individual feels well despite the natural deterioration associated with ageing while another, in apparently similar conditions, feels unwell.
Table 1: Distribution (%) and 95% confidence intervals for the EQ-5D dimensions by levels of severity. Individuals aged 80-plus. EQ-5D dimensions Total sample (N=2,264) No problems CI 95% Mild problems CI 95% Moderate problems CI 95% Severe problems CI 95% Extreme problems CI 95% Mobility 33.9 (32.0; 35.8) 17.6 (16.0; 19.2) 23.9 (22.1; 25.7) 19.8 (18.2; 21.4) 4.8 (3.9; 5.7) Self-care 60.4 (58.4; 62.4) 11.3 (10.0; 12.6) 10.7 (9.4; 12.0) 7.3 (6.2; 8.4) 10.4 (9.1; 11.7) Usual activities 45.0 (43.0; 47.0) 14.5 (13.0; 16.0) 14.3 (12.9; 15.7) 11.3 (10.0; 12.6) 14.9 (13.4; 16.4) Pain/discomfort 33.0 (31.1; 34.9) 16.8 (15.3; 18.3) 29.2 (27.3; 31.1) 17.7 (16.1; 19.3) 3.2 (2.5; 3.9) Anxiety/depression 63.1 (61.1; 65.1) 15.6 (14.1; 17.1) 13.6 (12.2; 15.0) 6.0 (5.0; 7.0) 1.7 (1.2; 2.2)
Table 2: Individual characteristics according to the quartiles of the EQ-VAS score. Individuals aged 80-plus.
N Total I1 I2 I3 I4
EQ VAS – Intervals* 2,264 ≤ 40 41-55 56-70 > 70 Age in years, mean (SD) 2,264 85.9 (4.3) 86.0
(4.6) 85.4 (4.3) 84.6 (3.9) 84.5 (4.4) Age groups 2,264 80-84 52.0 42.8 48.8 57.5 59.9 85-89 31.6 34.4 34.8 30.0 26.4 90+ 16.4 22.8 16.4 12.5 13.7 Sex 2,264 Men 35.6 29.7 30.7 38.9 44.7 Women 64.4 70.3 69.3 61.1 55.3 Level of education 2,260 Low 86.5 92.4 88.6 84.4 79.4 Middle or high 13.5 7.3 11.4 15.6 20.6 Social class 2,221 Low 75.5 80.4 77.3 75.4 66.6 Middle or high 24.5 19.6 22.7 24.6 33.4 Household size 2,264 Living alone 27.8 20.5 31.4 32.2 26.9
More than one member 72.2 79.5 68.6 67.9 73.1 Level of sensory loss 2,264
0 67.6 48.3 65.2 77.1 82.9
1 19.7 24.6 23.8 16.2 13.2
2 8.6 17.6 6.4 5.6 3.5
3 2.7 6.5 2.8 0.6 0.4
4 1.4 3.0 1.8 0.5 0.0
Level of functional loss 2,264
0 38.4 10.6 30.1 52.1 65.8
1 17.1 11.1 17.5 22.4 17.0
2 14.0 15.1 19.5 12.9 7.5
3 30.5 63.2 32.9 12.6 9.7
Number of chronic diseases, mean (SD) 2,264 7.2 (4.0) (4.0) 9.5 (3.6) 7.7 (3.5) 6.3 (3.2) 4.9 Falls in the previous 12 months 2,264
0 79.0 71.1 77.3 83.2 85.2
>=1 21.0 28.9 22.7 16.8 14.8
Needs help for ADL 2,264
Yes 51.5 87.2 60.3 32.7 20.6
No 48.5 12.8 39.7 67.3 79.4
Usual physical activity 1,552
Highly active 0.2 0.0 0.0 0.3 0.6
Moderately active 0.7 0.3 0.7 0.8 1.1
Slightly active 34.7 14.1 24.5 42.0 52.9
Minimally active 8.1 5.2 8.9 9.4 7.8
Sedentary 56.3 80.3 65.9 47.5 37.7
Number of prescription drugs in the last 2
days, mean (SD) 2,264 4.1 (2.6) (2.8) 5.3 (2.3) 4.5 (2.3) 3.6 (2.2) 2.9
Risk Factors
Body mass index 2,264
Normal or overweight 83.1 77.0 77.6 87.8 91.1 Underweight or obesity 16.9 33.0 32.4 12.2 8.9 Smoking 1,697 Current smoker 2.8 3.2 2.4 2.3 3.4 Former smoker 16.6 12.2 16.7 23.1 19.8 Never smoked 78.6 84.5 80.9 74.5 76.8 Drinking 1,697 Non-drinker 52.7 65.5 57.0 50.8 39.9 Moderate drinker 46.6 34.5 42.3 48.5 58.8 At risk drinker 0.7 0.0 0.7 0.8 1.3
Hospitalization in the last 12 months 2,262
Yes 17.4 28.8 18.8 10.7 10.4
No 82.6 71.2 81.2 89.3 89.6
Number of emergency visits in the last 12
months, mean (SD) 2,257 0.7 (1.6) (2.5) 1.3 (1.3) 0.7 (0.9) 0.5 (0.8) 0.4 Source: ESCA 2011-2016.
Notes: Numbers are percentages (%) unless otherwise stated. SD: standard deviation. EQ-VAS: EuroQol Visual Analogue Scale. I1, I2, I3 and I4 represent the intervals delimited by the EQ-VAS quartiles.
Table 3: Estimated linear regression models for the EQ-VAS score. Individuals aged 80-plus.
Variables Model 1 Model 2 Model 3
Coefficients p-value Coefficients p-value Coefficients p-value EQ-5D Dimension Mobility problems No problems - - Slight problems -5.37 *** -5.16 *** Moderate problems -8.32 *** -8.52 *** Severe problems -10.32 *** -10.3 *** Extreme Problems -13.61 *** -14.04 *** Self-care problems No problems - - Slight problems -2.51 * -2.11 Moderate problems -5.10 *** -5.07 *** Severe problems -6.81 *** -6.31 *** Extreme Problems -6.89 *** -6.22 ***
Usual activity problems
No problems - - Slight problems -2.13 * -1.44 Moderate problems -4.30 *** -3.24 ** Severe problems -5.30 *** -3.78 ** Extreme Problems -7.82 *** -6.24 ** Pain/Discomfort No problems - - Slight problems -3.35 *** -3.04 *** Moderate problems -6.57 *** -5.64 *** Severe problems -9.27 *** -8.36 *** Extreme Problems -15.08 *** -13.71 *** Anxiety/Depression No problems - - Slight problems -5.30 *** -4.47 *** Moderate problems -6.22 *** -4.69 *** Severe problems -6.52 *** -4.16 *** Extreme Problems -12.42 *** -10.71 *** Constant 72.1 *** 83.4 *** 52.73 *** Age -0.23 ** 0.27 *** Female -2.40 *** 0.38 Low education -3.58 *** -2.58 **
Low social class -2.18 ** -1.44
Sensory impairment (0-4) -5.18 *** -1.97 ***
Chronic conditions (0-33) -1.32 *** -0.49 ***
Underweight or obese -2.89 *** 0.47
Number of prescription drugs in
the last 2 days -0.67 *** 0.21
Hospitalization in the last 12
months -3.62 *** -2.08 **
Number of emergency visits in
the last 12 months -0.89 *** -0.25
Sample size (N) 2,264 2,212 2,212
R-squared 0.40 0.25 0.42
Source: ESCA 2011-2016.
Notes: *** p<0.01; ** p<0.05; * p<0.10. Linear regression models were used to estimate the VAS scores. EQ-VAS: EuroQol Visual Analogue Scale.
References
[1] Robine, J.M., & Jagger, C. (2017). Health expectancies in Oxford Textbook of Geriatric Medicine (3rd Edition, editors Jean-Pierre Michel et al.).
[2] Bloom, DE. (2011). 7 billion and counting. Science, 29, 333(6042), 562–569.
[3] Christensen, K., Doblhammer, G., Rau, R., & Vaupel, J.W. (2009). Ageing populations: the challenges ahead. The Lancet, 374(9696), 1196–1208.
[4] Solé-Auró, A., & Crimmins, E. (2013). The oldest old: health in Europe and the United States. In J.M. Robine, C. Jagger, & E. Crimmins (Eds.), Annual review of gerontology and geriatrics: Healthy longevity, a global approach (Vol. 33, pp. 3–33). New York: Springer. [5] Mathers, C.D., Stevens, G.A., Boerma, T., & White, R.A. (2015). Causes of international
increases in older age life expectancy. The Lancet, 540-548.
[6] Crimmins, E.M., & Beltrán-Sánchez, H. (2011). Mortality and morbidity trends: is there compression of morbidity? Journal of Gerontology. Series B, Psychological Science and Social Sciences, 66(1), 75–86.
[7] Solé-Auró, A., & Alcañiz, M. (2015). Are we living longer but less healthy? Trends in mortality and morbidity in Catalonia (Spain), 1994-2011. European Journal of Ageing, 12(1), 61-70.
[8] WHO (2015). World Health Organization. World Report on Ageing and Health. Geneva: WHO Library Cataloguing-in-Publication Data.
[9] Lordos, E.F., Herrmann, F.R., Robine, J.M., Balahoczky, M., Giannelli, S.V., Gold, G., et al. (2008). Comparative value of medical diagnosis versus physical functioning in predicting the 6-year survival of 1951 hospitalized old patients. Rejuvenation Research, 11(4), 829– 836.
[10] Gabriel, Z., & Bowling, A. (2004). Quality of life from the perspectives of older people. Ageing and Society, 24(5), 675-691.
[11] Halvorsrud, L., & Kalfoss, M. (2007). The conceptualization and measurement of quality of life in older adults: a review of empirical studies published during 1994-2006. European Journal of Ageing, 4(4), 229-246.
[12] Guyatt, G.H., Feeny, D.H., & Patrick, D.L. (1993). Measuring health-related quality-of-life. Annals of Internal Medicine, 118(8), 622-629.
[13] Hawthorne, G., Richardson, J., & Osborne, R. (1999). The Assessment of Quality of Life (AQoL) instrument: a psychometric measure of health-related quality of life. Quality of Life Research, 8(3), 209-224.
[14] Hays, R.D., & Morales, L.S. (2001). The RAND-36 measure of health-related quality of life. Annals of Medicine, 33(5), 350-357.
[15] Tengs, T.O., & Wallace, A. (2000). One thousand health-related quality-of-life estimates. Medical Care, 38(6), 583-637.
[16] Devlin, N., Tsuchiya, A., Buckingham, K. & Tilling, C. (2011). A uniform time trade off method for states better and worse than dead: Feasibility study of the ‘lead time’ approach. Health Economics, 20(3), 348-361.
[17] Feeny, D., Furlong, W., Boyle, M., & Torrance, G.W. (1995). Multi-attribute health status classification systems: Health Utilities Index. Pharmacoeconomics, 7, 490-502.
[18] EuroQoL Group. (1990). EuroQoL - a new facility for the measurement of health-related quality of life. Health Policy, 16(3), 199-208.
[19] Torrance, G.W., Furlong, W., Feeny, D., & Boyle, M.. (1995). Multi-attribute preference functions: Health Utilities Index. Pharmacoeconomics, 7, 503-520.
[20] Badia, X., Roset, M., Montserrat, S., Herdman, M., & Segura, A. (1999). La versión española del EuroQol: descripción y aplicaciones. Medicina Clínica, 112(1), 79-86.
[21] Catalan Statistics Institute, Generalitat de Catalunya. Oficial Statistics Website of Catalonia, Population, 2017. Retrieved from: https://www.idescat.cat/tema/pobla?lang=en (consulted: 1 August 2017).
[22] Díaz-Giménez, J., & Díaz-Saavedra, J. (2009). Delaying retirement in Spain. Review of Economic Dynamics, 12(1), 147-167.
[23] Catalan Health Department, Generalitat de Catalunya (2017) Enquesta de Salut de Catalunya (ESCA). Retrieved from:
http://salutweb.gencat.cat/ca/el_departament/estadistiques_sanitaries/enquestes/esca/ (consulted: 18 June 2017).
[24] Alcañiz, M., Mompart, A., Guillén, M., Medina, A., Aragay, J.M., Brugulat, P., & Tresserras, R. (2014). New design of the Health Survey of Catalonia (Spain, 2010-2014): A step forward in health planning and evaluation. Gaceta Sanitaria, 28, 338-340 (in Spanish). [25] García-Gordillo, M.A., Adsuar, J.C., & Olivares, P.R. (2016). Normative values of
EQ-5D-5L: in a Spanish representative population sample from Spanish Health Survey. Quality of Life Research, 25(5), 1313-1321.
[26] Herdman, M., Gudex, C., Lloyd, A., Janssen, M., Kind, P., et al. (2011). Development and preliminary testing of the new five-level version of EQ-5D (EQ-5D-5L). Quality of Life Research, 20(10), 1727-1736.
[27] EuroQol Group (2015). 5D-5L User Guide. Basic information on how to use the EQ-5D-5L instrument. Rotterdam: EuroQol Research Foundation. Retrieved from: https://euroqol.org/wp-content/uploads/2016/09/EQ-5D-5L_UserGuide_2015.pdf.
(consulted: 3 July 2017).
[28] Regidor, E. (2001). The Goldthorpe Social Class Classification: reference framework for a proposal for the measurement of social class by the Working Group of the Spanish Society of Epidemiology, Revista Española de Salud Pública, 75(1), 13-22.
[29] Robledo, T. & Córdoba, R. (2007). Cómo actuar ante el consumo de alcohol: guía de referencia para profesionales de atención primaria [electronic resource]. Barcelona: Sociedad Española de Medicina de Familia y Comunitaria (SEMFYC). http://www.pnsd.msssi.gob.es/profesionales/publicaciones/catalogo/bibliotecaDigital/publi caciones/pdf/AlcoholAtencionPrimaria.pdf. (consulted: 15 July 2017).
[30] Rendas-Baum, R., White, M.K., Kosinski, M., Vietri, J., & Bjorner, J.B. (2016). A Cross-National Comparison Of The Effect Of Age And Gender On Health-Related Quality Of Life (HRQL). Value in Health, 19(7), A471.
[31] Braveman, P., & Gottlieb, L. (2014). The social determinants of health: it's time to consider the causes of the causes. Public Health Reports, 129(Suppl 2), 19-31.
[32] Arpino, B., & Solé-Auró, A. (2017). Education inequalities in health among older European men and women: the role of active aging. Journal of Aging and Health, forthcoming. [33] Catalan Statistics Institute, Generalitat de Catalunya. La població resident en establiments
col·lectius 2011. Dossiers Idescat, 2013, 16. Retrieved from: http://www.idescat.cat/cat/idescat/publicacions/cataleg/pdfdocs/dossier16.pdf (consulted: 6 August 2017).
[34] Machón, M., Larrañaga, I., Dorronsoro, M., Vrotsou, K., & Vergara, I. (2017). Health-related quality of life and associated factors in functionally independent older people. BMC Geriatrics, 17, 19.
UB·Riskcenter Working Paper Series
List of Published Working Papers
[WP 2014/01].
Bolancé, C., Guillen, M. and Pitt, D.
(2014)
“Non-parametric models
for univariate claim severity distributions – an approach using R”
,
UB Riskcenter Working Papers Series 2014-01.
[WP 2014/02].
Mari del Cristo, L. and Gómez-Puig, M. (2014)
“Dollarization and
the relationship between EMBI and fundamentals in Latin
American countries”
, UB Riskcenter Working Papers Series
2014-02.
[WP 2014/03].
Gómez-Puig, M. and Sosvilla-Rivero, S. (2014) "
Causality and
contagion in EMU sovereign debt markets",
UB Riskcenter
Working Papers Series 2014-03.
[WP 2014/04].
Gómez-Puig, M., Sosvilla-Rivero, S. and Ramos-Herrera M.C. "
An
update on EMU sovereign yield spread drivers in time of crisis: A
panel data analysis
", UB Riskcenter Working Papers Series 2014-
04.
[WP 2014/05].
Alemany, R., Bolancé, C. and Guillen, M. (2014) "
Accounting for
severity of risk when pricing insurance products
", UB Riskcenter
Working Papers Series 2014-05.
[WP 2014/06].
Guelman, L., Guillen, M. and Pérez-Marín, AM. (2014) "
Optimal
personalized treatment rules for marketing interventions: A
reviewof methods, a new proposal, and an insurance case study
.",
UB Riskcenter Working Papers Series 2014-06.
[WP 2014/07].
Piulachs, X., Alemany, R. and Guillen, M. (2014) "
A joint
longitudinal and survival model with health care usage for insured
elderly
", UB Riskcenter Working Papers Series 2014-07.
[WP 2014/08].
Abad, P and Chuliá, H. (2014) "
European government bond
market integration in turbulent times
", UB Riskcenter Working
Papers Series 2014-08.
[WP 2014/09].
Belles-Sampera, J., Guillen, M. and Santolino, M. (2014) "
The use of
flexible quantile-based measures in risk assessment
", UB
Riskcenter Working Papers Series 2014-09.
[WP 2015/01].
Bolancé C., Guillen, M. and Padilla, A (2015) "
Estimación del
riesgo mediante el ajuste de cópulas
", UB Riskcenter Working
Papers Series 2015-01.
[WP 2015/02].
Donnelly, C., Gerrard, R., Guillen, M. and Nielsen, J.P. (2015) "
Less
is more: increasing retirement gains by using an upside terminal
wealth constrait
", UB Riskcenter Working Papers Series 2015-02.
[WP 2015/03].
Chuliá, H., Guillen, G. and Uribe (2015) "
Mortality and longevity
risks in the United Kingdom: Dynamic factor models and
copula-functions
", UB Riskcenter Working Paper Series 2015-03.
[WP 2015/04].
Alaminos, E. and Ayuso, M. (2015) "
Desarrollo metodológico del
modelo actuarial de múltiples estados casado - viudo y cálculo
actuarial del coste por pensiones de jubilación y viudedad
", UB
Riskcenter Working Paper Series 2015-04.
[WP 2015/05].
Belles-Sampera, J., Guillen, M. and Santolino, M. (2015) "
What
attitudes to risk underlie distortion risk measure choices?
", UB
Riskcenter Working Paper Series 2015-05.
[WP 2015/06].
Solé-Auro, A, and Alcañiz, M. (2015) "
Is the educational health gap
increasing for women? Results from Catalonia (Spain)
", UB
Riskcenter Working Paper Series 2015-06.
[WP 2015/07].
Donnelly, C., Guillen, M., Nielsen, J.P. and Pérez-Marín, AM. (2015)
"
On the practical implementation of retirement gains by using an
upside and a downside terminal wealth constraint
", UB Riskcenter
Working Papers Series 2015-07.
[WP 2017/01].
Ayuso, M., Guillen, M. and Nielsen, J.P. (2017) "
Improving
automobile insurance ratemaking using telematics: incorporating
mileage and driver behaviour data
", UB Riskcenter Working
Papers Series 2017-01.
[WP 2018/01].