INTRODUCTION
Amyotrophic lateral sclerosis (ALS) is a progressive age-dependent neurodegenerative disease characterized by degeneration and death of upper (motor cortex) and lower (brain stem and spinal cord) motor neurons, resulting in muscle atrophy, together with variable frontotemporal lobar degeneration (FTLD). ALS may be sporadic (sALS) with unknown cause, in up to 90%-92% of cases, or inherited (fALS), accounting for about 8-10% of cases, most of them transmitted as autosomal
dominant but also recessive and X-linked in some families. However, about 13% of sALS cases bear a gene mutation linked to fALS. Main pathological features in sALS are loss of myelin and axons in the pyramidal tracts and anterior spinal roots, chromatolysis of motor neurons, axonal spheroids in the anterior horn, cystatin C-containing Bunina bodies in motor neurons, ubiquitin-immunoreactive TDP-43-positive skein-like and spherical inclusions in motor neurons, and TDP-43 inclusions in oligodendroglial cells. In many cases, the frontal cortex shows cytoplasmic
TDP-43-immuno-Research Paper
Amyotrophic lateral sclerosis, gene deregulation in the anterior
horn of the spinal cord and frontal cortex area 8: implications in
frontotemporal lobar degeneration
Pol Andrés‐Benito
1, Jesús Moreno
1, Ester Aso
1, Mónica Povedano
2, Isidro Ferrer
1, 3, 4, 51Institute of Neuropathology, Pathologic Anatomy Service, Bellvitge University Hospital, IDIBELL, Hospitalet de Llobregat, Spain 2Service of Neurology, Bellvitge University Hospital, Hospitalet de Llobregat, Spain 3Department of Pathology and Experimental Therapeutics, University of Barcelona, Spain 4Institute of Neurosciences, University of Barcelona, Barcelona, Spain 5Biomedical Network Research Center on Neurodegenerative Diseases (CIBERNED), Institute Carlos III, Hospitalet de Llobregat, Spain Correspondence to: Isidre Ferrer; email: [email protected] Keywords: amyotrophic lateral sclerosis, frontal cortex, spinal cord, frontotemporal lobar degeneration, excitotoxicity, neuroinflammation
Received: November 17, 2016 Accepted: February 27, 2017 Published: March 9, 2017
ABSTRACT
Transcriptome arrays identifies 747 genes differentially expressed in the anterior horn of the spinal cord and 2,300 genes differentially expressed in frontal cortex area 8 in a single group of typical sALS cases without frontotemporal dementia compared with age‐matched controls. Main up‐regulated clusters in the anterior horn are related to inflammation and apoptosis; down‐regulated clusters are linked to axoneme structures and protein synthesis. In contrast, up‐regulated gene clusters in frontal cortex area 8 involve neurotransmission, synaptic proteins and vesicle trafficking, whereas main down‐regulated genes cluster into oligodendrocyte function and myelin‐related proteins. RT‐qPCR validates the expression of 58 of 66 assessed genes from different clusters. The present results: a. reveal regional differences in de‐regulated gene expression between the anterior horn of the spinal cord and frontal cortex area 8 in the same individuals suffering from sALS; b. validate and extend our knowledge about the complexity of the inflammatory response in the anterior horn of the spinal cord; and c. identify for the first time extensive gene up‐regulation of neurotransmission and synaptic‐related genes, together with significant down‐regulation of oligodendrocyte‐ and myelin‐related genes, as important contributors to the pathogenesis of frontal cortex alterations in the sALS/frontotemporal lobar degeneration spectrum complex at stages with no apparent cognitive impairment.
reactive intracytoplasmic inclusions in neurons and oligodendocytes, and neuropil threads. Neuron loss and spongiosis in the upper cortical layers are usually restricted to cases with severe cognitive impairment and frontotemporal dementia [1, 2].
Several mechanisms have been proposed as contributory factors in the pathogenesis of motor neuron damage in sALS including excitoxicity, mitochondrial and energy metabolism failure, oxidative stress damage, altered glial cells, inflammation, cytoskeletal ab-normalities, alterations in RNA metabolism, and altered TDP-43 metabolism, among others [3-16]. Increased understanding on the pathogenesis of sALS has emerged from the use of transcriptome analysis of the spinal cord and motor cortex [17-26]. Previous transcriptomic studies center in the spinal cord and motor cortex in separate groups of patients, cover a limited number of cases, identify and validate a few genes not coincidental among the different studies. Selection of the sample may account for these differences. Further microarray studies carried out on isolated motor neurons of the spinal cord obtained by laser micro-dissection in sALS cases have revealed up-regulation of genes associated with cell signalling and cell death and down-regulation of genes linked to transcription and composition of the cytoskeleton [27]. Curiously, similar studies performed on samples from individuals bearing mutations linked to ALS show different regulated transcripts, thus suggesting gene expression variants in the spinal cord in fALS [28, 29]. Importantly, no gene expression analyses are available in the frontal cortex area 8 in sALS in spite that frontal alterations are common in this disease. Moreover, ALS
and FTLD with TDP inclusions (FTLD-TDP) are within the same disease spectrum [1].
The present study analyzes gene expression in the anterior horn of the spinal cord and frontal cortex area 8 in a series of 18 sALS cases and 23 controls. The main goals of the present study are to analyze and compare gene expression in these two regions, and more specifically to identify altered gene expression and clusters with specific functions in the anterior horn and frontal cortex area 8. Thus, the present study focuses on the pathogenesis of motor neuron damage responsible of altered motor function, and frontal cortex at preclinical stages of cognitive impairment.
RESULTS
Microarray analysis
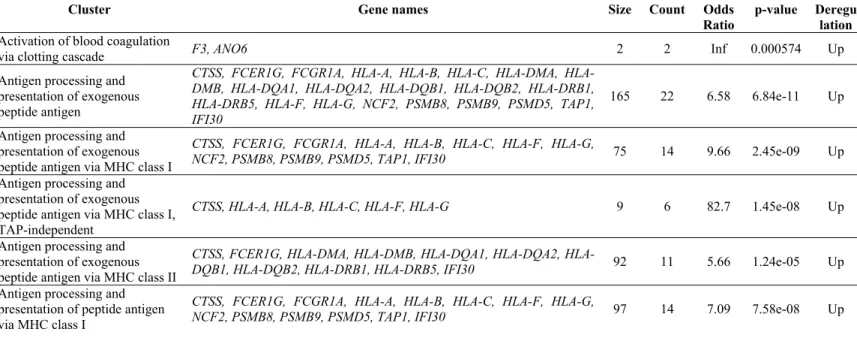
Cofactors age and gender were not relevant for the analysis. 9,563 gene sequences were detected across all samples. Heat map indicates differences in transcripts expression levels between control and ALS cases in the anterior cord of the spinal cord and in frontal cortex area 8 (Figure 1). We identified 747 genes differentially expressed with p-value lower than or equal to 0.05 in the anterior horn of the spinal cord (up: 507 and down: 240) and 2,300 genes differentially expressed in the frontal cortex area 8 (up: 1,409 and down: 891) in sALS (Figure 1).
Supplementary Tables 1 and 2 identify all de-regulated genes. Post-analysis microarray data of differentially ex-pressed genes assessed with enrichment analysis against Go Ontology database are shown in Tables 1 and 2.
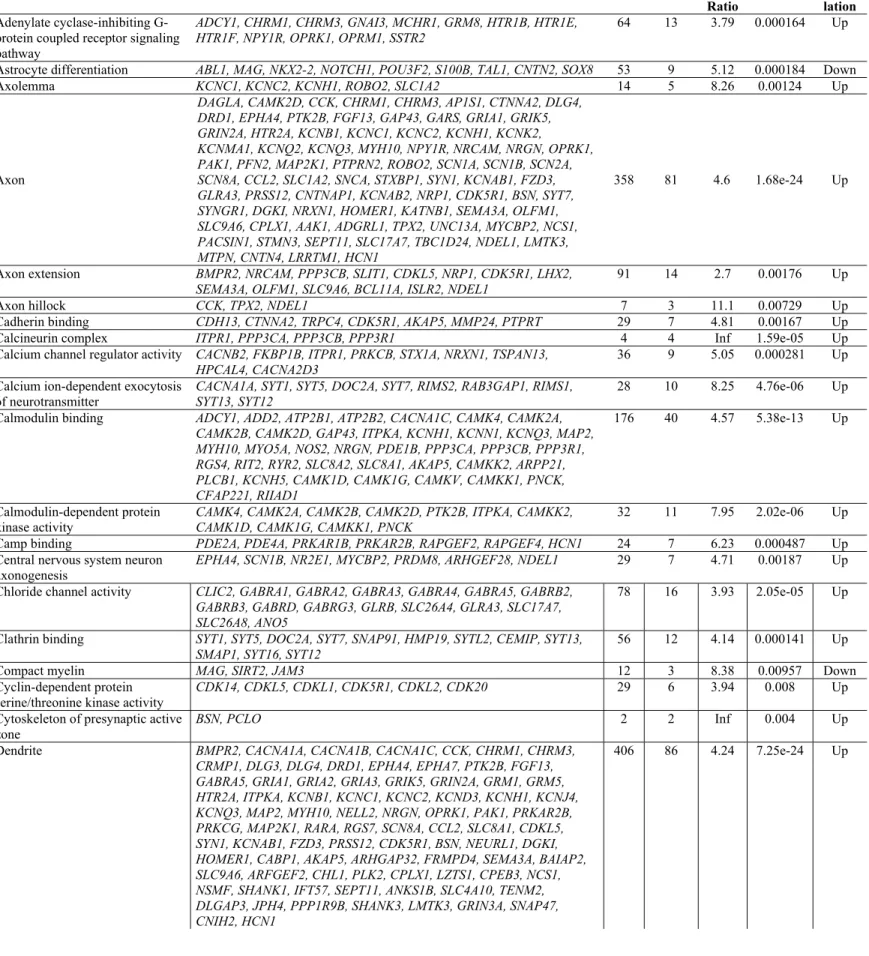
Table 1. Main significant clusters of altered genes in spinal cord of ALS samples.
Cluster Gene names Size Count Odds
Ratio
p-value Deregu lation
Activation of blood coagulation
via clotting cascade F3, ANO6 2 2 Inf 0.000574 Up
Antigen processing and presentation of exogenous peptide antigen
CTSS, FCER1G, FCGR1A, A, B, C, DMA, HLA-DMB, HLA-DQA1, HLA-DQA2, HLA-DQB1, HLA-DQB2, HLA-DRB1, HLA-DRB5, HLA-F, HLA-G, NCF2, PSMB8, PSMB9, PSMD5, TAP1, IFI30
165 22 6.58 6.84e-11 Up
Antigen processing and presentation of exogenous peptide antigen via MHC class I
CTSS, FCER1G, FCGR1A, HLA-A, HLA-B, HLA-C, HLA-F, HLA-G,
NCF2, PSMB8, PSMB9, PSMD5, TAP1, IFI30 75 14 9.66 2.45e-09 Up
Antigen processing and presentation of exogenous peptide antigen via MHC class I, TAP-independent
CTSS, HLA-A, HLA-B, HLA-C, HLA-F, HLA-G 9 6 82.7 1.45e-08 Up Antigen processing and
presentation of exogenous peptide antigen via MHC class II
CTSS, FCER1G, DMA, DMB, DQA1, DQA2,
HLA-DQB1, HLA-DQB2, HLA-DRB1, HLA-DRB5, IFI30 92 11 5.66 1.24e-05 Up
Antigen processing and presentation of peptide antigen via MHC class I
CTSS, FCER1G, FCGR1A, HLA-A, HLA-B, HLA-C, HLA-F, HLA-G,
Ratio lation
Apoptotic process
AHR, APOE, FAS, BCL2A1, BCL6, BMP2, BTK, CAMK2D, CASP1, CASP4, TNFSF8, CDKN1A, CTSC, DAB2, NQO1, ECT2, EDN1, F3, FCER1G, HCK, HGF, HIF1A, HMOX1, ICAM1, IFI16, IL1A, ITGA5, JAK3, LMNB1, LYN, MNDA, MYC, NCF2, NOS3, P2RX4, PLAGL1, PLAUR, PLSCR1, PRLR, PSMB8, PSMB9, PSMD5, PTPN2, CCL2, CCL19, SNAI2, STAT1, TEK, TGFB2, TLR2, TLR3, GPR65, YBX3, NOL3, SOCS3, LY86, IKBKE, CHL1, PPP1R15A, RRM2B, SHISA5, TNFRSF12A, ACSL5, FNIP2, DNASE2B, ZMAT3, NOA1, FGD3, IL33, DEDD2, ANO6
1745 71 1.89 5.22e-06 Up
Apoptotic signaling pathway FAS, BCL2A1, BTK, CASP4, CDKN1A, CTSC, ECT2, HGF, HIF1A, HMOX1, ICAM1, IFI16, IL1A, NOS3, P2RX4, PLAUR, PTPN2, SNAI2, TGFB2, TLR3, YBX3, NOL3, IKBKE, PPP1R15A, RRM2B, SHISA5, TNFRSF12A, ACSL5, FNIP2, FGD3, IL33, DEDD2
596 32 2.43 1.88e-05 Up
Axonemal dynein complex assembly
DNAH5, DNAI1, TEKT2, ZMYND10, ARMC4, DNAH7, CCDC114, CCDC151, DNAAF1, CCDC39
21 10 175 8.54e-18 Down
Axoneme DNAH5, DNAH9, SPAG6, DNAI1, DCDC2, HYDIN, CFAP46, ARMC4,
MNS1, DNAH7, CFAP74, CCDC114, CCDC151, DNAAF1, CFAP54, DNAH2, SPAG17, CFAP221, CCDC39, RSPH4A
89 20 52.5 1.31e-25 Down
Axoneme assembly DNAH5, DNAI1, TEKT2, ZMYND10, HYDIN, CFAP46, ARMC4,
DNAH7, CFAP74, RSPH1, CCDC114, CCDC151, DNAAF1, SPAG17, CCDC39, RSPH4A
42 16 128 5.9e-26 Down
B cell mediated immunity FAS, BCL6, BTK, C1QB, C1QC, C7, FCER1G, HLA-DMA, HLA-DQB1,
HLA-DRB1, HLA-DRB5, CFI, IL4R, CD226, TLR8 103 15 7.18 2.28e-08 Up
Cellular protein modification
process IL12RB1, INS, KCNE1, MAK, CFP, RASA4, TRAK2, MYLK3, NEK5, C17orf97, PPIAL4A 3527 11 0.473 0.00885 Down
Cellular response to interferon-gamma
CAMK2D, EDN1, FCGR1A, GBP1, HCK, A, B, C, HLA-DQA1, HLA-DQA2, HLA-DQB1, HLA-DQB2, HLA-DRB1, HLA-DRB5, HLA-F, HLA-G, ICAM1, IRF8, OAS2, PTPN2, CCL2, CCL19, STAT1, SOCS3, IFI30, TRIM38, TRIM5
126 27 11.9 1.95e-18 Up
Clathrin-coated endocytic vesicle membrane
FCGR1A, DQA1, DQA2, DQB1, DQB2, HLA-DRB1, HLA-DRB5
49 7 7.32 0.000108 Up
Copper ion import ATP7B, SLC31A1, STEAP4 7 3 30.7 0.000446 Up
Cytokine production involved in immune response
BCL6, BTK, FCER1G, HLA-A, HMOX1, JAK3, SLC11A1, TEK, TGFB2, TLR2, TLR3, TREM1
69 12 8,81 7,87E-08 Up
Endolysosome membrane TLR3, TLR7, TLR8 4 3 131 4.51e-05 Up
Fc receptor mediated stimulatory signaling pathway
FCER1G, FCGR1A, FCGR2A, FGR, HCK, ITPR3, LYN, PLSCR1, CD226, MYO1G
77 10 6.21 1.47e-05 Up
Humoral immune response mediated by circulating immunoglobulin
C1QB, C1QC, C7, HLA-DQB1, HLA-DRB1, HLA-DRB5, CFI 46 7 7.42 0.000103 Up
Igg binding FCER1G, FCGR1A, FCGR2A, FCGR2B 10 4 28.3 5.42e-05 Up
Immunoglobulin production FAS, BCL6, CD37, HLA-DQB1, HLA-DRB1, HLA-DRB5, IL4R, TNFSF13B, POLM, IL33
87 10 5.4 4.34e-05 Up
Inner dynein arm assembly TEKT2, ZMYND10, DNAH7, DNAAF1, CCDC39 10 5 182 1.44e-09 Down
Integral component of lumenal side of endoplasmic reticulum membrane
A, B, C, DQA1, DQA2, DQB1, HLA-DQB2, HLA-DRB1, HLA-DRB5, HLA-F, HLA-G
28 11 28.8 1.04e-11 Up
Interferon-alpha production TLR3, NMI, TLR7, TLR8 18 4 11.7 0.000764 Up
Interferon-beta biosynthetic
process TLR3, NMI, TLR7, TLR8 8 4 41.1 2.12e-05 Up
Interferon-gamma biosynthetic
process TLR3, EBI3, TLR7, TLR8 16 4 13.7 0.000472 Up
Interleukin-10 production FCER1G, HLA-DRB1, HLA-DRB5, JAK3, TLR2, PDCD1LG2 42 6 6.87 0.000463 Up
Intrinsic apoptotic signaling
pathway BCL2A1, CASP4, CDKN1A, HIF1A, HMOX1, IFI16, PLAUR, PTPN2, SNAI2, YBX3, NOL3, IKBKE, PPP1R15A, RRM2B, SHISA5, FNIP2 284 16 2.49 0.00143 Up
Macrophage activation IL4R, SLC11A1, TLR1, SBNO2, CD93, TLR7, TLR8, IL33 48 8 8.29 1.66e-05 Up
Mast cell cytokine production BCL6, FCER1G, HMOX1 7 3 30.7 0.000446 Up
MHC class II receptor activity HLA-DQA1, HLA-DQA2, HLA-DQB1, HLA-DQB2, HLA-DRB1 11 5 35.4 2.73e-06 Up
MHC protein complex A, B, C, DMA, DMB, DQA1, HLA-DQA2, HLA-DQB1, HLA-DQB2, HLA-DRB1, HLA-DRB5, HLA-F, HLA-G
Cluster Gene names Size Count Odds Ratio p-value Deregulation
Microtubule bundle formation DNAH5, DNAI1, TEKT2, ZMYND10, HYDIN, CFAP46, ARMC4, DNAH7, CFAP74, RSPH1, CCDC114, CCDC151, DNAAF1, SPAG17, CCDC39, RSPH4A
63 16 70.7 1.18e-22 Down
Monocyte chemotaxis CCR1, LYN, CCL2, CCL19, PLA2G7, ANO6 49 6 5.75 0.00107 Up
Outer dynein arm assembly DNAH5, DNAI1, ZMYND10, ARMC4, CCDC114, CCDC151, DNAAF1 11 7 325 5.6e-14 Down
Peptide antigen binding A, B, C, DQA1, DQB1, DRB1,
HLA-DRB5, HLA-F, HLA-G, TAP1 26 10 26.9 1.57e-10 Up
Platelet-derived growth factor
receptor binding TYMP, ITGA5, ITGB3, LYN 12 4 21.2 0.000123 Up
Positive regulation of Fc receptor mediated stimulatory signaling pathway
LYN, CD226 2 2 Inf 0.000574 Up
Positive regulation of
interleukin-6 production FCER1G, TLR1, TLR2, TLR3, TLR7, IL33 55 6 5.05 0.00197 Up
Positive regulation of
interleukin-8 production TLR2, TLR3, TLR5, TLR7, TLR8 42 5 5.56 0.00318 Up
Positive regulation of tumor necrosis factor production
FCER1G, CCL2, CCL19, TLR1, TLR2, TLR3 51 6 5.5 0.00133 Up Protection from natural killer cell
mediated cytotoxicity
HLA-A, HLA-B, TAP1 5 3 61.5 0.000132 Up Regulated secretory pathway ANXA3, FCER1G, FGR, HCK, HMOX1, IL4R, LYN, STX11, CD300A,
RAB11FIP2, RAB11FIP1
73 11 7.4 1.23e-06 Up
Regulation of apoptotic process APOE, FAS, BCL2A1, BCL6, BMP2, BTK, CAMK2D, CASP1, CASP4, CDKN1A, CTSC, DAB2, NQO1, ECT2, EDN1, F3, FCER1G, HCK, HGF, HIF1A, HMOX1, ICAM1, IL1A, ITGA5, JAK3, LYN, MNDA, MYC, NCF2, NOS3, PLAUR, PRLR, PSMB8, PSMB9, PSMD5, PTPN2, CCL2, CCL19, SNAI2, STAT1, TEK, TGFB2, TLR3, YBX3, NOL3, SOCS3, CHL1, RRM2B, TNFRSF12A, ACSL5, ZMAT3, FGD3, DEDD2, ANO6
1344 54 1.82 0.000117 Up
Regulation of B cell apoptotic
process BCL6, BTK, LYN 16 3 9.45 0.00608 Up
Regulation of coagulation APOE, EDN1, F3, FCER1G, LYN, NOS3, PLAU, PLAUR, THBD, HPSE,
ADAMTS18, ANO6 85 12 6.87 8.31e-07 Up
Regulation of cytokine biosynthetic process
CD86, HMOX1, IL1A, TLR1, TLR2, TLR3, NMI, EBI3, TLR7, TLR8 93 10 5.01 7.72e-05 Up Regulation of extrinsic apoptotic
signaling pathway
FAS, HMOX1, ICAM1, IL1A, NOS3, SNAI2, TGFB2, NOL3, TNFRSF12A, ACSL5, DEDD2
155 11 3.17 0.0013 Up Regulation of Fc receptor
mediated stimulatory signaling pathway
LYN, PLSCR1, CD226 5 3 61.5 0.000132 Up Regulation of hemostasis APOE, EDN1, F3, FCER1G, LYN, NOS3, PLAU, PLAUR, THBD, HPSE,
ADAMTS18, ANO6
81 12 7.27 4.87e-07 Up
Regulation of leukocyte apoptotic process
BCL6, BTK, FCER1G, HIF1A, JAK3, LYN, CCL19, TGFB2 74 8 5.02 0.000386 Up Regulation of lipid kinase
activity FGR, LYN, CCL19, TEK, NRBF2 47 5 4.89 0.0052 Up
Regulation of mast cell activation FCER1G, FGR, HMOX1, IL4R, LYN, PLSCR1, CD226, CD300A 31 8 14.4 4.96e-07 Up
Regulation of mast cell
degranulation FCER1G, FGR, HMOX1, IL4R, LYN, CD300A 24 6 13.8 1.71e-05 Up
Regulation of microtubule
movement DNAH11, ARMC4, DNAAF1, CCDC39 18 4 51.3 3.03e-06 Down
Regulation of natural killer cell
mediated immunity HLA-A, HLA-B, PVR, TAP1, CD226 27 5 9.36 0.000405 Up
Regulation of protein metabolic process
FOXJ1, INS, CFP, RASA4, NEK5, DTHD1 2448 6 0.381 0.00803 Down Regulation of protein
modification process
INS, RASA4 1641 2 0.192 0.00288 Down Regulation of T-helper 1 cell
differentiation HLX, IL4R, JAK3, CCL19 9 4 32.9 3.74e-05 Up
T cell costimulation CD86, HLA-DQA1, HLA-DQA2, HLA-DQB1, HLA-DQB2, HLA-DRB1,
HLA-DRB5, LYN, CCL19, TNFSF13B, PDCD1LG2 71 11 7.65 9.25e-07 Up
TAP binding HLA-A, HLA-B, HLA-C, HLA-F, TAP1 7 5 106 1.34e-07 Up
cord cluster into inflammatory responses, metal ion regu-lation and hemostasis; whereas down-regulated genes cluster into neuronal axonal cytoskeleton and apoptosis. In contrast, clusters of up-regulated genes were involv-
synapses, maintenance of axons and dendrites, intracellular signaling and synaptic vesicle mechanisms. The majority of down-regulated genes were encoded for proteins associated with myelin and glial cell regulation (Figure 2).
Figure 1. (A) Total number of significantly different expressed genes comparing transcriptomic profiles between groups and regions. (B) Hierarchical clustering heat map of expression intensities of mRNA array transcripts reflect differential gene expression profiles in the anterior horn of the spinal cord and frontal cortex area 8 in ALS compared with controls. Differences between groups are considered statistically significant at p‐value ≤ 0.05. Abbreviations: ALS: amyotrophic lateral sclerosis; FC: frontal cortex area 8; mRNA: messenger RNA; SP: anterior horn of the spinal cord lumbar level.
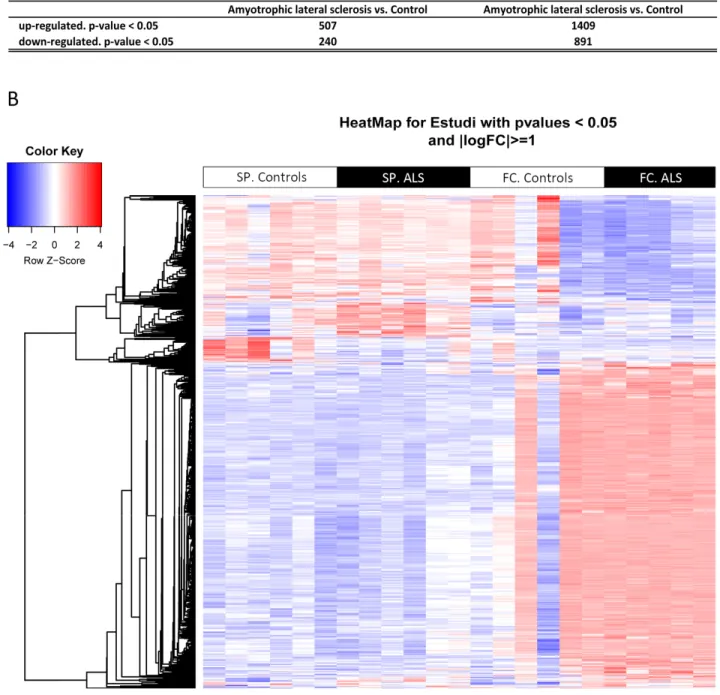
Table 2. Main significant clusters of altered genes in frontal cortex of ALS samples.
Cluster Gene names Size Count Odds
Ratio p-value Deregulation
Adenylate cyclase-inhibiting G-protein coupled receptor signaling pathway
ADCY1, CHRM1, CHRM3, GNAI3, MCHR1, GRM8, HTR1B, HTR1E, HTR1F, NPY1R, OPRK1, OPRM1, SSTR2
64 13 3.79 0.000164 Up
Astrocyte differentiation ABL1, MAG, NKX2-2, NOTCH1, POU3F2, S100B, TAL1, CNTN2, SOX8 53 9 5.12 0.000184 Down
Axolemma KCNC1, KCNC2, KCNH1, ROBO2, SLC1A2 14 5 8.26 0.00124 Up
Axon
DAGLA, CAMK2D, CCK, CHRM1, CHRM3, AP1S1, CTNNA2, DLG4, DRD1, EPHA4, PTK2B, FGF13, GAP43, GARS, GRIA1, GRIK5, GRIN2A, HTR2A, KCNB1, KCNC1, KCNC2, KCNH1, KCNK2,
KCNMA1, KCNQ2, KCNQ3, MYH10, NPY1R, NRCAM, NRGN, OPRK1, PAK1, PFN2, MAP2K1, PTPRN2, ROBO2, SCN1A, SCN1B, SCN2A, SCN8A, CCL2, SLC1A2, SNCA, STXBP1, SYN1, KCNAB1, FZD3, GLRA3, PRSS12, CNTNAP1, KCNAB2, NRP1, CDK5R1, BSN, SYT7, SYNGR1, DGKI, NRXN1, HOMER1, KATNB1, SEMA3A, OLFM1, SLC9A6, CPLX1, AAK1, ADGRL1, TPX2, UNC13A, MYCBP2, NCS1, PACSIN1, STMN3, SEPT11, SLC17A7, TBC1D24, NDEL1, LMTK3, MTPN, CNTN4, LRRTM1, HCN1
358 81 4.6 1.68e-24 Up
Axon extension BMPR2, NRCAM, PPP3CB, SLIT1, CDKL5, NRP1, CDK5R1, LHX2,
SEMA3A, OLFM1, SLC9A6, BCL11A, ISLR2, NDEL1 91 14 2.7 0.00176 Up
Axon hillock CCK, TPX2, NDEL1 7 3 11.1 0.00729 Up
Cadherin binding CDH13, CTNNA2, TRPC4, CDK5R1, AKAP5, MMP24, PTPRT 29 7 4.81 0.00167 Up
Calcineurin complex ITPR1, PPP3CA, PPP3CB, PPP3R1 4 4 Inf 1.59e-05 Up
Calcium channel regulator activity CACNB2, FKBP1B, ITPR1, PRKCB, STX1A, NRXN1, TSPAN13,
HPCAL4, CACNA2D3
36 9 5.05 0.000281 Up
Calcium ion-dependent exocytosis
of neurotransmitter CACNA1A, SYT1, SYT5, DOC2A, SYT7, RIMS2, RAB3GAP1, RIMS1, SYT13, SYT12 28 10 8.25 4.76e-06 Up
Calmodulin binding ADCY1, ADD2, ATP2B1, ATP2B2, CACNA1C, CAMK4, CAMK2A,
CAMK2B, CAMK2D, GAP43, ITPKA, KCNH1, KCNN1, KCNQ3, MAP2, MYH10, MYO5A, NOS2, NRGN, PDE1B, PPP3CA, PPP3CB, PPP3R1, RGS4, RIT2, RYR2, SLC8A2, SLC8A1, AKAP5, CAMKK2, ARPP21, PLCB1, KCNH5, CAMK1D, CAMK1G, CAMKV, CAMKK1, PNCK, CFAP221, RIIAD1
176 40 4.57 5.38e-13 Up
Calmodulin-dependent protein
kinase activity CAMK4, CAMK2A, CAMK2B, CAMK2D, PTK2B, ITPKA, CAMKK2, CAMK1D, CAMK1G, CAMKK1, PNCK 32 11 7.95 2.02e-06 Up
Camp binding PDE2A, PDE4A, PRKAR1B, PRKAR2B, RAPGEF2, RAPGEF4, HCN1 24 7 6.23 0.000487 Up
Central nervous system neuron
axonogenesis EPHA4, SCN1B, NR2E1, MYCBP2, PRDM8, ARHGEF28, NDEL1 29 7 4.71 0.00187 Up
Chloride channel activity CLIC2, GABRA1, GABRA2, GABRA3, GABRA4, GABRA5, GABRB2, GABRB3, GABRD, GABRG3, GLRB, SLC26A4, GLRA3, SLC17A7, SLC26A8, ANO5
78 16 3.93 2.05e-05 Up
Clathrin binding SYT1, SYT5, DOC2A, SYT7, SNAP91, HMP19, SYTL2, CEMIP, SYT13,
SMAP1, SYT16, SYT12 56 12 4.14 0.000141 Up
Compact myelin MAG, SIRT2, JAM3 12 3 8.38 0.00957 Down
Cyclin-dependent protein
serine/threonine kinase activity CDK14, CDKL5, CDKL1, CDK5R1, CDKL2, CDK20 29 6 3.94 0.008 Up
Cytoskeleton of presynaptic active
zone BSN, PCLO 2 2 Inf 0.004 Up
Dendrite BMPR2, CACNA1A, CACNA1B, CACNA1C, CCK, CHRM1, CHRM3,
CRMP1, DLG3, DLG4, DRD1, EPHA4, EPHA7, PTK2B, FGF13, GABRA5, GRIA1, GRIA2, GRIA3, GRIK5, GRIN2A, GRM1, GRM5, HTR2A, ITPKA, KCNB1, KCNC1, KCNC2, KCND3, KCNH1, KCNJ4, KCNQ3, MAP2, MYH10, NELL2, NRGN, OPRK1, PAK1, PRKAR2B, PRKCG, MAP2K1, RARA, RGS7, SCN8A, CCL2, SLC8A1, CDKL5, SYN1, KCNAB1, FZD3, PRSS12, CDK5R1, BSN, NEURL1, DGKI, HOMER1, CABP1, AKAP5, ARHGAP32, FRMPD4, SEMA3A, BAIAP2, SLC9A6, ARFGEF2, CHL1, PLK2, CPLX1, LZTS1, CPEB3, NCS1, NSMF, SHANK1, IFT57, SEPT11, ANKS1B, SLC4A10, TENM2, DLGAP3, JPH4, PPP1R9B, SHANK3, LMTK3, GRIN3A, SNAP47, CNIH2, HCN1
Ratio lation
Dendrite development ADGRB3, CACNA1A, CAMK2B, CTNNA2, DLG4, EPHA4, HPRT1, ITPKA, MAP2, MEF2C, PAK1, PAK3, PPP3CA, CDKL5, NR2E1, NRP1, CDK5R1, NEURL1, AKAP5, RAPGEF2, KIAA0319, SEMA3A, BAIAP2, SLC9A6, PLK2, CIT, LZTS1, CPEB3, NEDD4L, MAPK8IP2, RBFOX2, NGEF, NSMF, SLITRK5, PACSIN1, SHANK1, DCDC2, BCL11A, FEZF2, CAMK1D, SHANK3, GRIN3A, FMN1
178 43 4.85 1.44e-14 Up
Dendrite extension PARK2, SYT1, RIMS2, SLC9A6, RIMS1, UNC13A, NEDD4L, CPNE5 21 8 9.12 2.53e-05 Up
Dendrite morphogenesis ADGRB3, CACNA1A, CAMK2B, CTNNA2, DLG4, EPHA4, HPRT1, ITPKA, MAP2, PAK3, PPP3CA, CDKL5, NR2E1, CDK5R1, AKAP5, RAPGEF2, SEMA3A, BAIAP2, CIT, LZTS1, NEDD4L, MAPK8IP2, RBFOX2, NGEF, NSMF, SLITRK5, SHANK1, DCDC2, SHANK3, FMN1
109 30 5.73 4E-12 Up
Dendritic shaft CACNA1C, DLG3, DRD1, GRM5, HTR2A, MAP2, PRKAR2B, SLC8A1,
HOMER1, AKAP5, LZTS1, JPH4, CNIH2
37 13 8.11 2.07e-07 Up
Dendritic spine development CAMK2B, DLG4, EPHA4, ITPKA, MEF2C, PAK1, PAK3, CDK5R1,
NEURL1, BAIAP2, SLC9A6, PLK2, CPEB3, NGEF, SHANK1, SHANK3 58 16 5.68 4.06e-07 Up
Dendritic spine membrane ATP2B1, GRIA1, ITGA8, AKAP5, DDN 9 5 18.6 0.000102 Up
DNA metabolic process BMPR2, CDKN2D, CIDEA, DACH1, HGF, IGF1, KCNK2, KPNA2, MAS1, KITLG, ORC4, PAK3, PIK3CA, PRKCG, CHAF1B, CDC7, NPM2, PPARGC1A, PARM1, CHD5, UBE2W, FBXW7, TSPYL2, BCL11B, SLF1, TBRG1, MAEL, XRCC6BP1, ZBED9, KLHDC3, STOX1, KIAA2022
867 32 0.549 0.000264 Up
Ensheathment of neurons MYRF, LPAR1, KCNJ10, KEL, MAG, MAL, NGFR, CLDN11, PMP22, POU3F2, KLK6, CNTN2, QKI, ARHGEF10, OLIG2, NDRG1, SIRT2, PARD3, FA2H, SH3TC2, JAM3, NKX6-2, SERINC5
101 23 7.53 4.57e-12 Down
Excitatory postsynaptic potential DLG4, PTK2B, GRIK5, GRIN2A, GRIN2B, MEF2C, PPP3CA, SNCA, STX1A, DGKI, NRXN1, RIMS2, RAB3GAP1, RIMS1, MAPK8IP2, SHANK1, CELF4, SLC17A7, NETO1, SHANK3
50 20 9.99 7.46e-12 Up
GABA receptor activity GABRA1, GABRA2, GABRA3, GABRA4, GABRA5, GABRB2, GABRB3,
GABRD, GABRG3, GABBR2 22 10 12.6 2.77e-07 Up
GABA receptor binding GABRA5, AKAP5, ARFGEF2, JAKMIP1 14 4 6.03 0.0091 Up
Glial cell development MYRF, GSN, KCNJ10, NKX2-2, POU3F2, CNTN2, ARHGEF10, NDRG1,
SIRT2, PHGDH, PARD3, FA2H, SH3TC2, NKX6-2 71 14 6.19 4.84e-07 Down
Glutamate receptor activity PTK2B, GRIA1, GRIA2, GRIA3, GRIK5, GRIN2A, GRIN2B, GRM1,
GRM5, GRM8, GRIN3A 27 11 10.4 2.72e-07 Up
Innervation GABRA5, GABRB2, GABRB3, PRKCG, NRP1, SEMA3A, UNC13A 23 7 6.47 0.000412 Up
Inositol phosphate metabolic
process PTK2B, ITPKA, MAS1, OCRL, SNCA, INPP4B, SYNJ1, PPIP5K1, PLCH1, PLCB1, NUDT11 65 11 3.02 0.00247 Up
Ionotropic glutamate receptor
activity PTK2B, GRIA1, GRIA2, GRIA3, GRIK5, GRIN2A, GRIN2B, GRIN3A 19 8 11 9.08e-06 Up
JNK cascade ADORA2B, EPHA4, PTK2B, FGF14, MAP3K9, MAP3K10, GADD45B,
PAK1, PARK2, MAPK9, CCL19, MAP2K4, MAP3K6, RB1CC1, RASGRP1, PLCB1, MAPK8IP2, KIAA1804, DUSP19, ZNF675, MAGI3
185 21 1.9 0.00716 Up
Lipid binding ABCA1, ANXA5, APOD, AR, C3, LPAR1, HSD17B10, HIP1, HSPA2,
KCNJ2, MAL, MYO1E, NPC1, P2RX7, PLD1, PTGS1, SELL, SNX1, ACOX2, IQGAP1, HIP1R, CYTH1, STARD3, FNBP1, RASGRP3, LDLRAP1, GLTP, ANKFY1, PXK, ADAP2, PARD3, PREX1, WDFY4, PLEKHF1, PRAM1, PAQR8, MVB12B, SNX29, SYTL4, ARAP1, FRMPD2, AMER2, NCF1C, C8orf44-SGK3
601 44 2.07 2.63e-05 Down
Mrna processing LGALS3, CELF2, PPARGC1A, CELF3, CPEB3, RBFOX2, RBFOX1,
MTPAP, CELF4, CELF5, SRRM4, LSM11, RBFOX3 417 13 0.466 0.00202 Up
Myelin maintenance MYRF, NDRG1, FA2H, SH3TC2 11 4 14.2 0.000601 Down
Myelin sheath CA2, CNP, CRYAB, GSN, HSPA2, MAG, MOBP, MOG, MYO1D,
CLDN11, RDX, CNTN2, NDRG1, SIRT2, PHGDH, GJC2, ERMN, MYH14, JAM3, SERINC5
156 20 3.77 2.29e-06 Down
Myelination MYRF, LPAR1, KCNJ10, KEL, MAG, MAL, NGFR, PMP22, POU3F2,
KLK6, CNTN2, QKI, ARHGEF10, OLIG2, NDRG1, SIRT2, PARD3, FA2H, SH3TC2, JAM3, NKX6-2, SERINC5
98 22 7.38 1.81e-11 Down
Negative regulation of neuron apoptotic process
CACNA1A, PTK2B, GABRA5, GABRB2, GABRB3, MEF2C, PARK2, PIK3CA, PRKCG, CCL2, SNCB, SNCA, STAR, STXBP1, NRP1, CHL1, PPARGC1A, OXR1, AGAP2
Cluster Gene names Size Count Odds Ratio p-value Deregu lation Negative regulation of transcription, DNA-templated
ARNTL, RUNX1T1, CRYM, CYP1B1, DACH1, FGF9, FOXG1, H2AFZ, MEF2C, MAP3K10, TRIM37, PDE2A, RARA, RORB, SATB1, SNCA, SOX5, TBX15, THRB, NR2E1, WNT10B, CDK5R1, LRRFIP1, ZBTB33, BASP1, ZBTB18, KLF12, CPEB3, PLCB1, SATB2, NEDD4L, SIRT5, RBFOX2, ATAD2, TAGLN3, BCL11A, FEZF2, SMYD2, PRDM8, TENM2, MTA3, SCRT1, MAEL, PRICKLE1, EID2, ARX, ZNF675, KCTD1
1135 48 0.632 0.00083 Up
Neuron apoptotic process CACNA1A, EPHA7, PTK2B, GABRA5, GABRB2, GABRB3, GRIK5, KCNB1, MEF2C, PAK3, PARK2, PIK3CA, PRKCG, SCN2A, CCL2, SNCB, SNCA, STAR, STXBP1, NRP1, CDK5R1, CHL1, PPARGC1A, NSMF, OXR1, FBXW7, AGAP2, SDIM1
206 28 2.35 0.000117 Up
Neuron spine DLG4, DRD1, EPHA4, GRIA1, GRM5, ITPKA, MYH10, NRGN,
PRKAR2B, SLC8A1, CDK5R1, NEURL1, DGKI, AKAP5, ARHGAP32, FRMPD4, BAIAP2, SLC9A6, ARFGEF2, LZTS1, SHANK1, SEPT11, ANKS1B, TENM2, DLGAP3, PPP1R9B, SHANK3, CNIH2
104 28 5.57 3.28e-11 Up
Neuronal postsynaptic density ADD2, ATP1A1, BMPR2, CAMK2A, CAMK2B, CTNNA2, DLG4, DMTN, GAP43, GRIN2B, MAP2, PAK1, PRKCG, BSN, DGKI, DLGAP1, HOMER1, BAIAP2, CAP2, CNKSR2, CLSTN1, MAPK8IP2, SHANK1, CLSTN2, SHANK3
64 25 9.69 3.02e-14 Up
Neuron-neuron synaptic
transmission CA7, CACNA1A, CACNB4, CAMK4, DRD1, PTK2B, GABRA1, GABRB2, GLRB, GRIA1, GRIA2, GRIA3, GRIK5, GRIN2A, GRM1, GRM5, GRM8, HRH2, HTR1B, HTR2A, MEF2C, NPY5R, PAK1, PARK2, PRKCE, PTGS2, SNCA, STXBP1, SYT1, GLRA3, DGKI, DLGAP2, NRXN1, RAB3GAP1, UNC13A, MAPK8IP2, RASD2, TMOD2, SHC3, SLC17A7, SHANK3, GRIN3A, CNIH2
136 43 7.06 2.63e-19 Up
Neurotransmitter secretion CACNA1A, CACNA1B, CAMK2A, GAD1, GLS, GRIK5, MEF2C, PAK1, PARK2, PFN2, SLC1A1, SLC1A2, SNCA, STX1A, STXBP1, SYN1, SYN2, SYT1, SYT5, DOC2A, PPFIA4, PPFIA2, PPFIA3, CADPS, LIN7A, SYNJ1, SYT7, DGKI, BZRAP1, NRXN1, RIMS2, RIMS3, CPLX1, HRH3, ADGRL1, RAB3GAP1, RIMS1, UNC13A, PCLO, SYTL2, SLC17A7, SYT13, SYT16, SYT12, CADPS2, SNAP47
154 46 6.52 1.93e-19 Up
Node of Ranvier KCNQ2, KCNQ3, SCN1A, SCN1B, SCN2A, SCN8A 15 6 9.92 0.000193 Up
Nucleic acid metabolic process ABCA2, ABL1, PARP4, AR, ATM, BMP8B, MYRF, CAPN3, CAT, CBFB, CCNA2, CDKN1C, CENPB, ELF1, EYA4, ERF, FGF1, FGFR2, GDF1, HSD17B10, HDAC1, HIP1, HOXA1, HOXA2, HOXA5, HOXB2, HOXB5, HOXD1, HOXD3, HSPA1A, FOXN2, JUP, SMAD5, SMAD9, MCM7, MEIS1, CIITA, FOXO4, NKX2-2, NOTCH1, YBX1, PBX3, PDE8A, ENPP2, POLR2L, POU3F2, PSEN1, RNH1, RPLP0, RPS5, RXRG, SALL1, SGK1, SOX10, SREBF1, STAT2, SYK, TAL1, TCF12, TRAF1, TRPS1, ZNF3, ZNF69, VEZF1, FZD5, ARHGEF5, HIST1H2AC, HIST1H3E, HIST1H4H, HIST1H4B, RNASET2, CCNE2, QKI, LITAF, ST18, ZNF536, DDX39A, OLIG2, HMG20B, SEMA4D, TXNIP, DMRT2, TCFL5, ATF7, IKZF2, ZNF652, SIRT2, SAMD4A, KANK1, HEY2, BAMBI, ZNF521, ZBTB20, GREM1, CECR2, HIPK2, KLF15, BAZ2B, SLC40A1, SOX8, ZBTB7B, RRNAD1, KLF3, DDIT4, ZNF280D, TRIM62, CHD7, SLF2, ZNF83, SLC2A4RG, OTUD7B, BBX, MAVS, SFMBT2, NCOA5, TP53INP2, ZNF462, ARHGAP22, CREB3L2, CRTC3, TRAK2, BHLHE41, DBF4B, TSC22D4, NKX6-2, ZBTB37, LOXL3, OLIG1, ZSWIM7, GABPB2, CC2D1B, ZBTB12, ZNF844, ZNF326, FRYL, C9orf142, ZNF710, GTF2IRD2B, DBX2, HIST2H4B, ZNF812, TMEM229A, GTF2H2C_2, C8orf44-SGK3
4679 144 0.718 0.000284 Up
Oligodendrocyte development MYRF, GSN, KCNJ10, NKX2-2, CNTN2, FA2H, NKX6-2 32 7 6.99 0.000187 Down
Oligodendrocyte differentiation BOK, MYRF, CNP, GSN, KCNJ10, NKX2-2, NOTCH1, SOX10, CNTN2, OLIG2, SOX8, FA2H, NKX6-2
75 13 5.27 5.64e-06 Down
Phosphatase activity ALPL, ATP1A1, CDKN3, DUSP8, OCRL, PPP2R5D, PPP3CA, PPP3CB, PPP3R1, MAP2K1, PTPN3, PTPN4, PTPRN2, PTPRR, INPP4B, SYNJ1, PPIP5K1, LPPR4, PTPRT, PTP4A3, NT5DC3, PDP1, LPPR3, PTPN5, DUSP19, PPM1L, PPM1J
254 27 1.81 0.00475 Up
Phosphatidylinositol binding HIP1, KCNJ2, MYO1E, PLD1, SNX1, IQGAP1, HIP1R, LDLRAP1, ANKFY1, PXK, ADAP2, PARD3, PLEKHF1, SNX29, ARAP1, FRMPD2, AMER2, NCF1C, C8orf44-SGK3
Ratio lation
Phospholipase C-activating G-protein coupled receptor signaling pathway
ADRA1B, CCKBR, CHRM1, CHRM3, DRD1, GRM1, GRM5, HRH2, HTR2A, OPRK1, OPRM1, HOMER1, MCHR2
81 13 2.84 0.00172 Up
Phospholipid binding ABCA1, ANXA5, LPAR1, HIP1, KCNJ2, MYO1E, PLD1, SNX1, IQGAP1, HIP1R, LDLRAP1, ANKFY1, PXK, ADAP2, PARD3, PREX1, WDFY4, PLEKHF1, SNX29, SYTL4, ARAP1, FRMPD2, AMER2, NCF1C, C8orf44-SGK3
332 25 2.1 0.000966 Down
Phospholipid translocation ABCA1, P2RX7, ATP10B, ATP11A 20 4 6.21 0.00667 Down
Positive regulation of RNA metabolic process
ACVR1B, ARNTL, BMPR2, CAMK4, CAMK2A, CDH13, ETV1, H2AFZ, HGF, IGF1, KRAS, LUM, MEF2C, TRIM37, PPP1R12A, NEUROD2, PARK2, PLAGL1, PPP3CA, PPP3CB, PPP3R1, PRKCB, MAPK9, MAP2K1, RARA, RORB, SOX5, STAT4, THRB, NR2E1, TRAF5, WNT10B, ITGA8, LMO4, LDB2, LHX2, MICAL2, CAMKK2, TBR1, PPARGC1A, MLLT11, CELF3, KLF12, CPEB3, MAPRE3, DDN, PLCB1, SATB2, ATAD2, BCL11A, TESC, FEZF2, FBXW7, DCAF6, CELF4, ARNTL2, ATXN7L3, CAMK1D, MKL2, NEUROD6, BCL11B, CSRNP3, MED12L, RHEBL1, MTPN, SOHLH1
1455 66 0.678 0.0011 Up
Postsynapse ADD2, ATP1A1, BMPR2, CACNA1C, CAMK2A, CAMK2B, CHRM1,
CHRM3, CTNNA2, DLG3, DLG4, DRD1, DMTN, EPHA4, EPHA7, PTK2B, GABRA1, GABRA2, GABRA3, GABRA4, GABRA5, GABRB2, GABRB3, GABRD, GABRG3, GAP43, GLRB, GRIA1, GRIA2, GRIA3, GRIK5, GRIN2A, GRIN2B, GRM1, GRM5, ITPKA, ITPR1, KCNB1, KCNC2, KCNJ4, KCNMA1, MAP2, MYH10, NRGN, PAK1, PRKAR2B, PRKCG, SLC8A1, GLRA3, KCNAB2, ITGA8, LIN7A, CDK5R1, BSN, NEURL1, DGKI, DLGAP2, DLGAP1, HOMER1, CABP1, AKAP5, GABBR2, ARHGAP32, FRMPD4, LZTS3, BAIAP2, CAP2, ARFGEF2, LZTS1, CNKSR2, CLSTN1, RIMS1, SYNE1, NCS1, MAPK8IP2, NSMF, PCLO, SHANK1, SEPT11, ANKS1B, TENM2, LRFN2, KCTD16, LRRC7, DLGAP3, CACNG8, CLSTN2, LRRTM4, NETO1, PPP1R9B, SHANK3, CADPS2, GRIN3A, GRASP, CNIH2, LRRTM1, LRRTM3, IQSEC3
341 98 6.47 7.81e-39 Up
Postsynaptic membrane CHRM1, CHRM3, DLG3, DLG4, EPHA4, EPHA7, GABRA1, GABRA2, GABRA3, GABRA4, GABRA5, GABRB2, GABRB3, GABRD, GABRG3, GLRB, GRIA1, GRIA2, GRIA3, GRIK5, GRIN2A, GRIN2B, KCNB1, KCNC2, KCNJ4, KCNMA1, GLRA3, LIN7A, NEURL1, DLGAP2, DLGAP1, HOMER1, CABP1, GABBR2, ARHGAP32, LZTS3, LZTS1, CNKSR2, CLSTN1, SYNE1, NCS1, NSMF, SHANK1, ANKS1B, TENM2, LRFN2, KCTD16, LRRC7, DLGAP3, CACNG8, CLSTN2, LRRTM4, NETO1, SHANK3, CADPS2, GRIN3A, GRASP, CNIH2, LRRTM1, LRRTM3, IQSEC3
197 61 6.98 1.99e-26 Up
Potassium channel activity KCNB1, KCNC1, KCNC2, KCND3, KCNF1, KCNH1, KCNJ3, KCNJ4, KCNJ6, KCNJ9, KCNK2, KCNMA1, KCNN1, KCNQ2, KCNQ3, KCNS1, KCNS2, KCNAB1, KCNAB2, KCNAB3, KCNH4, KCNH3, KCNV1, KCNH5, KCNIP2, KCNQ5, KCNT1, KCNK15, KCNIP4, KCNH7, KCNG3, KCNT2, HCN1
119 33 5.93 1.53e-13 Up
Presynapse DLG4, GABRA2, GRIA1, GRIA2, GRIN2B, ICA1, NPY1R, SNCA, STX1A,
SYN1, SYN2, SYT1, SYT5, SLC30A3, FZD3, DOC2A, PPFIA4, PPFIA2, PPFIA3, BSN, SYT7, SYNGR1, DGKI, RIMS2, RIMS3, SV2B, DNM1L, RIMS1, UNC13A, DMXL2, ERC2, PCLO, SVOP, SLC17A7, SYT12, TPRG1L, SYNPR, STXBP5, SCAMP5, SLC6A17, UNC13C
142 41 6.21 5.89e-17 Up
Presynaptic active zone SYN1, FZD3, PPFIA4, PPFIA2, PPFIA3, BSN, DGKI, RIMS2, RIMS3,
RIMS1, UNC13A, ERC2, PCLO, SLC17A7, UNC13C 24 15 25 7.23e-13 Up
Protein kinase C-activating G-protein coupled receptor signaling pathway
CCK, CHRM1, DGKB, GAP43, GRM1, GRM5, HTR1B, DGKZ, DGKE, DGKI
32 10 6.74 1.85e-05 Up
Protein lipidation ABCA1, ZDHHC9, PIGT, HHATL, ZDHHC14, ZDHHC11, MAP6D1,
ATG4C, PIGM, ZDHHC20 84 10 3.38 0.00152 Down
Regulation of axon guidance BMPR2, NRP1, SEMA3A, TBR1, FEZF2 18 5 5.68 0.00441 Up
Regulation of neuron apoptotic
process CACNA1A, EPHA7, PTK2B, GABRA5, GABRB2, GABRB3, GRIK5, KCNB1, MEF2C, PAK3, PARK2, PIK3CA, PRKCG, CCL2, SNCB, SNCA, STAR, STXBP1, NRP1, CDK5R1, CHL1, PPARGC1A, NSMF, OXR1, FBXW7, AGAP2
Cluster Gene names Size Count Odds Ratio p-value Deregu lation Regulation of neurotransmitter levels
DAGLA, CACNA1A, CACNA1B, CAMK2A, DRD1, GABRA2, GAD1, GLS, GRIK5, MEF2C, PAK1, PARK2, PDE1B, PFN2, SLC1A1, SLC1A2, SNCA, STX1A, STXBP1, SYN1, SYN2, SYT1, SYT5, DOC2A, PPFIA4, PPFIA2, PPFIA3, CADPS, LIN7A, SYNJ1, SYT7, DGKI, BZRAP1, NRXN1, RIMS2, RIMS3, CPLX1, HRH3, ADGRL1, RAB3GAP1, RIMS1, UNC13A, PCLO, SYTL2, SLC17A7, SYT13, SYT16, SYT12, CADPS2, SNAP47
192 50 5.4 3.37e-18 Up
Regulation of postsynaptic membrane potential
DLG4, PTK2B, FGF14, GABRB3, GRIK5, GRIN2A, GRIN2B, MEF2C, PPP3CA, SNCA, STX1A, DGKI, NRXN1, RIMS2, RAB3GAP1, RIMS1, MAPK8IP2, SHANK1, CELF4, SLC17A7, NETO1, SHANK3
59 22 8.92 3.58e-12 Up
Regulation of synaptic plasticity ATP2B2, CAMK2A, CAMK2B, DLG4, DRD1, PTK2B, FGF14, GRIA1, GRIN2A, GRIN2B, GRM5, HRH2, ITPKA, KCNB1, MEF2C, NEUROD2, NRGN, PAK1, PPP3CB, PTGS2, PTN, SNCA, STAR, STXBP1, NR2E1, PPFIA3, SYNGAP1, SYNGR1, NEURL1, DGKI, RAPGEF2, BAIAP2, PLK2, CPEB3, RAB3GAP1, RIMS1, UNC13A, NSMF, NPTN, JPH3, NETO1, JPH4, SHANK3, SNAP47, CNTN4, LRRTM1
132 46 8.2 1.48e-22 Up
Regulatory region nucleic acid
binding ARNTL, ETV1, H2AFZ, HIVEP2, MEF2C, NEUROD2, PLAGL1, RARA, SATB1, SNCA, SOX5, STAT4, TBX15, LMO4, ZBTB33, BASP1, TBR1, KLF12, DDN, BCL11A, FEZF2, ARNTL2, PKNOX2, DMRTC1, NEUROD6, BCL11B, ZNF831, ZNF519, ARX, ZNF675, STOX1, SOHLH1, DMRTC1B
790 33 0.643 0.00634 Down
Release of cytochrome c from mitochondria
CCK, IFI6, HGF, IGF1, PARK2, MAPK9, HRK, DNM1L, MLLT11, GGCT
55 10 3.29 0.00222 Up
SNARE binding CACNA1A, STX1A, STXBP1, SYT1, SYT5, DOC2A, NAPG, SYT7,
STXBP5L, CPLX1, UNC13A, SYTL2, SYT13, NAPB, SYT16, SYT12, SNAP47, STXBP5
112 18 2.91 0.000188 Up
Sodium channel activity SHROOM2, SCN1A, SCN1B, SCN2A, SCN2B, SCN8A, SCN3B, HCN1 36 8 4.32 0.00141 Up
Synapse ADD2, ATP1A1, ATP2B1, ATP2B2, BMPR2, CACNA1C, CACNB4,
CAMK2A, CAMK2B, CAMK2D, CCK, CHRM1, CHRM3, AP1S1, CTNNA2, DLG3, DLG4, DRD1, DMTN, EPHA4, EPHA7, PTK2B, GABRA1, GABRA2, GABRA3, GABRA4, GABRA5, GABRB2, GABRB3, GABRD, GABRG3, GAP43, GLRB, GRIA1, GRIA2, GRIA3, GRIK5, GRIN2A, GRIN2B, GRM1, GRM5, GRM8, ICA1, ITPKA, ITPR1, KCNB1, KCNC2, KCNH1, KCNJ4, KCNMA1, MAP2, MYH10, NPY1R, NRCAM, NRGN, OPRK1, PAK1, PDE2A, PFN2, PRKAR2B, PRKCG, PTPRN2, CCL2, SLC8A1, SNCB, SNCA, STX1A, STXBP1, SYN1, SYN2, SYT1, SYT5, SLC30A3, FZD3, GLRA3, DOC2A, PRSS12, PPFIA4, PPFIA2, KCNAB2, ITGA8, PPFIA3, CADPS, LIN7A, CDK5R1, BSN, WASF1, SYT7, SYNGR1, NEURL1, DGKI, DLGAP2, DLGAP1, NRXN1, HOMER1, CABP1, AKAP5, GABBR2, RAPGEF2, RIMS2, ARHGAP32, FRMPD4, LZTS3, RIMS3, SV2B, DNM1L, OLFM1, BAIAP2, SLC9A6, CAP2, ARFGEF2, CPLX1, LZTS1, AAK1, CPEB3, ADGRL1, CNKSR2, CLSTN1, RIMS1, PDZRN3, UNC13A, NMNAT2, DDN, DMXL2, SYNE1, NCS1, MAPK8IP2, FRRS1L, MYRIP, NSMF, ERC2, CYFIP2, NPTN, PCLO, PACSIN1, SHANK1, NRN1, SVOP, SEPT11, SEPT3, ANKS1B, SLC17A7, TENM2, TBC1D24, LRFN2, KCTD16, LRRC7, DLGAP3, CACNG8, CLSTN2, LRRTM4, NETO1, PPP1R9B, SHANK3, SYT12, CADPS2, PRRT2, GRIN3A, OLFM3, TPRG1L, SYNPR, STXBP5, CBLN4, GRASP, SCAMP5, PHACTR1, CNIH2, LRRTM1, LRRTM3, VWC2, SLC6A17, IQSEC3, UNC13C
658 173 6.11 1.15e-62 Up
Synapse maturation CAMK2B, NEUROD2, NEURL1, NRXN1, ADGRL1, SHANK1 18 6 7.39 0.000626 Up
Synaptic transmission ADCY1, ATP2B2, CA7, CACNA1A, CACNA1B, CACNA1C, CACNB1, CACNB2, CACNB4, CAMK4, CAMK2A, CAMK2B, CAMK2D, CHRM1, CHRM3, DLG3, DLG4, DRD1, EGR3, PTK2B, FGF14, GABRA1, GABRA2, GABRA3, GABRA4, GABRA5, GABRB2, GABRB3, GABRD, GABRG3, GAD1, GLRB, GLS, GNAI3, GRIA1, GRIA2, GRIA3, GRIK5, GRIN2A, GRIN2B, GRM1, GRM5, GRM8, HRH2, HTR1B, HTR1E, HTR1F, HTR2A, ITPKA, KCNB1, KCNC1, KCNC2, KCND3, KCNF1, KCNH1, KCNJ3, KCNJ4, KCNJ6, KCNJ9, KCNK2, KCNMA1, KCNN1, KCNQ2, KCNQ3, KCNS1, KCNS2, KIF5A, MEF2C, MYO5A,
NEUROD2, NPY5R, OPRK1, OPRM1, PAK1, PARK2, PFN2, PPP3CA, PPP3CB, PRKCB, PRKCE, PRKCG, PTGS2, PTN, RIT2, SCN1B, SCN2B, CCL2, SLC1A1, SLC1A2, SNCB, SNCA, SSTR2, SSTR4, STAR,
RT-qPCR validation
Sixty-six genes from different pathways were selected for validation by RT-qPCR.
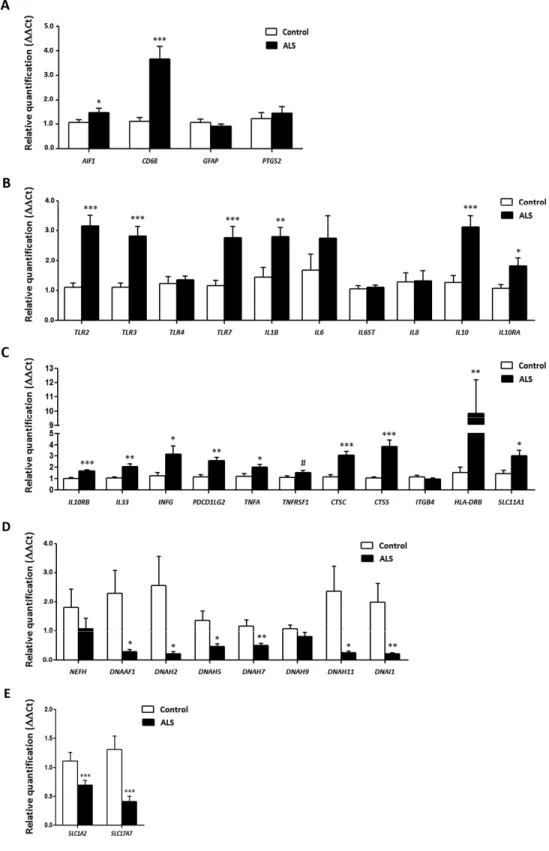
Inflammatory gene expression in the anterior horn of the spinal cord
No modifications in the expression levels of glial fibrillary acidic protein gene (GFAP) or prostaglandin-endoperoxide synthase 2 gene (PTGS2) occurred in ALS when compared with controls (p=0.31 and p=0.55, respectively). However, expression levels of AIF1 and CD68 were significantly increased in the anterior horn of the spinal cord in ALS (p=0.044 and p=0.00023, respectively). Gene expression of toll-like receptors (TLRs) TLR2, TLR and TLR7 was significantly increased in the spinal cord in ALS cases (p=2.48E-05, p=0.00011 and p=0.00074, respectively), but TLR4 was
not (p=0.669). IL1B was up-regulated (p=0.005), but IL6 and IL6ST were not (p=0.26 and p=0.76, respectively). In contrast, the expression of IL10 and its corresponding receptors IL10RA and IL10RB was increased in ALS (p=0.00046, p=0.022 and p=3.23E-05, respectively). TNFA expression was significantly increased whereas a trend was found for TNFRSF1B (p=0.04 and p=0.08, respectively). The expression of CTSC and CTSS was significantly increased in spinal cord in ALS (p=5.82204E-05 and p=0.00014, respectively). Levels of SLC11A1 were also significantly increased in spinal cord of ALS (p=0.014). HLA-DRB1, a protein coding gene for the Major Histocompatibility Complex Class II (MHC-II) DR β1 protein was markedly up-regulated in ALS (p=0.004365). PDCD1LG2, IFNγ and IL33 were significantly up-regulated in the anterior horn of the spinal cord in ALS (p=0.00153, p=0.03 and p=0.0032, respectively).
Ratio lation
STX1A, STXBP1, SYN1, SYN2, SYT1, SYT5, NR2E1, VIPR1, KCNAB1, GLRA3, DOC2A, PPFIA4, PPFIA2, KCNAB2, PPFIA3, CADPS, LIN7A, SYNGAP1, SYNJ1, BSN, SYT7, SYNGR1, NEURL1, DGKI, KCNAB3, DLGAP2, DLGAP1, BZRAP1, NRXN1, HOMER1, AKAP5, GABBR2, RAPGEF2, RIMS2, RIMS3, SNAP91, CACNG3, BAIAP2, CSPG5, PLK2, CPLX1, HRH3, CPEB3, ADGRL1, CLSTN1, RAB3GAP1, RIMS1, UNC13A, PLCB1, KCNH4, KCNH3, MAPK8IP2, RASD2, NSMF, SLITRK5, KCNV1, NPTN, KCNH5, PCLO, TMOD2, KCNIP2, SHANK1, SHC3, SYTL2, PCDHB13, KCNQ5, CELF4, SLC17A7, JPH3, SYT13, CACNG8, CLSTN2, NETO1, SYT16, CAMKK1, JPH4, PPP1R9B, SHANK3, KCNH7, SYT12, CADPS2, BTBD9, GRIN3A, SNAP47, CNTN4, KCNG3, CNIH2, LRRTM1, HCN1, UNC13C
Synaptic transmission, glutamatergic
CACNA1A, CACNB4, DRD1, PTK2B, GRIA1, GRIA2, GRIA3, GRIK5, GRIN2A, GRM1, GRM5, GRM8, HTR1B, HTR2A, MEF2C, PAK1, PARK2, PTGS2, SYT1, DGKI, NRXN1, RAB3GAP1, UNC13A, MAPK8IP2, SHC3, SLC17A7, SHANK3, GRIN3A, CNIH2
78 29 8.94 1.42e-15 Up
Synaptic vesicle exocytosis GRIK5, PFN2, STX1A, STXBP1, SYN1, SYT1, SYT5, DOC2A, CADPS, SYNJ1, SYT7, RIMS3, CPLX1, ADGRL1, RIMS1, UNC13A, PCLO, SYTL2, SYT13, SYT16, SYT12, CADPS2, SNAP47
76 23 6.51 1.59e-10 Up
Synaptic vesicle localization FGF14, GRIK5, PARK2, PFN2, SH3GL2, SNCA, STX1A, STXBP1, SYN1, SYT1, SYT5, AP3B2, DOC2A, CADPS, LIN7A, SYNJ1, SYT7, NRXN1, RIMS3, CPLX1, ADGRL1, RIMS1, UNC13A, PCLO, PACSIN1, SYTL2, SYT13, SYT16, SYT12, CADPS2, BTBD9, SNAP47
120 32 5.49 1.97e-12 Up
Synaptic vesicle membrane ICA1, STX1A, SYN1, SYN2, SYT1, SYT5, SLC30A3, DOC2A, SYT7, SYNGR1, SV2B, DNM1L, DMXL2, SVOP, SLC17A7, SYT12, SYNPR, SCAMP5, SLC6A17
55 19 7.94 4.52e-10 Up
Synaptic vesicle priming STX1A, STXBP1, CADPS, SYNJ1, CADPS2, SNAP47 12 6 14.8 4.34e-05 Up
Synaptic vesicle recycling FGF14, SH3GL2, SNCA, SYT1, SYT5, SYNJ1, PACSIN1, BTBD9 29 8 5.64 0.000338 Up
Synaptic vesicle transport FGF14, GRIK5, PARK2, PFN2, SH3GL2, SNCA, STX1A, STXBP1, SYN1, SYT1, SYT5, AP3B2, DOC2A, CADPS, LIN7A, SYNJ1, SYT7, RIMS3, CPLX1, ADGRL1, RIMS1, UNC13A, PCLO, PACSIN1, SYTL2, SYT13, SYT16, SYT12, CADPS2, BTBD9, SNAP47
116 31 5.51 4.11e-12 Up
Syntaxin binding CACNA1A, STXBP1, SYT1, SYT5, DOC2A, NAPG, SYT7, STXBP5L, CPLX1, UNC13A, SYTL2, SYT13, NAPB, SYT16, SYT12, SNAP47, STXBP5
78 17 4.24 4.82e-06 Up
Terminal bouton CCK, AP1S1, GRIK5, GRIN2A, KCNC2, KCNMA1, PFN2, PTPRN2,
SNCA, STXBP1, SYN1, PRSS12, SYT7, SYNGR1, CPLX1, AAK1, TBC1D24
Finally, IL8 (interleukin 8) and ITGB4 (integrin subunit beta 4) expression was similar in control and ALS cases (p=0.92 and p=0.40, respectively) (Figure 3).
Axonemal gene expression in anterior horn of the spinal cord
No modifications in the expression levels of NEFH, which codes for neurofilament heavy polypeptide protein, was seen in ALS when compared with controls (p=0.30). However, DNAAF1 levels were significantly reduced (p=0.019). Expression of DNAH2, DNAH5, DNAH7 and DNAH11 mRNA was significantly reduced in ALS (p=0.029, p=0.012, p=0.005 and p=0.023, respectively), whereas DNAH9 mRNA was not altered (p=0.14). DNAI1 mRNA expression was also significantly reduced in ALS (p=0.0086) (Figure 3).
SLC1A2 and SC17A7 expression in anterior horn of the spinal cord
SLC1A2 and SLC17A7 expression levels were significantly decreased in the anterior horn of the spinal cord in ALS anterior (p=0.000115 and p=0.000125, respectively). See Figure 3.
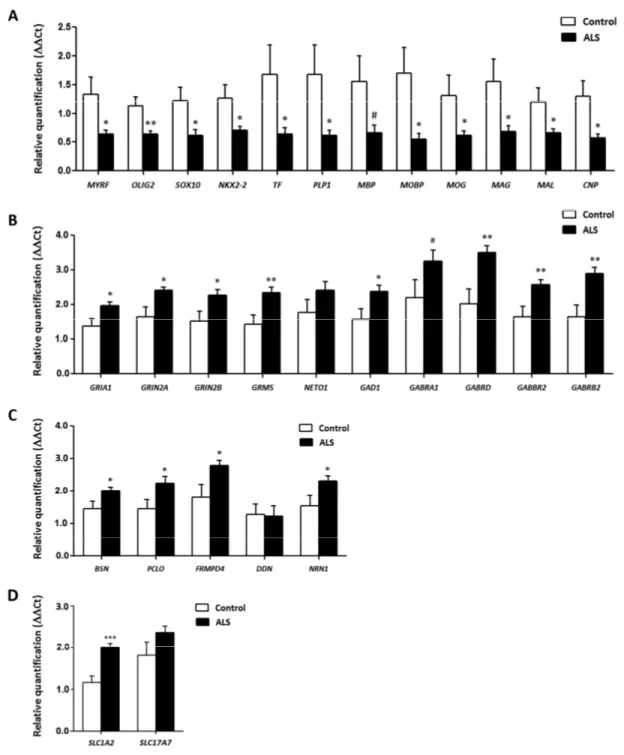
Neurotransmission-related gene expression in frontal cortex area 8
GRIA1, which codes for the ionotropic glutamate receptor AMPA 1, and GRIN2A and GRIN2B, coding for NMDA receptors, were significantly up-regulated (p=0.018, p=0.018 and p=0.029, respectively) in frontal cortex in ALS cases. GRM5, which codes for the glutamate metabotropic receptor 5, was also up-regulated (p=0.0079). However, no significant alteration was seen in the expression of NETO1 (p=0.165).
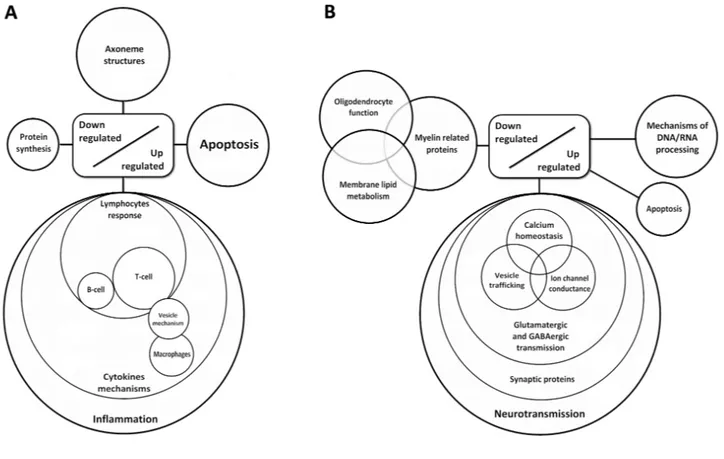
Figure 2. Diagram showing de‐regulated gene clusters in the anterior horn of the spinal cord (A) and frontal cortex area 8 in ALS (B) as revealed by whole transcriptome arrays.
Figure 3. mRNA expression levels of selected deregulated genes identified by microarray analysis in the anterior horn of the spinal cord in ALS determined by TaqMan RT‐qPCR assays. (A) general glial markers; (B‐C) mediators of the inflammatory response; and (D) axolemal components. Up of AIGF1 and CD68, toll‐like receptors, cytokines and receptors, chemokines and other mediators of the innate and adaptative inflammatory responses. Axolemal genes, excepting NEFH, which shows a non‐significant trend to decrease, are significantly down‐regulated. (E) glutamate transporter coding genes. The significance level is set at * p < 0.05, ** p < 0.01 and *** p < 0.001.
Regarding the GABAergic system, GAD1 was up-regulated in ALS (p=0.034). Gene expression of GABA receptors GABRA1, GABRD, GABRB2 was increased (p=0.09, tendency, p=0.006 and p=0.0029, respectively). GABBR2 mRNA levels were also significantly elevated in the frontal cortex in ALS (p=0.01) (Figure 4).
Synaptic cleft gene expression in frontal cortex area 8
BSN, which codes for Bassoon, a pre-synaptic cytoskeletal matrix, was up-regulated in ALS (p=0.04). mRNA levels of PCLO, coding gene for Piccolo protein, and FRMPD4 were also increased in ALS (p=0.036 and p=0.029, respectively), Finally, NRN1, which codes for
Figure 4. mRNA expression levels of selected deregulated genes identified by microarray analysis in frontal cortex area 8 of ALS cases determined by TaqMan RT‐qPCR assays. (A) oligodendroglial and myelin‐related genes; (B) glutamatergic and GABAergic‐ related genes and corresponding ionotropic and metabotropic receptors; (C) genes coding for synaptic cleft proteins. Significant up of genes linked to neurotransmission and synapses, and significant down of genes linked to oligodendroglia and myelination. (D) Glutamate transporter coding genes. The significance level is set at * p < 0.05, ** p < 0.01 and *** p < 0.001, and tendencies at # < 0.1.
was up-regulated in the frontal cortex in ALS (p=0.04 and p=0.92, respectively) (Figure 4).
Myelin- and oligodendrocyte-related gene expression in frontal cortex area 8
Significant decrease in mRNA expression of myelin transcription factor (MYRF) (p= 0.028), OLIG2 (p = 0.009), SOX10 (p = 0.02), NKX2-2 (p = 0.032),
(p=0.040), myelin basic protein (MBP) (p=0.061), myelin-associated oligodendrocyte basic protein (MOBP) (p=0.019), oligodendrocyte glycoprotein (MOG) (p=0.05), Mal T-cell differentiation protein (MAL) (p=0.039), myelin associated glycoprotein (MAG) (p=0.035), and 2',3'-cyclic nucleotide 3' phosphodiesterase (CNP1) (p=0.017) was seen in frontal cortex in ALS cases compared with controls (Figure 4).
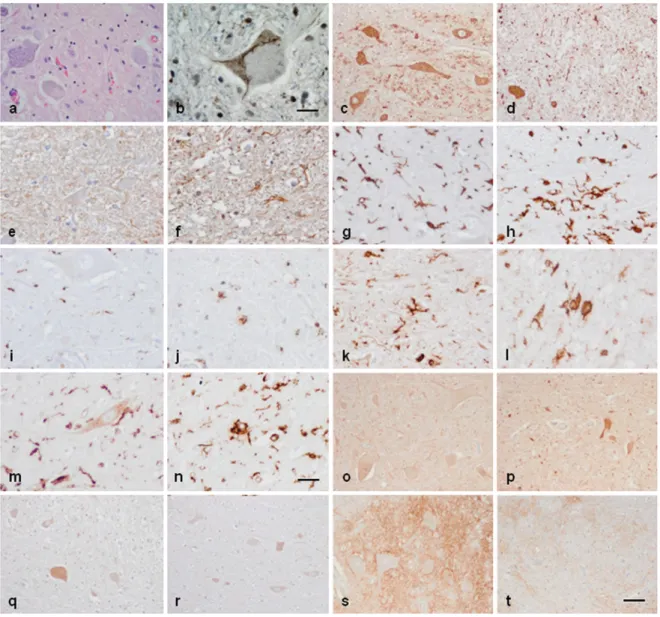
Figure 5. Anterior horn of the spinal cord. Haematoxilin and eosin staining showing damaged neurons in ALS (a). Immuno‐ histochemistry to TDP‐43 showing skein‐like intracytoplasmic inclusions (b), VDAC (c, d), GFAP (e, f), IBA‐1 (g, h), CD68 (i, j), HLA‐ DRB1 (k, l), HLA‐DRB5 (m, n), IL‐10 (o, p), TNF‐α (q, r) and GluT (SLC1A2) (s, t) in the anterior horn of the lumbar spinal cord in control (c, e, g, I, k, m, o, q, s) and sALS (a, b, d, f, h, j, l, n, p, r, t) cases. TDP‐43‐immunoreactive cytoplasmic inclusions are seen in motor neurons in sALS. GFAP is increased in reactive astrocytes; microglial cells have a round, amoeboid morphology as seen with IBA‐1, CD‐ 68, HLA‐DRB1, and HLA‐DRB5 antibodies. VDAC immunoreactivity is decreased whereas IL‐10 and TNF‐α is increased in remaining motor neurons in sALS. SLC1A2 immunoreactivity is reduced in the membrane of neurons and in neuropil of the anterior horn in sALS. Paraffin sections, slightly counterstained with haematoxylin; a, c‐d, o‐t, bar in t = 40μm; e‐n, bar in = 20μm; bar in b = 10μm.
SLC1A2 and SLC17A7 expression in frontal cortex area 8
SLC1A2 expression was significantly increased (p=5.25e-5) whereas SLC17A7 mRNA showed a non-significant increase (p=0.42) in frontal cortex area 8 in ALS (Figure 4).
Immunohistochemistry in spinal cord
The anterior horn of the spinal cord in ALS cases showed decreased number of neurons and altered mor- phology of most remaining motor neurons including loss of endoplasmic reticulum (chromatolysis) and axonal ballooning (Figure 5a) and intracytoplasmic TDP-43-immunoreactive inclusions (Figure 5b). Immunohistochemistry was carried out in the lumbar spinal cord in control and sALS cases (Figure 5a and b). VDAC was reduced in a subpopulation of neurons in the anterior horn in ALS, but not in neurons of the Clarke’s column and posterior horn, when compared with controls (Figure 5c and d). Increased expression of GFAP was found in reactive astrocytes in the lateral columns and anterior horn of the spinal cord in ALS cases (Figure 5e and f). Marked differences were seen
regarding microglial cell markers: IBA-1 and CD68 immunoreactivity was dramatically increased in the pyramidal tracts and anterior horn in ALS; moreover the morphology of microglia was modified in pathological cases with predominance of round, amoeboid microglia (Figure 5g-j). Similar immunoreactivity, distribution and morphology were found in reactive microglia using antibodies against HLA-DRB1 and HLA-DRB5 (Figure 5k-n). In contrast IL-10 and TNF-α immunoreactivity predominated in neurons; immunoreactivity was increased in neurons in ALS cases compared with controls (Figure 5o-r). Finally, GluT (SLC1A2), the transporter of glutamate from the extracellular space at synapses, was expressed in the membrane of neurons and in the neuropil; SLC1A2 immunoreactivity was decreased in neurons and neuropil of the anterior horn in ALS (Figure 5s, t).
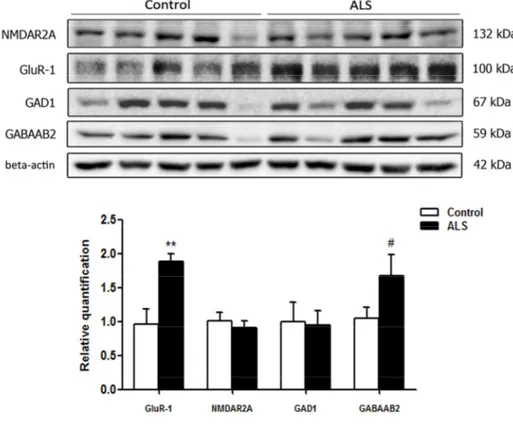
Gel electrophoresis and western blotting in frontal cortex area 8
A few tested antibodies were eventually suitable for western blotting studies. No differences in the expression levels of glutamate receptor ionotropic, NMDA 2A (NMDAR2A) and glutamate decarboxylase
Figure 6. Gel electrophoresis and western blotting to glutamate receptor ionotropic, NMDA 2A (NMDAR2A), α‐ amino‐3‐hydroxy‐5‐methyl‐4‐isoxazolepropionic acid receptor 1 (GluR‐1), glutamate decarboxylase 1 (GAD1) and gamma‐aminobutyric acid receptor subunit beta‐2 (GABAAB2) in the frontal cortex area 8 of control and ALS. Significant increased levels of GluR‐1 and a tendency to increased levels of GABAAB2 are seen in ALS when compared with controls. The significance level is set at ** p < 0.01 and tendencies at # < 0.1.
cases. However, a significant increase in α-amino-3-hydroxy-5-methyl-4-isoxazolepropionic acid receptor 1 (AMPAR GluR-1) ** p < 0.01 and a tendency to increase in the expression of gamma-aminobutyric acid receptor subunit beta-2 (GABAAB2) (# p < 0.1) was found in the frontal cortex in ALS when compared to controls (Figure 6).
DISCUSSION
Transcriptomic profiles in ALS are region-dependent when comparing the anterior horn of the lumbar spinal cord and frontal cortex area 8 in the same individuals. As an important regional difference related to excitotoxicity, the expression of glutamate transporters is markedly different in the anterior horn of the spinal cord and the frontal cortex area 8. SLC1A2 and SLC17A7 mRNA expression is significantly decreased in the anterior horn of the spinal cord, whereas SLC1A2 is significantly increased in frontal cortex area 8. SLC1A2 encodes the solute carrier family 1 member 2 or excitatory amino-acid transporter 2 (EAAT2) which clears glutamate from the extracellular space at synapses in the central nervous system. Immunohistochemistry has shown decreased SLC1A2 protein expression in the membrane of neurons and neuropil of the anterior horn in ALS. SLC17A7 encodes the vesicular glutamate transporter 1 (VGLUT1) which is a vesicle-bound, sodium-dependent phosphate glutamate transporter expressed in the synaptic vesicles. Decreased expression of these proteins is linked to increased excitotoxity which is postulated as primary factor triggering motor neuron degeneration in ALS [30, 31]. Whole transcriptome arrays show that major up-regulated clusters in the anterior horn are related with innate inflammatory and adaptative inflammatory responses. Genes involved in hemostasis and ion transport forms a small up-regulated group. The major group of down-regulated genes is linked to the neuronal cytoskeleton. The majority of significantly differentially up-regulated transcripts in sALS in frontal cortex area 8, as revealed by whole transcriptome arrays, code for proteins linked with neurotransmission, ion channels and ion transport, synapses, and axon and dendrite maintenance, whereas down-regulated genes code for proteins involved in oligodendrocyte development and function, myelin regulation and membrane lipid metabolism.
Altered gene expression as revealed by whole transcriptome arrays has been validated by RT-qPCR in 58 of 66 assessed genes. These observations increase the list of genes which are de-regulated in the anterior spinal cord and provide, for the first time, robust
in sALS. Increased inflammatory response in the anterior horn and increased expression of selected neurotransmitter markers in frontal cortex has been further assessed using immunohistochemistry and western blotting, respectively.
Inflammation in the anterior horn of the spinal cord
AIF1 gene codes for the Allograft Inflammatory Factor 1, a protein induced by cytokines and interferon which promotes macrophage and glial activation [32, 33]. CD68 codes for the macrophage antigen CD68 glycoprotein which is expressed by microglial cells [35-37], the principal resident immune cell population in brain [38, 39]. Microglia pro-inflammatory state activation can be initiated by engagement of germline-encoded pattern-recognition receptors such as Toll-like receptors (TLRs) which are expressed in glial cells [40]. TLR activation, in turn, activates phagocytosis [41-43] and pro-inflammatory responses [44]. Up-regulated interleukins in ALS are IL1B, the coding gene for interleukin 1B an important mediator of the inflam-matory response [45], interleukin 10 (encoded by IL10) which has pleiotropic effects down-regulating the expression of Th1 cytokines, MHC class II antigens and co-stimulating the production of several molecules by macrophages through the activation of IL10 receptor subunit α and subunit β (encoded by IL10RA and IL10RB, respectively) [46]. However, IL6 mRNA, which encodes a specific pro-inflammatory cytokine with regenerative and anti-inflammatory activities in particular settings [47-50] is not modified. Tumor Necrosis Factor Receptor Superfamily Member 1A (encoded by TNFA) is involved in the regulation of a wide spectrum of biological processes including cell proliferation, cell differentiation, apoptosis, lipid metabolism and coagulation [50, 51]. CTSC gene encodes Cathepsin C which is central coordinator of activation of many serine proteinases in immune cells [52]. CTSS codes for a protein of the same family, Cathepsin S, which acts as a key protease responsible for the removal of the invariant chain from MHC class II antigens [53]. SLC11A1 encodes natural resistance-associated macrophage protein 1, which acts as a host resistance to certain pathogens [54].
Major Histocompatibility Complex Class II (MHC-II) DR β1 protein, encoded by HLA-DRB-1, plays a central role in the immune system by presenting peptides derived from extracellular proteins [55, 56] and participate in the activation of autophagosomes [57]. PDCD1LG2 codes for Programmed Cell Death 1 Ligand 2, a protein involved in co-stimulatory signals essential for T-cell proliferation and IFN-γ production
[58]. IFNγ gene, which codes for the cytokine interferon-γ, is key player in antigen-specific immune responses [59]. Finally, interleukin 33, encoded by IL33, acts as a chemo-attractant for Th2 cells and functions as an ‘alarm’ that amplifies immune responses during tissue injury [60].
Increased inflammatory response in the anterior horn of the spinal cord has been further documented by immunohistochemistry showing increased expression of IBA-1, the protein encoded by AIF1, CD68, and HLA-DRB1 and HLA-DRB5 in reactive microglia. Reactive microglia has a round, amoeboid morphology and is also localized, as expected in the lateral and anterior pyramidal tracts. IL-10 and TNF-α are mainly localized in neurons of the spinal cord, and its expression is increased in remaining motor neurons of the spinal cord in ALS. These findings indicate a parallelism between gene expression and protein expression regarding inflammatory responses of assessed molecules. On the other hand the different localization of microglial markers, and IL-10 and TNF-α in neurons points to a cross-talk between microglia and neurons in the anterior horn of the spinal cord in ALS.
This is in contrast with other markers as glial fibrillary acidic protein and voltage dependent anion channel in which levels of mRNA differ from levels (or intensity) of protein expression. No modifications in the expression of GFAP mRNA are observed in the present study, but GFAP immunoreactivity is clearly increased in reactive astrocytes, as already reported in classical neuropathological studies. VDAC mRNA is not abnormally regulated in gene arrays; yet VDAC is decreased in motor neurons, but not in neurons of the Clarke’s column and neurons of the posterior horn, of the spinal cord in ALS. VDAC immunohistochemistry is in line with observations in human sALS showing deficiencies in mitochondria and energy metabolism [61, 62].
Reduced expression of axolemal genes in anterior horn of the spinal cord
The expression levels of NEFH, which codes for neurofilament heavy polypeptide protein [63], are preserved in ALS. However, DNAAF1, which encodes dynein (axonemal) assembly factor 1, and mRNAs encoding several dynein axonemal heavy chains (DHC) are down-regulated thus suggesting impairment of motor ATPases involved in the transport of various cellular cargoes by ‘walking’ along cytoskeletal microtubules towards the minus-end of the microtubule [64-66].
Up-regulation of neurotransmission-related genes and synaptic cleft genes in frontal cortex
Genes involved in glutamatergic and GABAergic transmission are up-regulated in the frontal cortex in ALS. This applies to genes encoding the ionotropic glutamate receptor AMPA 1 (GRIA1), glutamate ionotropic receptor NMDA type subunit 2A (GRIN2A), the glutamate ionotropic receptor NMDA type subunit 2B (GRIN2B), and glutamate metabotropic receptor 5 (GRM5). Regarding the GABAergic system, GAD1, coding for glutamate decarboxylase 1, a rate-limiting enzyme that acts in the decarboxylation of glutamate essential for the conversion reaction of GABA from glutamate [67, 68], is up-regulated, as are GABRA1, GABRD, GABRB2, which code for different subunits of ionotropic GABA-A receptors. GABBR2, which codes for the metabotropic receptor component Gamma-Aminobutyric Acid Type B Receptor Subunit 2 and forms heterodimers with GABBR1, thus resulting in the formation of the G-protein coupled receptor for GABA [69], is also up-regulated in ALS.
In line with increased expression of neurotransmitter-related genes, several genes encoding molecules linked with the synaptic cleft are also up-regulated in ALS. BSN codes for Bassoon, a pre-synaptic cytoskeletal matrix (PCM) protein acting as a scaffolding protein and essential for the regulation of neurotransmitter release in a subset of synapses [70, 71]. PCLO codes for Piccolo protein, a component of the PCM assembled in the active zone of neurotransmitter release [72, 73]. FRMPD4 codes for PSD-95-interacting regulator of spine morphogenesis protein which regulates dendritic spine morphogenesis and is required for the maintenance of excitatory synaptic transmission [74]. DDN and NRN1 code for dendrin protein and neuritin 1 protein, respectively which are involved in the remodeling of the postsynaptic cytoskeleton and neuritic outgrowth [75-77].
De-regulation of neurotransmitters and receptors is further supported by the demonstration of significant increase in the levels of GluR-1 and a tendency in those of GABAAB2 in the frontal cortex area 8 in ALS when compared with controls. It is worth stressing that only a few antibodies of the total assessed (eight) were suitable for western blotting.
Myelin and oligodendrocyte genes in frontal cortex area 8
Myelin transcription factor (encoded by MYRF) regulates oligodendrocyte differentiation and is required for central nervous system myelination [78-81]. The basic loop- helix protein OLIG2 mediates motor neuron
mobility group protein SOX10 modulates myelin protein transcription [83, 84]. NKX2.2 homeodomain transcription factor is a key regulator of oligodendrocyte differentiation [85]. Transferrin encoded by TF participates in the early stages of myelination [86, 87]. Proteolipid protein 1 (encoded by PLP1) plays a role in the compaction, stabilization, and maintenance of myelin sheaths, as well as in oligodendrocyte development and axonal survival [88, 89]. Myelin basic protein (encoded by MBP) is the second most abundant myelin-associated protein, constituting about 30% of total myelin protein [90]. Myelin-associated oligodendrocyte basic protein (encoded by MOBP) constitutes the third most abundant protein in CNS myelin and it acts by compacting and stabilizing myelin sheaths [91]. Myelin oligodendrocyte glycoprotein (encoded by MOG) is a cell surface marker of oligodendrocyte maturation [92]. Myelin associated glycoprotein (encoded by MAG) is a type I membrane protein and member of the immunoglobulin super-family involved in the process of myelination and certain myelin-neuron cell-cell interactions [93]. Mal T-cell differentiation protein (encoded by MAL) is involved in myelin biogenesis [94]. Finally, 2',3'-cyclic nucleotide 3' phosphodiesterase (encoded by CNP1) participates in early oligodendrocyte differentiation and myelination [95-97].
Concluding comments
Results of the present study validate gene expression of individual studies performed in a limited number of samples identifying a limited number of de-regulated genes in the anterior horn of the spinal cord [17, 20, 21, 25]. Present results are more close to those carried out by using laser micro-dissection of anterior horn spinal motor neurons [27] thus reinforcing the consistence of observations in both studies. Whether some changes are related to the variable progression of the disease need further study with a larger number of cases of rapid or slow clinical course. In this line, altered mitochondria, protein degradation and axonal transport predominate in the 129Sv-SOD1(G93A) transgenic mouse with rapidly progressive motor neuron disease, whereas increased immune response is found in the C57-SOD1(G93A) transgenic mouse with more benign course [98]. The most important aspect of the present study is the description of altered gene expression and identification of altered clusters of genes in the frontal cortex area 8 in sALS cases without apparent cognitive impairment. It is worth stressing that altered clusters differ in the spinal cord and frontal cortex in sALS at terminal stages thus providing valuable information of molecular ab-normalities which can also be present within the
of transcription related to synapses and neuro-transmission covering neurotransmitter receptors, synaptic proteins and ion channels in the frontal cortex in the absence of overt clinical symptoms of cognitive impairment are particularly important to identify early molecular alterations in frontal cortex with the spectrum of ALS/FTLD-TDP.
MATERIALS AND METHODS
Tissue collectionPost-mortem fresh-frozen lumbar spinal cord (SC) and frontal cortex (FC) (Brodmann area 8) tissue samples were from the Institute of Neuropathology HUB-ICO-IDIBELL Biobank following the guidelines of Spanish legislation on this matter and the approval of the local ethics committee. The post-mortem interval between death and tissue processing was between 2 and 17 hours. One hemisphere was immediately cut in coronal sections, 1-cm thick, and selected areas of the encephalon were rapidly dissected, frozen on metal plates over dry ice, placed in individual air-tight plastic bags, numbered with waterresistant ink and stored at -80°C until use for biochemical studies. The other hemisphere was fixed by immersion in 4% buffered formalin for 3 weeks for morphologic studies. Transversal sections of the spinal cord were alternatively frozen at -80°C or fixed by immersion in 4% buffered formalin. The whole series included 18 sALS cases and 23 controls. The anterior horn of the spinal cord was examined in 14 sALS (mean age 57 years; 6 men and 8 women) and the frontal cortex area 8 in 15 sALS (mean age 54 years; 11 men and 4 women). Spinal cord and frontal cortex were available in 11 cases. Lumbar anterior spinal cord was dissected on a dry-ice frozen plate under a binocular microscope at a magnification x4. TDP-43-immunoreactive small dystrophic neurites and/or TDP-43-positive granules and/or small cytoplasmic globules in cortical neurons in the contralateral frontal cortex area 8 were observed in 11 of 18 cases, but only abundant in three cases (cases 29, 30 and 31 in Table 3). Spongiosis in the upper cortical layers was found only in one case (case 28 in Table 3). Cases with frontotemporal dementia were not included in the present series. Patients with associated pathology including Alzheimer’s disease (excepting neurofibrillary tangle pathology stages I-II of Braak and Braak), Parkinson's disease, tauopathies, vascular diseases, neoplastic diseases affecting the nervous system, metabolic syndrome, hypoxia and prolonged axonal states such as those occurring in intensive care units were excluded. Cases with infectious, inflammatory and autoimmune diseases, either systemic or limited to the nervous system were not included.
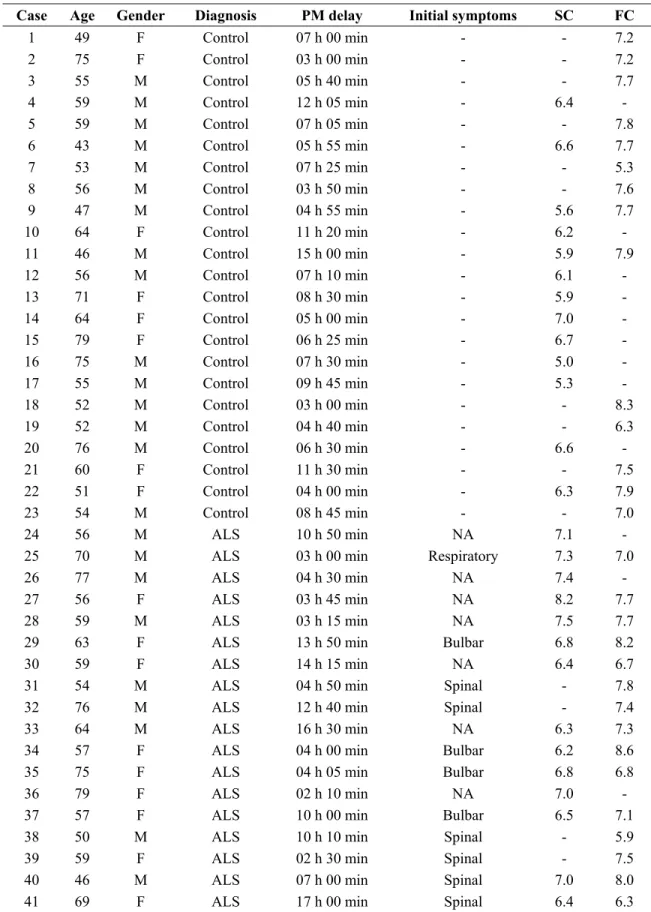
Table 3. Summary of the fifty six cases analyzed including frontal cortex area 8 of 14 controls and 15 ALS cases, and anterior horn of the spinal cord of 13 controls and 14 ALS cases.
RIN value
Case Age Gender Diagnosis PM delay Initial symptoms SC FC
1 49 F Control 07 h 00 min - - 7.2 2 75 F Control 03 h 00 min - - 7.2 3 55 M Control 05 h 40 min - - 7.7 4 59 M Control 12 h 05 min - 6.4 - 5 59 M Control 07 h 05 min - - 7.8 6 43 M Control 05 h 55 min - 6.6 7.7 7 53 M Control 07 h 25 min - - 5.3 8 56 M Control 03 h 50 min - - 7.6 9 47 M Control 04 h 55 min - 5.6 7.7 10 64 F Control 11 h 20 min - 6.2 - 11 46 M Control 15 h 00 min - 5.9 7.9 12 56 M Control 07 h 10 min - 6.1 - 13 71 F Control 08 h 30 min - 5.9 - 14 64 F Control 05 h 00 min - 7.0 - 15 79 F Control 06 h 25 min - 6.7 - 16 75 M Control 07 h 30 min - 5.0 - 17 55 M Control 09 h 45 min - 5.3 - 18 52 M Control 03 h 00 min - - 8.3 19 52 M Control 04 h 40 min - - 6.3 20 76 M Control 06 h 30 min - 6.6 - 21 60 F Control 11 h 30 min - - 7.5 22 51 F Control 04 h 00 min - 6.3 7.9 23 54 M Control 08 h 45 min - - 7.0 24 56 M ALS 10 h 50 min NA 7.1 -
25 70 M ALS 03 h 00 min Respiratory 7.3 7.0
26 77 M ALS 04 h 30 min NA 7.4 -
27 56 F ALS 03 h 45 min NA 8.2 7.7
28 59 M ALS 03 h 15 min NA 7.5 7.7
29 63 F ALS 13 h 50 min Bulbar 6.8 8.2
30 59 F ALS 14 h 15 min NA 6.4 6.7
31 54 M ALS 04 h 50 min Spinal - 7.8
32 76 M ALS 12 h 40 min Spinal - 7.4
33 64 M ALS 16 h 30 min NA 6.3 7.3
34 57 F ALS 04 h 00 min Bulbar 6.2 8.6
35 75 F ALS 04 h 05 min Bulbar 6.8 6.8
36 79 F ALS 02 h 10 min NA 7.0 -
37 57 F ALS 10 h 00 min Bulbar 6.5 7.1
38 50 M ALS 10 h 10 min Spinal - 5.9
39 59 F ALS 02 h 30 min Spinal - 7.5
40 46 M ALS 07 h 00 min Spinal 7.0 8.0
41 69 F ALS 17 h 00 min Spinal 6.4 6.3
Abbreviations: ALS: amyotrophic lateral sclerosis; F: female; M: male; PM: post‐mortem delay (hours, minutes); SC: anterior horn of the spinal cord lumbar level; FC: frontal cortex area 8; RIN: RNA integrity