Josep M. Auge*, Cristina Rodriguez, Oihana Espanyol, Liseth Rivero, Silvia Sandalinas, Jaume
Grau, Wladimiro Jimenez and Antoni Castells
An evaluation of the SENTiFIT 270 analyser for quantitation
of faecal haemoglobin in the investigation of patients with
suspected colorectal cancer
https://doi.org/10.1515/cclm-2017-0605
Received July 11, 2017; accepted October 9, 2017; previously published online November 18, 2017
Abstract
Background: An evaluation of SENTiFIT
®270 (Sentinel
Diagnostics, Italy; Sysmex, Spain) analyser for the
quanti-tation of faecal haemoglobin (f-Hb) was performed.
Methods: The analytical imprecision, linearity, carry over
and f-Hb stability were determined. Evaluation of the
diagnostic accuracy was performed on 487 patients.
Results: Within-run and between-run imprecision ranged
1.7%–5.1% and 3.8%–6.2%, respectively. Linearity studies
revealed a mean recovery of 101.1% (standard deviation,
6.7%) for all dilutions. No carry over was detected below
7650 μg Hb/g faeces. Decay of f-Hb in refrigerated samples
ranged 0.2%–0.5% per day. f-Hb in patients with advanced
colorectal neoplasia (ACRN) (colorectal cancer [CRC] plus
advanced adenoma [AA]) were significantly higher than
from those with a normal colonoscopy. Sensitivity for
ACRN at f-Hb cutoffs from 10 to 60 μg Hb/g faeces ranged
from 28.9% (95% confidence interval [CI], 21.7%–37.2%) to
46.5% (95% CI, 38.1%–55%), the specificity ranged from
85% (95% CI, 82.3%–87.3%) to 93.2% (95% CI, 91.2%–
94.8%), positive predictive values for detecting CRC and
AA ranged from 11.6% (95% CI, 7.6%–17.2%) to 20.6% (95%
CI, 13.3%–30.3%) and from 34.7% (95% CI, 28.1%–42%) to
42.3% (95% CI, 32.4%–52.7%), respectively, and the
nega-tive predicnega-tive value for ACRN ranged from 90.2% (95%
CI, 87.9%–92.2%) to 88.4% (95% CI, 86%–90.4%). Using
two samples per patient sensitivity increased with a slight
decrease in specificity.
Conclusions: The analytical and clinical performances of
SENTiFIT assay demonstrate a specific and accurate test
for detecting ACRN in symptomatic patients and those
undergoing surveillance.
Keywords: adenoma; analyser evaluation; colorectal
cancer; faecal haemoglobin; faecal immunochemical test.
Introduction
The faecal immunochemical test (FIT) for faecal
haemo-globin (f-Hb) has been widely adopted in screening
pro-grammes [1–4], and its usefulness for assessing patients
with lower gastrointestinal symptoms has begun to be
explored [5–11].
The FIT allows for quantitative measurement of f-Hb
concentration, which makes it possible to select the
optimal cutoff [2, 12–16] for each situation. Quantitative
FIT generally uses automated analysis to determine f-Hb
concentration, which allows high-throughput testing,
improves reproducibility, and removes bias in the
inter-pretation of the results [17].
In the last few years, the number of analysers,
rea-gents and specimen collection devices available on the
market has increased. Currently, several FIT
manufac-turers offer analytical systems that differ in terms of, for
instance, the volume of haemoglobin-stabilising buffer
in the specimen collection devices and the sample mass
used for the test [18]. Initiatives to standardise methods
and reporting units have been undertaken [19–22].
Nev-ertheless, each brand of FIT performs differently [23]. For
this reason, it is advisable to evaluate the features of FIT
reagents, analysers and specimen collection devices prior
to use.
The main aim of this study was to assess the
analyti-cal and diagnostic capabilities of SENTiFIT
®270 using
SENTiFIT
®–FOB Gold
®latex reagent and SENTiFIT
®pierceTube (Sentinel Diagnostics, Italy; Sysmex, Spain).
As a secondary aim, we studied the diagnostic yield for
advanced colorectal neoplasia (ACRN) of f-Hb
concentra-tion using the first result of two samples vs. the mean and
the higher concentration of two samples.
*Corresponding author: Josep M. Auge, Biochemistry and Molecular
Genetics Department, Biomedical Diagnostic Center, Hospital Clinic, C/Villarroel 170, 08036 Barcelona, Spain, E-mail: [email protected]
Cristina Rodriguez, Liseth Rivero and Antoni Castells:
Gastroenterology Department, Hospital Clinic, University of Barcelona, Barcelona, Spain; and IDIBAPS, CIBERehd, Barcelona, Spain
Oihana Espanyol, Silvia Sandalinas and Wladimiro Jimenez:
Biochemistry and Molecular Genetics Department, Biomedical Diagnostic Center, Hospital Clinic, Barcelona, Spain
Jaume Grau: Unit of Evaluation, Support and Prevention, Hospital
Materials and methods
Patients
The study analysed 487 consecutive patients (48.8% males) whose average age was 62 years (range: 22–94 years), who attended the Hospital Clinic of Barcelona from June to October 2015 for colonos-copy to assess lower gastrointestinal symptoms (264 patients) or for surveillance of colonic polyps (223 patients).
Patients were asked to begin collecting faecal samples for the FIT 5 days before their colonoscopy to ensure that two samples were collected before bowel preparation commenced. No dietary restric-tions were imposed. Medication such as aspirin and non-steroidal anti-inflammatory drugs was discontinued 1 week before prepara-tion for colonoscopy. The study was approved by the Hospital Clinic’s Ethics Committee (HCB/2015/0388), and all patients provided writ-ten informed consent. All participants received an explanation of the tests and written instructions for the FIT either face to face or over the telephone. Patients were asked to prepare faecal samples from two consecutive bowel motions using the collection kit provided by the manufacturer.
Samples
Three sample sources were used: (1) samples collected by the patients, (2) stabilising buffer spiked with human capillary blood and (3) control material provided by the manufacturer. To collect a sample, the patient unscrews the green cap with the attached sam-ple collection stick and inserts it in four different spots in the faeces, scratching the surface cross-wise. The grooves of the stick must be fully covered in faeces. Then, the patient replaces the stick into the specimen collection device and screws it shut. The collection device is designed to collect 10 mg of freshly passed faeces with a serrated stick in a standard volume of haemoglobin-stabilising buffer (1.7 mL). Samples were stored in double-zipper bags at 4 °C until analysis was performed (within a maximum of 5 days).
Analyser
SENTiFIT® 270 was used for quantitation of the f-Hb (Sentinel Diag-nostics, distributed in Spain by Sysmex España, S.L.U.). This is a desk-top instrument based on immunoturbidimetry that can perform up to 270 tests per hour. It includes SENTiFIT® FOB Gold® latex reagent, FOB Gold® Screen Diluent, washing and fluid-disposal bottles, and it requires access to a standard power supply. Forty faecal samples pre-pared by patients using the SENTiFIT® pierceTube were loaded into the sample carousel. The instrument automatically mixes the faecal buffer solution with a latex-antihuman haemoglobin antibody rea-gent. The latex particles react with faeces samples containing human haemoglobin. The agglutination of the latex particles is proportional to the concentration of haemoglobin in the sample. By applying a conversion factor of 0.17, the concentration of haemoglobin in the buffer (ng Hb/mL buffer) can be used to determine the concentration of haemoglobin in faeces (μg Hb/g faeces). The measurement range is from 2 to 129 μg Hb/g faeces, the highest calibration concentra-tion. All events were performed in accordance with the maintenance
tasks, calibration methods and quality controls recommended by the manufacturer. The analyses were performed by a trained clini-cal laboratory technician. The laboratory has a total quality manage-ment system and is certified to ISO 9001:2015 standards by AENOR, Asociación Española de Normalización y Certificación (Spain).
Protocol design
An evaluation protocol was designed that included a training period and an analytical evaluation phase in which imprecision, the lin-earity of dilution, the carry over and f-Hb stability were examined. A clinical evaluation was performed to compare the f-Hb concentra-tions for different colonoscopy findings, including receiver operating characteristic (ROC) curves. Adenomas measuring 10 mm or more in diameter with villous architecture, high-grade dysplasia or intramu-cosal carcinoma were classified as advanced adenoma (AA). Invasive colorectal cancer (CRC) was considered to be present when malig-nant cells were observed beyond the muscularis mucosae. ACRN was defined as AA or invasive CRC. The sensitivity and specificity for CRC, AA and ACRN at different f-Hb cutoffs using all collected sam-ples were assessed as well as the diagnostic yield at different cutoffs, achieved using the first f-Hb concentration of two samples and the mean and the higher f-Hb concentration of two samples.
Analytical imprecision: Six samples (two controls, two
haemoglo-bin-spiked buffers and two f-Hb patient samples) were quantified and repeatedly examined 19 times in 1 day, and two controls were examined every day for at least 20 days. The mean, the standard deviation (SD) and the coefficient of variation (CV) of each sample were calculated.
Linearity: The highest concentration standard (129 μg Hb/g faeces)
was diluted with the appropriate buffer diluent to obtain a minimum of five dilutions within the dynamic range of the assay. Dilutions were prepared using calibrated pipettes. Recovery was calculated accord-ing to the highest measured concentration.
Sample carry over: carry over was determined using two human
blood-spiked buffer samples: a sample with a low test result close to the relevant decision cutoff (~20 μg Hb/g faeces) and a sample with a very high haemoglobin concentration (7650 μg Hb/g faeces). The samples were divided into 10 low aliquots (L) and 5 high aliquots (H). The aliquots were loaded into the analyser in the following order: L, L, L, L, L, H, L, H, L, H, L, H, L, H, L. The difference between the mean of the low measurements after a high measurement and the mean of the low measurements after a low measurement is equal to the carry-over. The maximum deviation was defined as twice the SD of the first five low measurements [24].
Test stability: Thirteen of the patients’ samples ranging from 12
to 1001 μg Hb/g faeces were aliquoted into single-use Eppendorf tubes to avoid contamination. They were stored at room temperature and then refrigerated and periodically analysed over 20 days. Their cumulative change compared with the initial measurement was reported as a ratio.
Endoscopy: Colonoscopies were performed without knowledge of
carcinoma, if present, were selected. All lesions were categorised, and if colorectal polyps were detected, the polyp sites were recorded and polypectomy was performed. Polyps were examined histologi-cally, and the size and type of each polyp were recorded according to the guidelines published by the European Society of Gastrointes-tinal Endoscopy [25]. The location and histology of carcinomas were also recorded. Polyps were categorised as either AA or non-advanced adenoma (NAA). Tumour staging was performed according to the TNM classification system used by the Union for International Can-cer Control (UICC) [26]. Patients were classified according to the most advanced lesion present.
Statistical analysis
A logarithmic transformation was performed to obtain a graphic rep-resentation of f-Hb concentrations. The Mann-Whitney U-test was used to analyse differences between groups’ haemoglobin concen-trations. An ROC curve for the FIT was drawn to determine the f-Hb cutoffs. Sensitivity, specificity and their 95% confidence interval (CI) were determined with the following two equations:
Sensitivity (S) True positive (TP)/(True positive [TP] False negative [FN])
= +
Specificity (SP) True negatives (TN)/(True negatives [TN] False positives [FP])
= +
The positive predictive value (PPV), negative predictive value (NPV) and their 95% CI for ACRN, CRC and AA at different f-Hb con-centrations were also calculated. The ROC curves for one and two tests were compared using the Delong method, and differences in sensitivity and specificity were calculated using one and two samples at the same cutoff. We determined the Pearson correlation coefficients of each pair of measurements. Cohen’s κ coefficient was calculated to measure the agreement between the first and the second FIT. Statisti-cal analysis was performed using PASW Statistics 18, Release Version 18.0.0 (SPSS, Inc., 2009, Chicago, IL, USA) and GraphPad Prism Ver-sion 4.00 (GraphPad Software, San Diego, CA, USA).
Results
Analytical evaluation
Analytical imprecision
The within-run imprecision CVs of the low control
(mean ± SD) (14 ± 1 μg Hb/g faeces), high control
(49 ± 1 μg Hb/g faeces), haemoglobin-spiked buffers
(29 ± 2 μg Hb/g faeces; 96 ± 4 μg Hb/g faeces) and f-Hb
patient samples (18 ± 1 μg Hb/g faeces; 100 ± 3 μg Hb/g
faeces) ranged from 1.7% to 5.1%. Between-run
impreci-sion CVs of the low control (mean ± SD) (14 ± 1 μg Hb/g
faeces) and high control (51 ± 2 μg Hb/g faeces) ranged
from 3.8% to 6.2%.
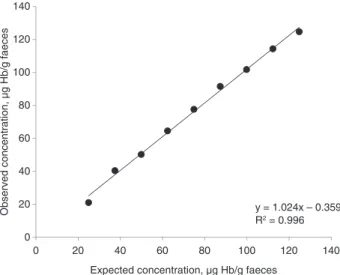
Linearity
Mean linearity was 101.1% for all dilutions (minimum
84.5%, maximum 108.1%), with an SD of 6.7% (Figure 1).
Carry over
The means and SDs of f-Hb concentrations after low and
high concentration samples (7650 μg Hb/g faeces) were
22 ± 2 μg Hb/g faeces and 23 ± 1 μg Hb/g faeces,
respec-tively. The maximum deviation was defined as twice the
SD of the first five low measurements; therefore, the
intra-assay carry over met the requirements.
Test stability
The decay of concentration (mean ± SD) that occurred
each day the samples were stored at room temperature
(24 °C ± 2 °C) was significantly higher than when they were
refrigerated (6 °C ± 2 °C) (p < 0.05). The decay per day, over
20 days, at room temperature ranged from 1.4% to 11%
(2.3% ± 1.2%) and when refrigerated ranged from 0.2% to
0.5% (0.4% ± 0.3%) per day.
Clinical performance
Patient and colonoscopy results
Of the 487 patients, 71 showed ACRN on colonoscopy
(14.6%; 12 CRC and 59 AA). NAA was found in 93 patients
0 20 40 60 80 100 120 140 0 20 40 60 80 100 120 140
Observed concentration, µg Hb/g faeces
Expected concentration, µg Hb/g faeces
y = 1.024x – 0.359 R2 = 0.996
(19.1%), and other lesions, such as hyperplastic or
inflam-matory polyps (28), diverticular disease (114),
haemor-rhoids (149), angiodysplasia (7), inflammatory bowel
disease (8) and minor irrelevant lesions (6), were found
alone or in combination in 230 patients (47.2%). Finally,
there were no colonoscopy findings for 93 individuals
(19.1%).
f-Hb concentrations
For the entire population undergoing colonoscopy,
the median and interquartile range (IQR) of the f-Hb
measurements for each of the analysed samples were
2 and 2–5 μg Hb/g faeces, respectively. The f-Hb results
according to colonoscopy and pathology diagnosis are
presented in Table 1. The f-Hb concentrations for patients
with ACRN (CRC + AA) were significantly higher than
those with a normal colonoscopy examination (Figure 2).
The results above 10, 20, 40 and 60 μg Hb/g faeces were
19.6%, 15.8%, 11.5% and 10%, respectively.
Sensitivity, specificity and predictive values for different
colonoscopy findings, including ACRN
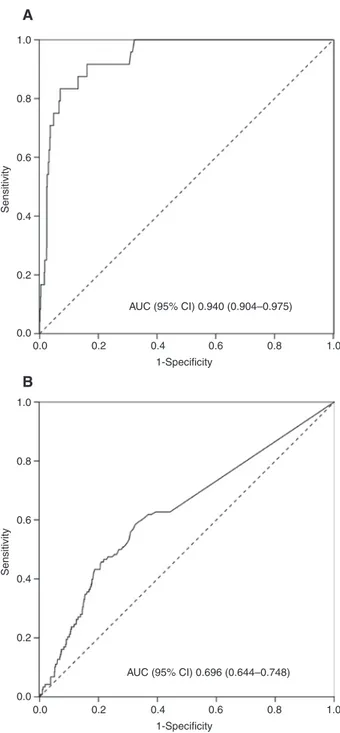
Figure 3 shows the ROC curve for CRC and ACRN based on
the FIT results for each participant. We measured the
sen-sitivity and specificity of the FIT results at various
haemo-globin cutoffs (Table 2). At a 10 μg Hb/g faeces cutoff, the
sensitivity and specificity for detecting ACRN were 46.5%
(95% CI, 38.1%–55%) and 85% (95% CI, 82.3%–87.3%),
respectively. At 30 μg Hb/g faeces cutoff, the sensitivity
and specificity for detecting ACRN were 33.8% (95% CI,
26.2%–42.3%) and 91% (95% CI, 88.8%–92.8%),
respec-tively. When a 10 μg Hb/g faeces cutoff was used,
sensi-tivity increased by 35% and specificity decreased by 7%
compared with a 30 μg Hb/g faeces cutoff. The sensitivity
for detecting CRC was considerably higher than that for
detecting clinical ACRN (Table 2). In the studied group, the
PPV for detecting CRC and ACRN at cutoffs between 10 and
60 μg Hb/g faeces ranged from 11.6% to 20.6% and from
34.7% to 42.3%, respectively, and the NPV for ACRN ranged
from 90.2% to 88.4%. Table 2 also includes the sensitivity
and specificity of FIT at various f-Hb cutoffs for different
colonoscopy findings. In the studied group, the sensitivity
for detecting all types of colorectal lesions between cutoffs
of 10 and 60 μg Hb/g faeces ranged from 11.9% to 23% and
the specificity ranged from 94.6% to 97.8%.
Diagnostic yield using one or two samples
The correlation coefficients of the first and the second
FITs were 0.46. The κ coefficient at different cutoff values
(Table 3) showed a substantial agreement between the
first and the second FITs. We measured f-Hb of each of two
consecutive faecal samples but considered them to
repre-sent one test, to which we assigned the mean and higher
result of the two FITs. Figure 4 shows the ROC curves for
ACRN based on the first, mean and higher FIT
measure-ments for each participant. No statistical differences were
observed among these measurements. Table 3 shows the
sensitivity and specificity of the first, second, higher and
mean FIT results for ACRN at different cutoff values, as
well as discrepancies between the first and the second
sample and the κ coefficient between both samples.
Table 1: μg Hb/g faeces concentration of all samples according to
colonoscopy and pathology diagnosis.
Diagnosis No. of samples Median IQR p-Valuea
CRC 24 637 101–1034 <0.001 CRC + AA 142 8 2–93 <0.001 Adenomas AA 118 3 2–25 <0.001 NAA 183 2 2–11 <0.001 Other 456 2 2–4 0.002 Normal 186 2 2–2
CRC, colorectal cancer; AA, advanced adenoma; NAA, non-advanced adenoma; IQR, interquartile range. Concentrations ≤ 2 μg Hb/g faeces might be below the limit of detection. aSignificance in relation to normal group.
10,000 1000 100 10 1 LLQ 0 CRC AA NAA Colonoscopy findings µg H b/ g faeces Other Normal
Figure 2: Box plot of f-Hb concentration according to colonoscopy
and pathology diagnosis.
CRC, colorectal cancer; AA, advanced adenoma; NAA, non-advanced adenoma; LLQ, lower limit of quantification.
Discussion
To our knowledge, this is the first study to report detailed
analytical and clinical data using the SENTiFIT
®270
ana-lyser (Sentinel Diagnostics, distributed in Spain by Sysmex
España, S.L.U.). This colonoscopy-controlled study
per-mitted a detailed evaluation of an automated desktop
instrument for quantitative immunochemical
determina-tion of f-Hb. The evaluadetermina-tion included studies of
impreci-sion, linearity of dilution, carry over and test stability as
well as a clinical study to assess the diagnostic yield.
The analytical imprecision was below 6.2%.
Further-more, the effects of carry over were not detected below
7650 μg Hb/g faeces. In a hypothetical situation in which
a sample with a haemoglobin concentration higher than
7650 μg Hb/g faeces was followed by a sample with a
haemoglobin concentration near the decision cutoff,
reanalysis of the latter sample would need to be
consid-ered to avoid haemoglobin contamination. However, this
situation is very rare (0.4% of the samples of the present
study) because few samples have such high f-Hb and even
fewer are followed by a sample near the decision cutoff.
Haemoglobin stability was evaluated at different
tem-peratures. Samples stored in a refrigerated environment
showed slight decay (0.2%–0.5% per day) compared with
those stored at room temperature (1.4%–11% per day).
In a mixed group of individuals, the sensitivity and
specificity for ACRN at cutoffs between 10 and 60 μg Hb/g
faeces ranged from 28.9% (95% CI, 21.7%–37.2%) to 46.5%
(95% CI, 38.1%–55%) and from 85% (95% CI, 82.3%–
87.3%) to 93.2% (95% CI, 91.2%–94.8%), respectively. It is
important to note that the high specificity and NPV (90%)
helps rule out the presence of ACRN, which is a relevant
issue in symptomatic patients. The specificity of all types
of colorectal lesions at cutoffs between 10 and 60 μg Hb/g
faeces is very high (94.6%–97.8%), as is the PPV for
detect-ing colorectal lesions (95.9%–94.7%). However,
sensitiv-ity and NPV for all detected lesions are very low, ranging
from 11.9% to 23% and from 20.9% to 22.7%, respectively.
This ensures detection of colorectal pathology but does
not rule out minor findings such as NAA or other minor
lesions. It is important because when f-Hb is below an
established cutoff, severe lesions can be ruled out and
only some minor lesions may be overlooked.
Due to the study’s characteristics, all patients were
symptomatic or under surveillance, and therefore the
positivity rate at different cutoffs was higher than in
aver-age-risk populations [27, 28]. Thus, further studies are
necessary. The poor correlation between the first and the
second samples can probably be ascribed to the
reproduc-tion of daily variareproduc-tions in blood loss, heterogeneous blood
distribution inside faeces and the inherent characteristics
of the specimen collection devices. Otherwise, the κ
coef-ficients and the discrepancies between the first and the
second FITs at different cutoff values showed a substantial
agreement and a proportion of discrepancies below 7%.
This study confirmed that using a 40 μg Hb/g faeces
cutoff permits the detection of most CRCs (83.3%) and
1.0 0.8 0.6 Sensitivity 0.4 0.2 0.0 0.0 0.2 0.4 1-Specificity AUC (95% CI) 0.940 (0.904–0.975) 0.6 0.8 1.0 1.0 0.8 0.6 Sensitivity 0.4 0.2 0.0 0.0 0.2 0.4 1-Specificity AUC (95% CI) 0.696 (0.644–0.748) 0.6 0.8 1.0A
B
Figure 3: Receiver operating characteristic (ROC) curve of f-Hb
concentration from all samples for the identification of CRC (A) and ACRN (B).
ACRN, advanced colorectal neoplasia; CRC, colorectal cancer; AUC (95% CI), area under the curve (95% CI).
Ta ble 2: Sen siti vity , s pec ific ity , po siti ve pr edicti ve va lue (PPV ) and neg ati ve pr edicti ve va lue (NPV ) (95% C I) at diff er ent f-Hb c ut off s. 10 μg Hb/g f aec es 20 μg Hb/g f aec es 30 μg Hb/g f aec es 40 μg Hb/g f aec es 50 μg Hb/g f aec es 60 μg Hb/g f aec es Sen siti vity CR C 91.7% 87.5% 83.3% 83.3% 83.3% 83.3% (71.5%–98.5%) (66.5%–96.7%) (61.8%–94.5%) (61.8%–94.5%) (61.8%–94.5%) (61.8%–94.5%) CRC + A A 46.5% 38% 33.8% 31.7% 30.3% 28.9% (38.1%–55%) (30.1%–46.6%) (26.2%–42.3%) (24.3%–40.1%) (23%–38.7%) (21.7%–37.2%) CRC + A A + NA A 34.5% 26.8% 21.8% 20.3% 19.4% 18.4% (29.4%–39.9%) (22.1%–32%) (17.6%–26.8%) (16.2%–25.2%) (15.3%–24.2%) (14.5%–23.2%) CRC + A A + NA A + Other 23% 18.6% 14.9% 13.4% 12.4% 11.9% (20.2%–26.2%) (15.9%–21.5%) (12.5%–17.6%) (11.2%–16.1%) (10.2%–15%) (9.8%–14.4%) Spec ific ity CR C 82.2% 86% 89.2% 90.3% 91.4% 91.8% (79.6%–84.5%) (83.6%–88.1%) (87%–91.1%) (88.2%–92.1%) (89.4%–93.1%) (89.9%–93.5%) CRC + A A 85% 88% 91% 92% 93% 93.2% (82.3%– 87.3%) (85.5%–90.1%) (88.8%– 92.8%) (89.9%–93.7%) (91%–94.6%) (91.2%–94.8%) CRC + A A + NA A 87.9% 89.7% 92.1% 93% 94.1% 94.2% (85%–90.2%) (87%–91.9%) (89.6%–94%) (90.7%–94.8%) (91.9%–95.7%) (92.1%–95.9%) CRC + A A + NA A + Other 94.6% 95.7% 96.7% 96.8% 97.8% 97.8% (90.1%–97.2%) (91.4%–98%) (92.8%–98.7%) (92.8%–98.7%) (94.2%–99.3%) (94.2%–99.3%) PPV CRC 11.6% 13.7% 16.4% 18% 19.8% 20.6% (7.6%–17.2%) (8.9%–20.4%) (10.5%–24.4%) (11.6%– 26.7%) (12.8%–29.2%) (13.3%–30.3%) CRC + A A 34.7% 35.3% 39.3% 40.5% 42.6% 42.3% (28.1%–42%) (27.9%–43.5%) (30.7%–48.6%) (31.4%–50.3%) (33%–52.8%) (32.4%–52.7%) CRC + A A + NA A 58.9% 56.9% 58.2% 59.5% 62.4% 61.9% (51.6%–65.9%) (48.6%–64.8%) (48.9%–67%) (49.7%–68.5%) (52.1%–71.7%) (51.4%–71.4%) CRC + A A + NA A + Other 94.7% 94.8% 95.1% 94.6% 96% 95.9% (90.3%–97.3%) (89.6%–97.5%) (89.2%–98%) (88.1%–97.8%) (89.6%–98.7%) (89.2%–98.7%) NPV CRC 99.7% 99.6% 99.5% 99.5% 99.5% 99.5% (99%–99.9%) (98.8%–99.9%) (98.7%–99.8%) (98.7%–99.8%) (98.7%–99.8%) (98.7%–99.8%) CRC + A A 90.2% 89.2% 88.9% 88.7% 88.6% 88.4% (87.9%–92.2%) (86.8%–91.2%) (86.5%–90.9%) (86.3%–90.7%) (86.2%–90.6%) (86%–90.4%) CRC + A A + NA A 72.6% 70.8% 69.9% 69.7% 69.7% 69.5% (69.3%–75.7%) (67.5%–73.8%) (66.7%–73%) (66.5%–72.8%) (66.5%–72.8%) (66.3%–72.6%) CRC + A A + NA A + Other 22.7% 21.9% 21.3% 21% 21% 20.9% (19.8%–25.8%) (19.1%–25%) (18.6%–24.3%) (18.4%–23.9%) (18.4%–23.9%) (18.3%–23.8%) CRC, c olor ect al canc er; A A, adv anc ed adenom a; NA A, non-adv anc ed adenom a.
Ta ble 3: Sen siti vity and spec ific ity (95% C I) f or A CRN of the fir st , the sec ond
, the higher and
the me an f -Hb c onc ent ration of tw o c ol lect ed samp le s at diff er ent f-Hb c ut off s. 10 μg Hb/g f aec es 20 μg Hb/g f aec es 30 μg Hb/g f aec es 40 μg Hb/g f aec es 50 μg Hb/g f aec es 60 μg Hb/g f aec es Sen siti vity (fir st samp le) 45.7% 37.1% 35.7% 32.9% 31.4% 30% (33.7%–58.1%) (26.1%–49.6%) (24.6%–48.1%) (22.4%–45.2%) (20.9%–43.6%) (19.9%–42.3%) Spec ific ity (fir st samp le) 84.7% 87.9% 90.3% 91.1% 92.3% 92.3% (80.8%–88%) (84.2%–90.8%) (87%–93.1%) (87.8%–93.6%) (89.3%–94.7%) (89.2%–94.6%) Sen siti vity (sec ond samp le) 47.1% 38.6% 32.9% 31.4% 30% 28.6% (35.1%–59.5%) (27.4%–51%) (22.1%–45.1%) (21.1%–43.8%) (19.6%–42.1%) (18.7%–40.8%) Spec ific ity (sec ond samp le) 85.1% 87.9% 91.8% 92.8% 93.6% 94.1% (81.3%–88.5%) (84.2%–90.8%) (88.7%–94.3%) (89.7%–95.1%) (90.7%–95.8%) (91.2%–96.1%) κ c oeffic ient 0.607 0.614 0.630 0.609 0.598 0.606 (0.516 – 0.698) (0.516–0.712) (0.524 – 0.737) (0.497–0.722) (0.479 – 0.717) (0.486–0.727) Di sc rep anc ie s: Fir st neg ati ve/sec ond po siti ve 6.1% 5.3% 3.4% 3.2% 3.2% 2.7% Di sc rep anc ie s: Fir st po siti ve/sec ond neg ati ve 6.3% 5.1% 4.9% 4.9% 4.4% 4.4% Sen siti vity (higher s amp le) 52.9% 47.1% 42.9% 40% 38.6% 37.1% (40.6%–64.9%) (35.2%–59.4%) (31.1%–55.3%) (28.7%–52.4%) (27.2%–51%) (26.1%–49.6%) Spec ific ity (higher s amp le) 78.7% 83.4% 87.7% 88.6% 89.9% 90.3% (74.4%–82.6%) (79.3%–86.8%) (84%–90.7%) (85%–91.5%) (86.5%–92.6%) (86.9%–93%) Sen siti vity (me an s amp le) 52.9% 44.3% 38.6% 37.1% 37.1% 32.9% (40.6%–64.9%) (32.6%–56.6%) (27.2%–51%) (26.1%–49.6%) (25.9%–49.5%) (22.4%–45.2%) Spec ific ity (me an s amp le) 82.1% 87.4% 89.1% 90.3% 91.6% 92.4% (78%–85.7%) (83.6%–90.4%) (85.6%–92%) (86.9%–93%) (88.4%–94.1%) (89.2%–94.6%) κ c oeffic ient (95% C I) and di sc rep anc ie s betw
een the fir
st and the sec ond f-Hb s amp le. A CRN, adv anc ed co lor ect al neop la si a.
21.2% of AAs, resulting in a combined sensitivity of 31.7%
and a specificity of 92%. By using two samples for each
patient and choosing the highest result, the
sensitiv-ity for ACRN increases to 40%, resulting in a specificsensitiv-ity
of 88.6%, while on the other hand a similar diagnostic
yield is obtained using only one sample and decreasing
the cutoff. Moreover, when one sample and a 10 μg Hb/g
faeces cutoff are used, it is possible to rule out the majority
of malignant lesions, missing two CRCs out of 24,
obtain-ing a very high NPV (99.7%), a characteristic observed for
all f-Hb concentrations and even at a 60 μg Hb/g faeces
cutoff, missing four CRCs out of 24, maintaining a high
NPV (99.5%). These results can help make decisions not
only related to the performance and prioritisation of
colo-noscopies for symptomatic patients but even ruling out
malignancy in patients with low f-Hb concentrations.
Additionally, they are consistent with results from a
screening set and other studies that used
immunochemi-cal tests to screen larger populations [5, 6, 29–35].
Conclusions
In conclusion, the current study provides useful data
regarding the potential application of an automated FIT to
CRC screening and diagnosis of symptomatic patients. The
compact, fully automated immunochemistry analyser,
which evaluated f-Hb demonstrated adequate analytical
and clinical performance. The test used in the current
study is easy to perform, and the results are independent
of the operator’s experience. We have demonstrated that
the SENTiFIT assay (Sentinel Diagnostics, Italy; Sysmex,
Spain) is a specific and accurate test for detecting ACRN in
symptomatic patients and those undergoing surveillance.
Author contributions: All the authors have accepted
responsibility for the entire content of this submitted
manuscript and approved submission.
Research funding: None declared.
Employment or leadership: None declared.
Honorarium: None declared.
Competing interests: The funding organization(s) played
no role in the study design; in the collection, analysis, and
interpretation of data; in the writing of the report; or in the
decision to submit the report for publication.
References
1. Brenner H, Haug U, Hundt S. Sex differences in performance of fecal occult blood testing. Am J Gastroenterol 2010;105:2457–64. 2. Hol L, Wilschut JA, van Ballegooijen M, van Vuuren AJ, van d
V, Reijerink JC, et al. Screening for colorectal cancer: random comparison of guaiac and immunochemical faecal occult blood testing at different cut-off levels. Br J Cancer 2009;100:1103–10. 3. Parra-Blanco A, Gimeno-Garcia AZ, Quintero E, Nicolas D, Moreno
SG, Jimenez A, et al. Diagnostic accuracy of immunochemical versus guaiac faecal occult blood tests for colorectal cancer screening. J Gastroenterol 2010;45:703–12.
4. Fraser CG, Halloran SP, Allison JE, Young GP. Making colorectal cancer screening fitter for purpose with quantitative faecal immunochemical tests for haemoglobin (FIT). Clin Chem Lab Med 2013;51:2065–7.
5. Auge JM, Fraser CG, Rodriguez C, Roset A, Lopez-Ceron M, Grau J, et al. Clinical utility of one versus two faecal immunochemical test samples in the detection of advanced colorectal neoplasia in symptomatic patients. Clin Chem Lab Med 2016;54:125–32. 6. Cubiella J, Salve M, Diaz-Ondina M, Vega P, Alves MT, Iglesias F,
et al. Diagnostic accuracy of the faecal immunochemical test for colorectal cancer in symptomatic patients: comparison with NICE and SIGN referral criteria. Colorectal Dis 2014;16:O273–82. 7. Godber IM, Todd LM, Fraser CG, MacDonald LR, Younes HB. Use
of a faecal immunochemical test for haemoglobin can aid in the investigation of patients with lower abdominal symptoms. Clin Chem Lab Med 2016;54:595–602.
8. McDonald PJ, Digby J, Innes C, Strachan JA, Carey FA, Steele RJ, et al. Low faecal haemoglobin concentration potentially rules out significant colorectal disease. Colorectal Dis 2013;15:e151–9. 9. Mowat C, Digby J, Strachan JA, Wilson R, Carey FA, Fraser CG,
et al. Faecal haemoglobin and faecal calprotectin as indicators of bowel disease in patients presenting to primary care with bowel symptoms. Gut 2016;65:1463–9. 1.0 0.8 0.6 0.4 0.2 0.0 0.0 0.2 0.4 0.6 1-Specificity Sensitivity
First AUC (95% CI) 0.699 (0.626–0.772) Mean AUC (95% CI) 0.689 (0.613–0.765) Higher AUC (95% CI) 0.685 (0.685–0.761)
0.8 1.0
Figure 4: Receiver operating characteristic (ROC) curve of the
first, the mean and the higher f-Hb concentration of two collected samples for the identification of ACRN.
ACRN, advanced colorectal neoplasia; AUC (95% CI), area under the curve (95% CI).
10. Rodriguez-Alonso L, Rodriguez-Moranta F, Ruiz-Cerulla A, Lobaton T, Arajol C, Binefa G, et al. An urgent referral strategy for symptomatic patients with suspected colorectal cancer based on a quantitative immunochemical faecal occult blood test. Dig Liver Dis 2015;47:797–804.
11. Widlak MM, Thomas CL, Thomas MG, Tomkins C, Smith S, O’Connell N, et al. Diagnostic accuracy of faecal biomarkers in detecting colorectal cancer and adenoma in symptomatic patients. Aliment Pharmacol Ther 2017;45:354–63.
12. Hol L, van Leerdam ME, van Ballegooijen M, van Vuuren AJ, van Dekken H, Reijerink JC, et al. Screening for colorectal cancer: randomised trial comparing guaiac-based and immunochemi-cal faeimmunochemi-cal occult blood testing and flexible sigmoidoscopy. Gut 2010;59:62–8.
13. Park DI, Ryu S, Kim YH, Lee SH, Lee CK, Eun CS, et al. Comparison of guaiac-based and quantitative immunochemical fecal occult blood testing in a population at average risk undergoing colorec-tal cancer screening. Am J Gastroenterol 2010;105:2017–25. 14. van Rossum LG, van Rijn AF, van Oijen MG, Fockens P, Laheij RJ,
Verbeek AL, et al. False negative fecal occult blood tests due to delayed sample return in colorectal cancer screening. Int J Cancer 2009;125:746–50.
15. van Rossum LG, van Rijn AF, Laheij RJ, van Oijen MG, Fockens P, van Krieken HH, et al. Random comparison of guaiac and immunochemical fecal occult blood tests for colorectal cancer in a screening population. Gastroenterology 2008;135:82–90. 16. Whitlock EP, Lin JS, Liles E, Beil TL, Fu R. Screening for colorectal
cancer: A targeted, updated systematic review for the US Pre-ventive Services Task Force. Ann Intern Med 2008;149:638–58. 17. Phalguni A, Seaman H, Routh K, Halloran S, Simpson S. Tests
detecting biomarkers for screening of colorectal cancer: What is on the horizon? GMS Health Technol Assess 2015;11:1–14. 18. Carroll M, Piggott C, Pearson S, Seaman H, Halloran S.
Evalua-tion of quantitative faecal immunochemical tests for haemoglo-bin. Guildford, UK: Guildford Medical Device Evaluation Centre (GMEC), 2014.
19. Fraser CG, Allison JE, Halloran SP, Young GP. A proposal to standardize reporting units for fecal immunochemical tests for hemoglobin. J Natl Cancer Inst 2012;104:810–4.
20. Fraser CG, Allison JE, Young GP, Halloran SP, Seaman H. A stand-ard for faecal immunochemical tests for haemoglobin evaluation reporting (FITTER). Ann Clin Biochem 2014;51:301–2.
21. Rapi S, Rubeca T, Fraser CG. How to improve the performances of fecal immunological tests (FIT): need for standardization of the sampling and pre-analytical phases and revision of the procedures for comparison of methods. Int J Biol Markers 2015;30:e127–31.
22. Rubeca T, Cellai F, Confortini M, Fraser CG, Rapi S. Impact of preanalytical factors on fecal immunochemical tests: need for new strategies in comparison of methods. Int J Biol Markers 2015;30:e269–74.
23. Chiang TH, Chuang SL, Chen SL, Chiu HM, Yen AM, Chiu SY, et al. Difference in performance of fecal immunochemical tests with the same hemoglobin cutoff concentration in a nation-wide colorectal cancer screening program. Gastroenterology 2014;147:1317–26.
24. Haeckel R. Recommendations for the application of statistical methods in the comparison of methods of clinical chemical analysis. J Clin Chem Clin Biochem 1982;20:107–10. 25. Hassan C, Quintero E, Dumonceau JM, Regula J, Brandao C,
Chaussade S, et al. Post-polypectomy colonoscopy surveillance: European Society of Gastrointestinal Endoscopy (ESGE) guide-line. Endoscopy 2013;45:842–51.
26. Sobin L, Gospodarowicz M, Wittekind C. TNM classification of malignant tumours. 7th ed. New York: Wiley-Blackwell, 2009. 27. Castiglione G, Zappa M, Grazzini G, Rubeca T, Turco P, Sani C, et al. Screening for colorectal cancer by faecal occult blood test: comparison of immunochemical tests. J Med Screen 2000;7:35–7.
28. Grazzini G, Visioli CB, Zorzi M, Ciatto S, Banovich F, Bonanomi AG, et al. Immunochemical faecal occult blood test: Number of samples and positivity cutoff. What is the best strategy for colorectal cancer screening? Br J Cancer 2009;100:259–65. 29. Allison JE, Tekawa IS, Ransom LJ, Adrain AL. A comparison of
fecal occult-blood tests for colorectal-cancer screening. N Engl J Med 1996;334:155–9.
30. Auge JM, Rodriguez C, Pellise M, Bernal A, Grau J, Castells A, et al. Analytical and clinical performance of Kroma iT, a compact fully-automated immunochemistry analyzer for fecal occult hemoglobin. Anticancer Res 2013;33:5633–7.
31. Petrelli N, Michalek AM, Freedman A, Baroni M, Mink I, Rodri-guez-Bigas M. Immunochemical versus guaiac occult blood stool tests: results of a community-based screening program. Surg Oncol 1994;3:27–36.
32. Robinson MH, Pye G, Thomas WM, Hardcastle JD,
Mangham CM. Haemoccult screening for colorectal cancer: the effect of dietary restriction on compliance. Eur J Surg Oncol 1994;20:545–8.
33. St John DJ, Young GP, Alexeyeff MA, Deacon MC, Cuthbert-son AM, Macrae FA, et al. Evaluation of new occult blood tests for detection of colorectal neoplasia. Gastroenterology 1993;104:1661–8.
34. Grobbee EJ, van der Vlugt M, van Vuuren AJ, Stroobants AK, Mundt MW, Spijker WJ, et al. A randomised comparison of two faecal immunochemical tests in population-based colorectal cancer screening. Gut 2017;66:1975–82. [Epub ahead of print]. 35. Passamonti B, Malaspina M, Fraser CG, Tintori B, Carlani A,
D’Angelo V, et al. A comparative effectiveness trial of two faecal immunochemical tests for haemoglobin (FIT). Assessment of test performance and adherence in a single round of a popu-lation-based screening programme for colorectal cancer. Gut 2016. doi: 10.1136/gutjnl-2016-312716. [Epub ahead of print].