Contents lists available atScienceDirect
Ecological Indicators
journal homepage:www.elsevier.com/locate/ecolind
Short Note
Towards the development of an index for the holistic assessment of the
health status of a honey bee colony
Gianni Gilioli
a, Giorgio Sperandio
a,b, Fani Hatjina
c, Anna Simonetto
a,b,⁎,1 aDep. of Molecular and Translational Medicine, University of Brescia, Brescia, ItalybDep. of Life Sciences, University of Modena and Reggio Emilia, Reggio Emilia, Italy cDivision of Apiculture, Hellenic Agricultural Organisation ‘DEMETER’, Nea Moudania, Greece
A R T I C L E I N F O Keywords:
Health Status Index Beekeeping Honey bees Multiple stressors Structural Equation Models Holistic risk assessment
A B S T R A C T
Honey bees play an important role in the maintenance of both, biodiversity and food security through pollination services and also represent an important source of income for rural areas. Despite several studies and monitoring projects gathering a large amount of data on the main factors/stressors influencing honey bee colonies, there is a lack of holistic and multidimensional statistical tools integrating different aspects which define honey bee colony health. Such tools are important to support the sustainable management of honey bees. In this study, we designed and tested a methodological framework based on Structural Equation Models for the development of a honey bee Health Status Index. The index accounts for the main abiotic (e.g. pesticide contamination, landscape characteristics) and biotic (e.g. parasitosis, virosis) factors influencing honey bee health, including the beekeepers role in managing the colony. The proposed methodology was validated against a dataset representing seven scenarios generated through Expert Knowledge Elicitation. The validation procedure showed that the Health Status Index integrates different sources of data and it can quantify the health status of a honey bee colony based on the characteristics of each scenario. Furthermore, it allows the investigation of the influence of different drivers/stressors on the health of the honey bee colony. The Health Status Index provides flexibility in the selection of variables, making it a valuable tool for holistic and harmonised assessment of honey bee health. Once validated, the index can support the evaluation at different spatial (from local- to area-wide management) and temporal (medium- to long-term management) scales to support stakeholders’ (e.g. beekeepers, risk assessors, risk managers) decision-making.
1. Introduction
Honey bees play a key role in the maintenance of important ecosystems services, such as pollination of cultivated (Bommarco et al., 2012; Bradbear, 2009; Klein et al., 2007) and wild plants (Aguilar et al., 2006; Ashman et al., 2004). Both of which are important for ensuring food security (Bommarco et al., 2013). In addition, honey bees represent an important source of income for beekeepers (Formato and Smulders, 2011; Mizrahi and Lensky, 2013; Schmidt, 1997) contributing to an increase in economic value of rural areas (Deloitte, 2013). In the last few decades managed honey bees have faced a widespread decline (Brodschneider et al., 2016; Genersch et al., 2010; Jacques et al., 2017; Lee et al., 2015; Porrini et al., 2016; Steinhauer et al., 2014; VanEngelsdorp et al., 2011) raising concerns for the sustainability of the beekeeping sector (Potts et al., 2010). Recent research has shown the
importance of considering the co-occurrence and interaction of different drivers/stressors when assessing the health of the honey bee colony (Doublet et al., 2015; Goulson et al., 2015; Sánchez-Bayo et al., 2016). However, la-boratory and field studies highlight some limitations in understanding the combined influence of factors on honey bee colony health (Becher et al., 2013). Therefore, there is an expressed need for new methodological tools capable of analysing the impact of co-occurring factors on honey bee health. These tools if properly developed and tested could contribute to holistically assess the impacts caused by multiple stressors on honey bees (Goulson et al., 2015). Furthermore, they support stakeholders’ (beekeepers, risk managers etc.) decision-making (Rortais et al., 2017). Honey bee colony health is a complex, dynamic and multidimensional property. It is the result of the in-teraction between the colony demography, energetics, temporal and spatial pattern of environmental resources availability in the landscape. Honey bee
https://doi.org/10.1016/j.ecolind.2019.01.024
Received 9 November 2018; Received in revised form 26 December 2018; Accepted 8 January 2019
Abbreviations: HSI, Health Status Index; SEM, Structural Equation Modelling; EKE, Expert Knowledge Elicitation; RPU, resource providing unit; ENV, environmental drivers; BMP, beekeeping management practices; QUE, queen; IHP, in-hive products; CON, contamination; DII, disease-infection-infestation; DEM, demography; BEH, behaviour; PLS-PM, Partial Least Squares Modelling
⁎Corresponding author.
E-mail address:[email protected](A. Simonetto).
1Dep. of Molecular and Translational Medicine, University of Brescia, Viale Europa, 11, 25123 Brescia, Italy.
1470-160X/ © 2019 Elsevier Ltd. All rights reserved.
colony health is also influenced by the population dynamics, epidemiology of pests and diseases, the level of contamination in the environmental matrices, and also beekeeping practices. As an emerging property (EFSA AHAW Panel, 2016), honey bee colony health can be considered, from a statistical point of view, as a latent variable (Spearman, 1904) since it cannot be directly measured and it has to be estimated from one or more observable variables (called indicators). Structural Equation Modelling (SEM) (Bollen, 1989) is the most widely used methodology for the analysis of latent variables, as it as-sesses the relation between latent variables and their indicators to summarise them into a composite index. By applying SEM it is possible to: (i) take into account, as indicators, different types of variables (e.g. continuous, ordinal, nominal, dichotomic), (ii) analyse the causal relationships existing between variables (both latent and indicator variables), (iii) examine whether the re-lationship assumed a priori is consistent with empirical data and (iv) provide estimates of latent variables that can be used in predictive models. Initially used within the social sciences (Guo et al., 2008), SEM-based indexes are currently widely used in various research fields. Significant examples of ap-plication concern ecological (Arhonditsis et al., 2006; Iriondo et al., 2003; Villeneuve et al., 2018) and human health related issues (Boniface and Tefft, 1997; Cheung and Hong, 2017; Eldridge et al., 2017).
The aim of our paper was to develop and test a methodological framework based on SEM, for both, the definition and quantification of the health status of managed honey bee colonies (Health Status Index, HSI), taking into account the influence of biotic and abiotic drivers/ stressors. The conceptual framework at the basis of the HSI was tested using a dataset generated through a semiformal Expert Knowledge Elicitation (EKE) procedure (EFSA, 2014, 2018).
2. Materials and methods
2.1. Conceptual framework
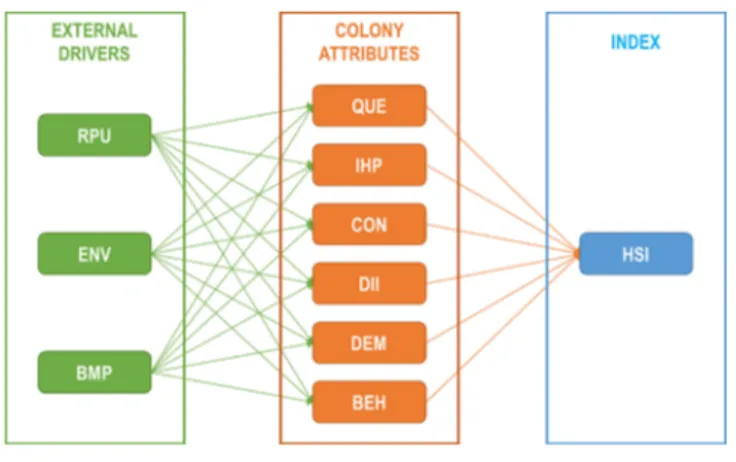
We developed a hierarchical conceptual framework for the definition of the health status of a honey bee colony based on the work carried out by EFSA AHAW Panel (2016). Two overarching constructs, the “external dri-vers” influencing the honey bee colony and the “colony”, are used to define the conceptual framework. A set of attributes that are not directly mea-surable, (namely latent variables) defines each construct. Each attribute is composed by a set of indicators (i.e. variables) that could be directly measured. The selection of the most relevant indicators was performed taking into account their biological relevance in relation to honey bee colony health and the SEM requirements, (e.g. unidimensionality and in-ternal consistency) (Simonetto, 2012). The external drivers construct is composed by three attributes: resource providing unit (RPU), environ-mental drivers (ENV) and beekeeping management practices (BMP). The colony construct is composed by five attributes: queen (QUE), in-hive products (IHP), contamination (CON), disease-infection-infestation (DII), demography (DEM) and behaviour (BEH). The conceptual framework adopted in this study and a detailed description of the attributes is presented inTable 1. A throughout description of the selected indicators can be found inAppendix A (Section A.1). We hypothesised that the external drivers construct has a direct influence on the colony construct. Then, the HSI is an opportune synthesis of the colony construct providing a quantification of the health status of a honey bee colony (Fig. 1).
Table 1
2.2. Methodological framework
To estimate the HSI, we applied the Partial Least Squares Path Modelling (PLS-PM) approach (Tenenhaus et al., 2005; Vinzi et al., 2010). The PLS-PM is a SEM method allowing the investigation of complex cause-effect relationships existing between attributes, measured by sets of in-dicators. PLS-PM was chosen because the attributes are estimated as a linear combination (a weighted sum) of their indicators.
A full PLS-PM is composed by two sub-models: the inner model (or structural model) representing the relationships between the attributes, and the outer model (or measurement model), in which the attributes are linked with their indicators. HSI estimation was performed using the R package plspm (Sanchez, 2013).
2.2.1. Inner model
The inner (structural) model describes the relationships among at-tributes. The j-th latent variable jis a linear combination of the other
latent variables:
= + + forj=1,…, .J
j 0j j j
j
0 is the intercept term, jis the vector of path coefficient( )ij and jis
the structural error (or disturbance) term. ijrepresents the strength
and the direction of the effects of the i-th construct on j. θ is the vector
of the J latent variables. All pairs of structural error terms in the model are assumed to be uncorrelated. A graphical representation of the inner model defined for the HSI is showed inFig. 2.
2.2.2. Outer model
The following equations describe the outer (measurement) model linking indicators to the related attributes:
= + + = …
Yr 0r r r forr 1, , .R
Yrrepresents the observed measure of the r-th indicator.Yris defined as
a linear combination of the latent variables, where 0ris the intercept
term and ris the vector of coefficients rj(also called loadings). The
loading rj represents the regression coefficient between the r-th
indicator and the j-th latent variable. ris the measurement error.
The HSI outer model (Fig. 3) is based on the indicators mentioned in Table 1. The HSI latent variable is considered a second-order construct since it involves more than one dimension (i.e. the six attributes referring to the colony construct) without any specific indicator. To model the second-order construct HSI we adopted the strategy proposed bySanchez (2013) attri-buting to HSI the 19 indicators related to the colony construct.
2.3. Data generation
The generation of datasets to estimate the parameters of the HSI required the following: (i) the development of realistic scenarios, re-lated to the external drivers construct and the indicators referring to the DII attribute, (ii) the estimation of uncertainty distributions of the other indicators for each scenario and (iii) the generation of observations based on random sampling from estimated probability distributions. A scenario is defined by the set of values assumed by the indicators re-ferring to RPU, ENV, BMP and DII. The scenarios were used to provide the expert realistic contexts from which starting the EKE procedure. Firstly, we chose five geographical areas in Greece considered suitable for beekeeping activities. For each area, we defined the prevalent cli-mate type according to Köppen-Geiger classification (Kottek et al., 2006), the season (month) and the prevalent land cover/use according to the first level of CORINE Land Cover classification (EEA, 2014). The availability of nectar and pollen in the RPU and the characteristics of the beekeeper (experience, category and adherence to organic pro-duction system) were selected to cover a wide range of beekeeping conditions. Finally, we defined the sanitary conditions of the colony (DII indicators). Seven scenarios representing realistic beekeeping conditions in different areas of Greece were developed (Appendix B, Section A.2). Two scenarios were related to agricultural areas (AGR1 and AGR2) while five scenarios were related to forests and semi-natural areas (FOR1, FOR2, FOR3, FOR4 and FOR5). Particular attention was paid to represent a gradient of possible beekeeping situations. Thus, scenarios were diversified by:
•
The availability of pollen and nectar in the RPU which is high in FOR1, FOR3 and FOR5 and low in AGR1;•
The experience of beekeepers, considered high in AGR1, AGR2, FOR2 and FOR3 and low in FOR1 and FOR5;•
The sanitary conditions of the colony, which are considered good in FOR3 and poor in AGR2, FOR2 and FOR4.Based on these seven scenarios, we generated a dataset through a semiformal EKE approach to eliciting probability distributions, based on the Sheffield method (EFSA, 2014, 2018). The EKE protocol, the specific questions to be elicited, their metrics, scales and units were carefully planned according to the conceptual framework presented in Table 1. The EKE procedure involved one expert (with knowledge on honey bees and beekeeping) and one elicitor (with expertise in per-forming EKE). A specific training was provided to the expert about the EKE methodology. The expert was asked to provide the uncertainty distributions related to the indicators of QUE, IHP, CON, DEM and BEH. The expert also provided the probability of occurrence of each scenario. To generate the simulated dataset, we used an iterative procedure. We extracted 1000 random numbers from a uniform distribution [0, 1] and we used the inverse function of each probability distribution provided by the expert to obtain the values of the corresponding quantiles. Each
Fig. 1. Model path representing the relationships between constructs (external
drivers and colony) and the HSI.
scenario was proportionally represented according to the probability of occurrence estimated by the expert. The result of the EKE procedure is presented inAppendix C (Section A.3).
3. Results
3.1. HSI model results
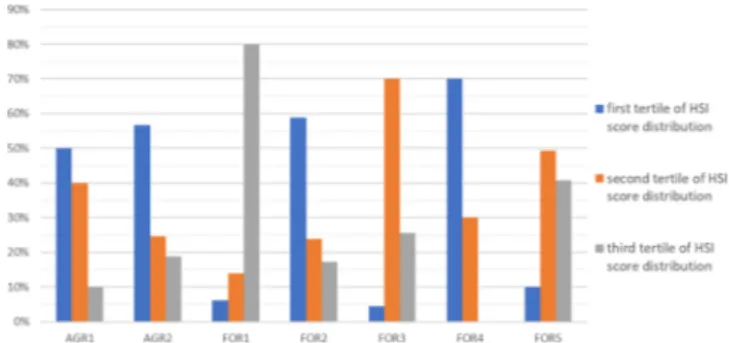
The HSI model was fitted to the data generated through the EKE procedure. The modelling approach was able to discriminate the health status of the honey bee colonies according to the characteristics of each scenario. To compare the estimations of the HSI scores among the seven scenarios, several approaches are available, among the simplest are the boxplot of the HSI distributions for each scenario (Fig. 4) and com-parison of tertile of the HSI score distribution computed on the entire dataset (Fig. 5). In our simulation, the highest median value of the HSI distribution was reached by the FOR1 scenario, characterized by high RPU and low DII. On the other hand, the FOR4 scenario showed the lowest HSI median value in agreement with the medium RPU and the high DII. The comparison of the tertiles of the HSI scores distribution among the seven scenarios confirmed these results (Fig. 5). The 80% of the estimated HSI scores related to FOR1 were in the third tertile of the HSI score distribution, while the 70% of the estimated HSI scores re-lated to FOR4 were in the first tertile. Furthermore, the HSI scores allow to order and compare honey bee colonies according to their estimated health status. Model outputs (in terms of sign and statistical significance of the coefficient estimates) are graphically showed in Fig. 6 (outer
Fig. 3. HSI outer model.
Fig. 4. Boxplot representing the distribution of the estimated HSI scores for the
investigated scenarios.
3.1.1. Outer model results
The loadings estimations (Fig. 6) confirmed the structure of the outer model defined. Loadings were consistent by sign and statistically significant for all indicators, excluding those associated to ENV. Fur-thermore, all the indicators were positively associated with their re-spective latent variables (green arrows), with the exception of the group of indicators referred to DII when directly associated with HSI. Tem-perature-related indicators also showed a negative association with ENV, but the estimations of their coefficients were not statistically significant (dashed arrows).
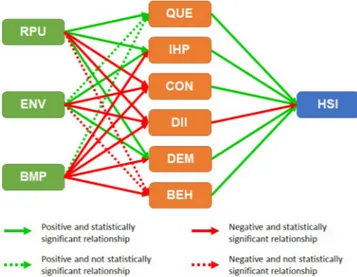
3.1.2. Inner model results
The sign (positive or negative) and the statistical significance of the estimates for the inner model are showed inFig. 7. RPU positively in-fluenced the scores of QUE, IHP and DEM, and negatively inin-fluenced the scores of CON and DII. The estimate of the path coefficient of RPU on BEH was not statistically significant. Estimates of BMP path coeffi-cients were all negative, apart from that on QUE, which however was not statistically significant. ENV was positively related to IHP and DEM and negatively related to CON and DII. The estimates of path coeffi-cients linking ENV to QUE and BEH were not statistically significant. All the latent variables of colony attributes were positively related to HSI, with the exception of DII that presented a negative (and significant) path coefficient estimation.
Fig. 6. Results of the HSI outer model. Green arrows indicate positive loadings, red arrows represent negative loadings, continuous arrows indicate a statistically
significant coefficient estimates (p < 0.05). Dashed arrows indicate estimates not statistically significant. (For interpretation of the references to colour in this figure legend, the reader is referred to the web version of this article.)
Fig. 7. Results of the HSI inner model. Green arrows indicate positive relations
(directly proportional relationships) between latent variables, while red arrows indicate negative relations (inversely proportional relationships) between latent variables. Continuous arrows indicate statistically significant coefficient esti-mates (p < 0.05), dashed arrows indicate estiesti-mates not statistically significant. (For interpretation of the references to colour in this figure legend, the reader is referred to the web version of this article.)
4. Conclusions
The main purpose of this study was to develop and test a Health Status Index (HSI) to quantify the health status of honey bee colonies considering the influence of multiple drivers/stressors. The results of our analysis, confirmed the validity of the proposed conceptual model. The selected attributes, with the exception of ENV, were positively and significantly related to the proposed sets of indicators. The HSI pro-vided good capacity to integrate different sources of data, allowing for adaptability (i.e. capacity to include different attributes and/or in-dicators). The SEM approach used to develop the HSI allows accounting for emerging evidence related to honey bee health, by adding new at-tributes and/or indicators. Our work was mainly focussed on testing the capacity of the SEM approach to represent the relationships hypothe-sised in our conceptual framework. Calibration of the model against monitoring data will allow: (i) the holistic assessment of honey bee colony health status and the estimation of risks linked to colony losses, (ii) the identification of the key drivers influencing health and the as-sessment of both the intensity and significance of their causal re-lationship, (iii) the comparative assessment of the temporal and spatial variation of honey bee colony health, (iv) the analysis of risk scenarios for the implementation of knowledge-based risk mitigation measures. Once calibrated, the proposed HSI might represent a valuable support for management decisions in the beekeeping sector for relevant stake-holders (e.g. beekeepers, risk assessors, risk managers etc.) at different spatial (from local to area-wide beekeeping) and temporal scales (medium- to long-term management decisions).
Overall, future research will focus on the investigation of the po-tential causal relationship between honey bee colony health status (estimated with HSI), colony outputs in terms of provisioning services (honey productivity, production of nuclei) and regulating services (i.e. pollination services).
Conflict of interests
None.
Acknowledgements
This research has been supported by “Fondazione Cariplo” and “Regione Lombardia” under the project: “La salute della persona: lo sviluppo e la valorizzazione della conoscenza per la prevenzione, la diagnosi precoce e le terapie personalizzate”. Grant Emblematici Maggiori 2015-1080. We kindly thank Davide Gibin and Linda Reilly for their manuscript revision and comments.
Appendix A. Supplementary data
Supplementary data to this article can be found online athttps:// doi.org/10.1016/j.ecolind.2019.01.024.
References
Aguilar, R., Ashworth, L., Galetto, L., Aizen, M.A., 2006. Plant reproductive susceptibility to habitat fragmentation: review and synthesis through a meta-analysis. Ecol. Lett. 9 (8), 968–980.
Arhonditsis, G.B., Stow, C.A., Steinberg, L.J., Kenney, M.A., Lathrop, R.C., McBride, S.J., Reckhow, K.H., 2006. Exploring ecological patterns with structural equation mod-eling and Bayesian analysis. Ecol. Model. 192 (3–4), 385–409.
Ashman, T.L., Knight, T.M., Steets, J.A., Amarasekare, P., Burd, M., Campbell, D.R., Dudash, M.R., Johnston, M.O., Mazer, S.J., Mitchell, R.J., Morgan, M.T., Wilson, W.G., 2004. Pollen limitation of plant reproduction: ecological and evolutionary causes and consequences. Ecology 85 (9), 2408–2421.
Becher, M.A., Osborne, J.L., Thorbek, P., Kennedy, P.J., Grimm, V., 2013. Towards a systems approach for understanding honeybee decline: a stocktaking and synthesis of existing models. J. Appl. Ecol. 50 (4), 868–880.
Bollen, K.A., 1989. Structural Equations with Latent Variables. Wiley.
Bommarco, R., Marini, L., Vaissière, B.E., 2012. Insect pollination enhances seed yield,
Bommarco, R., Kleijn, D., Potts, S.G., 2013. Ecological intensification: harnessing eco-system services for food security. Trends Ecol. Evol. 28 (4), 230–238.
Boniface, D.R., Tefft, M.E., 1997. The application of structural equation modelling to the construction of an index for the measurement of health-related behaviours. J. R. Stat. Soc.: Ser. D (The Statistician) 46 (4), 505–514.
Bradbear, N., 2009. Bees and their role in forest livelihoods: a guide to the services provided by bees and the sustainable harvesting, processing and marketing of their products. Non-wood For. Prod. 19.
Brodschneider, R., Gray, A., van der Zee, R., Adjlane, N., Brusbardis, V., Charrière, J.D., Chlebo, R., Coffey, M.F., Chrailsheim, K., Dahle, B., Danihlík, J., Danneels, E., de Graaf, D.C., Dražić, M.M., Fedoriak, M., Forsythe, I., Golubovski, M., Gregorc, A., Grzęda, U., Hubbuck, I., Tunca, R.İ., Kauko, L., Kilpinen, O., Kretavicius, J., Kristiansen, P., Martikkala, M., Martín-Hernández, R., Mutinelli, F., Peterson, M., Otten, C., Ozkirim, A., Raudmets, A., Simon-Delso, N., Soroker, V., Topolska, G., Vallon, J., Vejsnæs, F., Woehl, S., 2016. Preliminary analysis of loss rates of honey bee colonies during winter 2015/16 from the COLOSS survey. J. Apic. Res. 55 (5), 375–378.
Cheung, M.W.L., Hong, R.Y., 2017. Applications of meta-analytic structural equation modelling in health psychology: examples, issues, and recommendations. Health Psychol. Rev. 11 (3), 265–279.
Deloitte (2013). European Commission DG Agriculture and Rural Development. Evaluation of Measures for the Apicultural Sector.
Doublet, V., Labarussias, M., de Miranda, J.R., Moritz, R.F., Paxton, R.J., 2015. Bees under stress: sublethal doses of a neonicotinoid pesticide and pathogens interact to elevate honey bee mortality across the life cycle. Environ. Microbiol. 17 (4), 969–983.
EEA (European Environmental Agency) (2014). Technical report on CLC2006 technical guidelines.
EFSA (European Food Safety Authority), 2014. Guidance on expert knowledge elicitation in food and feed safety risk assessment. EFSA J. 12 (6), 3734.
EFSA (European Food Safety Authority), 2018. Guidance on uncertainty analysis in sci-entific assessments. EFSA J. 16 (1), 5123.
EFSA AHAW Panel (EFSA Panel on Animal Health and Welfare), 2016. Scientific opinion on assessing the health status of managed honeybee colonies (HEALTHY-B): a toolbox to facilitate harmonised data collection. EFSA J. 14 (10), 4578.
Eldridge, R.C., Flanders, W.D., Bostick, R.M., Fedirko, V., Gross, M., Thyagarajan, B., Goodman, M., 2017. Using multiple biomarkers and determinants to obtain a better measurement of oxidative stress: a latent variable structural equation model ap-proach. Biomarkers 22 (6), 517–524.
Formato, G., Smulders, F.J., 2011. Risk management in primary apicultural production. Part 1: bee health and disease prevention and associated best practices. Veterinary Q. 31 (1), 29–47.
Genersch, E., Von Der Ohe, W., Kaatz, H., Schroeder, A., Otten, C., Büchler, R., Berg, S., Ritter, W., Mühlen, W., Gisder, S., Meixner, M., Liebig, G., Rosenkranz, P., 2010. The German bee monitoring project: a long term study to understand periodically high winter losses of honey bee colonies. Apidologie 41 (3), 332–352.
Goulson, D., Nicholls, E., Botías, C., Rotheray, E.L., 2015. Bee declines driven by com-bined stress from parasites, pesticides, and lack of flowers. Science 347 (6229), 1255957.
Guo, B., Perron, B.E., Gillespie, D.F., 2008. A systematic review of structural equation modelling in social work research. Br. J. Social Work 39 (8), 1556–1574.
Iriondo, J.M., Albert, M.J., Escudero, A., 2003. Structural equation modelling: an alter-native for assessing causal relationships in threatened plant populations. Biol. Conserv. 113 (3), 367–377.
Jacques, A., Laurent Epilobee Consortium, M., Ribière-Chabert, M., Saussac, M., Bougeard, S., Budge, G.E., Hendrikx, P., Chauzat, M.-P., 2017. A pan-European epi-demiological study reveals honey bee colony survival depends on beekeeper educa-tion and disease control. PloS One 12 (3), e0172591.
Klein, A.M., Vaissiere, B.E., Cane, J.H., Steffan-Dewenter, I., Cunningham, S.A., Kremen, C., Tscharntke, T., 2007. Importance of pollinators in changing landscapes for world crops. Proc. R. Soc. London B: Biol. Sci. 274 (1608), 303–313.
Kottek, M., Grieser, J., Beck, C., Rudolf, B., Rubel, F., 2006. World map of the Köppen-Geiger climate classification updated. Meteorologische Zeitschrift 15 (3), 259–263.
Lee, K.V., Steinhauer, N., Rennich, K., Wilson, M.E., Tarpy, D.R., Caron, D.M., Rose, R., Delaplane, K.S., Lengerich, E.J., Pettis, J., Skinner, J.A., Wilkes, J.T., Sagili, R., VanEngelsdorp, D., 2015. A national survey of managed honey bee 2013–2014 an-nual colony losses in the USA. Apidologie 46 (3), 292–305.
Mizrahi, A., Lensky, Y., 2013. Bee Products : Properties, Applications, and Apitherapy. Springer Science & Business Media.
Porrini, C., Mutinelli, F., Bortolotti, L., Granato, A., Laurenson, L., Roberts, K., Gallina, A., Silvester, N., Medrzycki, P., Renzi, T., Sgolastra, F., Lodesani, M., 2016. The status of honey bee health in Italy: Results from the nationwide bee monitoring network. PLoS One 11 (5), e0155411.
Potts, S.G., Biesmeijer, J.C., Kremen, C., Neumann, P., Schweiger, O., Kunin, W.E., 2010. Global pollinator declines: trends, impacts and drivers. Trends Ecol. Evol. 25 (6), 345–353.
Rortais, A., Arnold, G., Dorne, J.L., More, S.J., Sperandio, G., Streissl, F., Szentes, C., Verdonck, F., 2017. Risk assessment of pesticides and other stressors in bees: prin-ciples, data gaps and perspectives from the European Food Safety Authority. Sci. Total Environ. 587, 524–537.
Sanchez, G., 2013. PLS path modeling with R. Trowchez Editions, Berkeley, pp. 383.
Sánchez-Bayo, F., Goulson, D., Pennacchio, F., Nazzi, F., Goka, K., Desneux, N., 2016. Are bee diseases linked to pesticides? – a brief review. Environ. Int. 89, 7–11.
Schmidt, J.O., 1997. Bee products. In: Bee Products. Springer, Boston, MA, pp. 15–26.
Spearman, C., 1904. “General Intelligence,” objectively determined and measured. Am. J. Psychol. 15 (2), 201–292.
Steinhauer, N.A., Rennich, K., Wilson, M.E., Caron, D.M., Lengerich, E.J., Pettis, J.S., Rose, R., Skinner, J.A., Tarpy, D.R., Wilkes, J.T., VanEngelsdorp, D., 2014. A national survey of managed honey bee 2012–2013 annual colony losses in the USA: results from the Bee Informed Partnership. J. Apic. Res. 53 (1), 1–18.
Tenenhaus, M., Vinzi, V.E., Chatelin, Y.M., Lauro, C., 2005. PLS path modeling. Comput. Stat. Data Anal. 48 (1), 159–205.
Vanengelsdorp, D., Hayes Jr, J., Underwood, R.M., Caron, D., Pettis, J., 2011. A survey of
managed honey bee colony losses in the USA, fall 2009 to winter 2010. J. Apic. Res. 50 (1), 1–10.
Villeneuve, B., Piffady, J., Valette, L., Souchon, Y., Usseglio-Polatera, P., 2018. Direct and indirect effects of multiple stressors on stream invertebrates across watershed, reach and site scales: a structural equation modelling better informing on hydro-morphological impacts. Sci. Total Environ. 612, 660–671.
Vinzi, V.E., Trinchera, L., Amato, S., 2010. PLS path modeling: from foundations to recent developments and open issues for model assessment and improvement. In: Handbook of Partial Least Squares. Springer, Berlin, Heidelberg, pp. 47–82.