See discussions, stats, and author profiles for this publication at: https://www.researchgate.net/publication/326166771
EARLY MOTOR UNIT CONDUCTION VELOCITY CHANGES TO HIIT VERSUS CONTINOUS TRAINING
Article in Medicine & Science in Sports & Exercise · June 2018 DOI: 10.1249/MSS.0000000000001705 CITATIONS 0 READS 189 5 authors, including:
Some of the authors of this publication are also working on these related projects:
Tremor managementView project
NeuroN : Neurophysiological biomarkers of cortical plasticity induced by neuromodulation View project Eduardo Martinez-Valdes University of Birmingham 23PUBLICATIONS 85CITATIONS SEE PROFILE Dario Farina Universitätsmedizin Göttingen 718PUBLICATIONS 18,626CITATIONS SEE PROFILE Francesco Negro
Università degli Studi di Brescia
82PUBLICATIONS 1,143CITATIONS
SEE PROFILE
Alessandro Del Vecchio
Imperial College London
12PUBLICATIONS 26CITATIONS
SEE PROFILE
All content following this page was uploaded by Eduardo Martinez-Valdes on 11 September 2018.
EARLY MOTOR UNIT CONDUCTION VELOCITY CHANGES TO HIIT VERSUS CONTINOUS TRAINING
Eduardo Martinez-Valdes1, 2,3, Dario Farina4, Francesco Negro5, Alessandro Del Vecchio4
and Deborah Falla1
1- Centre of Precision Rehabilitation for Spinal Pain (CPR Spine), School of Sport, Exercise and Rehabilitation Sciences, College of Life and Environmental
Sciences, University of Birmingham, Birmingham, UK
2- Centro de Investigación en Fisiología del Ejercicio-CIFE, Facultad de Ciencias, Universidad Mayor, Santiago, Chile
3- Department of Sports Medicine and Sports Orthopaedics, University of Potsdam, Potsdam, Germany
4- Department of Bioengineering, Imperial College London, Royal School of Mines, London, UK
5- Department of Clinical and Experimental Sciences, Università degli Studi di Brescia, Brescia, Italy
Corresponding author Deborah Falla
Centre of Precision Rehabilitation for Spinal Pain (CPR Spine), School of Sport, Exercise and Rehabilitation Sciences, College of Life and Environmental Sciences, University of Birmingham, Birmingham, UK
ABSTRACT
Purpose: Moderate-intensity continuous training (MICT) and high-intensity interval training (HIIT) are associated with different adjustments in motor output. Changes in motor unit (MU) peripheral properties may contribute to these adjustments, but this is yet to be elucidated. This study evaluated early changes in MU conduction velocity (MUCV) and MU action potential (MUAP) amplitude following two weeks of either HIIT or MICT. Methods: Sixteen men were assigned to either an MICT or HIIT group (n=8 each), and participated in six training sessions over 14 days. HIIT: 8-12×60-s intervals at 100% peak power output. MICT: 90-120min continuous cycling at ~65% VO2peak. Pre and post intervention, participants performed maximal voluntary contractions (MVC) and submaximal (10, 30, 50 and 70% of MVC) isometric knee extensions while high-density electromyography (HDEMG) was recorded from the vastus medialis (VM) and vastus lateralis (VL) muscles. The HDEMG was decomposed into individual MUs by convolutive blind-source separation and tracked pre-and post-intervention. Results: Both training interventions induced changes in MUCV, but these changes depended on the type of training (p<0.001). The HIIT group showed higher values of MUCV following training at all torque levels (p<0.05), MICT only displayed changes in MUCV at low torque levels (10-30% MVC, p<0.002). There were no changes in MUAP amplitude for either group (p=0.2). Conclusions: Two weeks of HIIT or MICT elicit differential changes in MUCV, likely due to the contrasting load and volume used in such training regimes. This new knowledge on the neuromuscular adaptations to training has implications for exercise prescription.
Key words
Motor unit; conduction velocity; amplitude; action potential; high-intensity interval training; endurance training
INTRODUCTION
Physical inactivity is a major health concern since it can lead to the development of several metabolic, musculoskeletal and cardiorespiratory diseases (1). Moderate-intensity continuous training (MICT) is regarded as one of the best forms of training to prevent illnesses related to physical inactivity (e.g., diabetes). However, not many people engage in such training typically because it requires a large volume of exercise to be performed in order to induce any significant physiological adaptation (1). In an attempt to reduce the time commitment required to exercise, high-intensity interval training (HIIT) was introduced. This type of exercise consists of short and high-intensity bursts of physical activity (i.e., intensities above the lactate threshold or >90% of heart rate) interspersed by a period of active or passive rest (2).
Despite differences in load, volume and time-commitment, several studies reported similar changes in aerobic metabolism, cardiorespiratory fitness and performance following either MICT or HIIT (2-6). Nevertheless, recent research revealed that HIIT and MICT training induce different neuromuscular adaptations. Two weeks of HIIT was shown to increase peak knee extension torque, which was associated with increased vasti muscle activation and motor unit discharge rates at high torque levels [50 and 70% of the maximum voluntary contraction torque (MVC)] while MICT training did not influence peak torque, the level of vasti muscle activity or motor unit discharge rates (7).
Both neural and structural factors are the main determinants for an increase in muscle force production following strength (resistance) training (8-10). However, changes in muscle morphology usually take several weeks to influence muscle force (9, 11), and consequently, early changes in muscle strength are usually attributed to neural adaptations (8-11). Neural adjustments associated with increased muscle strength can be due to both central (from the neuromuscular junction to the brain cortex) and peripheral adaptations (from the neuromuscular junction to the muscle cell) (12). Evaluating adaptations in motor unit properties provides direct insight into both central and peripheral adaptations. For instance, central adaptations in motor unit behavior may include changes in motor unit discharge rate, discharge rate variability and/or motor unit recruitment (8), whereas peripheral adaptations are related to changes in the velocity of propagation of motor unit action potentials (MUAP) across the muscle fibers (muscle fiber conduction velocity, MFCV) as well as changes in MUAP morphology (13, 14). MFCV can be quantified by a group of surface (i.e., array of at least 4 electrodes placed parallel to the muscle fibers) or intramuscular (one monopolar needle and one surface electrode serving as an anode) EMG electrodes by dividing the distance between the electrodes and the time of propagation of the MUAP for that distance (15, 16). Most studies analysing MFCV have calculated conduction velocity directly from the interferential EMG, obtaining an “average value” of MFCV from the many active muscle unit’s (group of fibers innervated by the motoneuron) fascicles during a contraction. More recent studies have been able to quantify MFCV from single muscle fibers providing detailed minimum, maximum and average values of MFCV for type I and type II fibers separately (16), however, as this method isolates muscle fibers from their motoneurons (fibers are electrically stimulated), it does not provide information about motor unit peripheral properties. The development of new techniques of surface
EMG decomposition, allows conduction velocity to be calculated from the MUAPs of each muscle unit fascicles (17, 18), providing accurate values of motor unit conduction velocity (MUCV) during voluntary contractions. With this method it is now possible to distinguish differences between diverse populations of single motor units (i.e., low threshold and high threshold motor units), unlike methods analysing MFCV from the interferential EMG.
In one of the few training studies where MUCV was quantified, MUCV increased after 6 weeks of END and resistance training in low threshold motor units (10 and 30% MVC) (14). Another study using global conduction velocity measurements (MFCV) also found a significant increase in MFCV after 6 weeks of concentric and eccentric resistance training (19). More recently, Methenitis et al. showed that MFCV of resistance-trained individuals was greater than that of endurance athletes, demonstrating that MFCV-related adaptations are training-specific (16). Potential mechanisms for an increase in conduction velocity after training protocols enhancing strength can include an increase in motor unit/muscle fiber recruitment, increase in muscle fiber size, increase in proportion of type II fibers (particularly type IIx which have the highest conduction velocities) and changes in the polarization state of the sarcolemma (i.e. enhanced sodium-potassium pump activity) (14, 16, 19, 20). According to the size principle (21), high intensity contractions induce greater recruitment of motor units compared to low intensity contractions, and therefore activate higher threshold motoneurons, which usually innervate muscle fibers of larger diameter with high conduction velocities (8). It is possible that HIIT activated a larger group of motor units (from low to high threshold), influencing the muscle fiber membrane properties of the muscle units (MUCV) to a greater extent than MICT. This however, has never been investigated. Previous studies suggested that changes in MUAP amplitude can be related to changes in muscle fiber size and morphology (22). Since recent advances in
high-density surface EMG (HDEMG) techniques allow motor units to be tracked longitudinally (18), we investigated whether HIIT or END induced changes in MUAP amplitude from a sample of identified motor units was related to changes in MUAP size. Furthermore, we assessed whether changes in MUCV influence MUAP amplitude.
Therefore, the aim of this study was to assess early adjustments of motor unit peripheral properties (MUCV) and MUAP amplitude [MUAP root mean square (MURMS)] following 2-weeks of HIIT or MICT using motor unit decomposition and tracking from HDEMG (18). Since it is possible to relate neural and muscular properties with the decomposition of large populations of motor units (20), here we assess MUCV and its association between the recruitment threshold of motor units following a training intervention. It was hypothesized that HIIT and MICT would induce different changes in MUCV behavior which would reflect the differing changes in motor output. Moreover, we hypothesized that tracked motor units would not show any change in MUAP amplitude, confirming that early changes in MUCV are not due to changes in muscle morphology, but due to changes in the muscle fiber membrane.
METHODS
In the present study we focused on examining changes in peripheral motor unit properties (MUCV) and motor unit action potential amplitude, following HIIT and END. The participants analyzed here were the same as our previous publication which focused on investigating changes in central motor unit properties (discharge rate, discharge rate variability and recruitment threshold) following these diverse training interventions (7). Therefore, eighteen healthy, recreationally active men (mean (SD) age:
29 (3) years, height: 178 (6) cm, mass: 79 (9) kg) took part in the study. All participants practiced some form of exercise at least two to three times per week (e.g. basketball, running, etc.). None of the subjects were engaged in regular training for a sports club and did not compete professionally. Moreover none had previous experience with HIIT or MICT. Exclusion criteria included any neuromuscular and/or musculoskeletal disorder as well as any current or previous history of knee pain and age < 18 or > 35 years. Participants were asked to avoid any strenuous activity 24 h prior to the measurements. The 18 participants were randomized into two groups (using http://www.randomization.com). Therefore, nine subjects were assigned to the HIIT group and the other nine to the MICT group. The ethics committee of the Universität Potsdam approved the study (approval number 26/2015), in accordance with the declaration of Helsinki (2004). All participants gave written, informed consent.
Experimental protocol
The experimental protocol consisted of baseline measurements (i.e., isometric knee extension torque, EMG recordings, peak oxygen uptake (VO2peak) determination), a 2-week intervention of END or HIIT and post-training measurements as presented previously (7).
Baseline measurements (Torque and EMG measurements). All participants’ knee extension torque was measured in an isokinetic dynamometer (CON-TREX MJ, PHYSIOMED, Regensdorf, Switzerland). All isometric knee extensions were exerted with the knee flexed to 90°. Following placement of the surface EMG electrodes (see below), the participants performed three maximal MVCs of knee extension each over a period of 5 s, followed by submaximal isometric knee extensions at 10, 30, 50 and 70% MVC in a randomized order.
Contractions at 10-30% were sustained for 20 s, while the contractions at 50 and 70% MVC lasted 15 and 10 s respectively. In each trial, the subjects received visual feedback of the torque applied by the leg to the dynamometer. Further details about the procedures can be found in (7).
Then, 24 h after these measurements, all participants performed an incremental test to exhaustion on an electronically braked cycle ergometer (Lode Excalibur Sport V2.0, Groningen, the Netherlands) to determine the VO2peak and the peak power output as presented previously (7). Briefly, the test consisted in a 3-min warm-up at 30 W, followed by a workload increase of 6 W every 12 s until volitional exhaustion. Revolutions per minute were kept between 80 and 90 for both the incremental exercise test as well as for the training sessions (for HIIT and MICT).
Training Protocols. Two training protocols that have shown similar improvements in cardio-respiratory fitness (VO2peak) and aerobic capacity, despite differences in total training volume and intensity were used (3, 5). Each training protocol started 72 h after the incremental test and consisted of six training sessions performed over 14 days. Sessions were programmed on Mondays, Wednesdays, and Fridays. All training sessions were supervised by an investigator of the study (E. M-V). MICT consisted of 90-120 min of continuous cycling at 65% of VO2peak as described previously (3, 6). Exercise duration increased from 90 min during sessions 1 and 2 to 105 min during sessions 3 and 4, and finally to 120 min during sessions 5 and 6. The HIIT training consisted of 60-s bouts of high-intensity cycling at 100% peak power output as described elsewhere (5). Each of the bouts was interspersed by 75 s of cycling at 30 W for recovery. The subjects completed 8 high-intensity intervals during sessions 1 and 2, 10 intervals during sessions 3 and 4, and 12 intervals on the final two sessions. 3 min of warm-up (30 W) were performed each session
prior to training. The rating of perceived exertion (RPE) and heart rate (heart rate monitor, Polar RS800, Kempele, Finland) were monitored continuously during each training session. The average training intensity for the MICT and HIIT groups were 164.5 ± 19.5 W and 334.8. ± 57.9 W, respectively. The maximum RPE averaged across training sessions was 13.8 ± 2.6 and 19.2 ± 0.6, for the MICT and HIIT groups respectively (p<0.0001). Finally, maximum heart rate during training was 156.6 ± 7.0 bpm for the MICT group and 182.6 ± 11.4 bpm for the HIIT group (p<0.0001).
Post-training measurements. Post-training measurements were performed 72 h after the training ended and were identical to the pre-training procedures (torque, EMG recordings and incremental test).
Data Acquisition
EMG signals were acquired from the vastus medialis (VM) and vastus lateralis (VL) muscles during submaximal isometric contractions. The signals were recorded in monopolar derivation with a two-dimensional (2D) multi-channel adhesive electrode grid (SPES Medica, Salerno, Italy) of 13 × 5 equally spaced electrodes (1 mm diameter, inter-electrode distance of 8 mm), with one inter-electrode absent from the upper right corner. The electrode grids were positioned as described in previous studies (7, 18, 23). The skin was prepared (shaving, abrasion and water) and the electrode cavities of the grids were filled with conductive paste (SPES Medica, Salerno, Italy). The grids were finally positioned between the proximal and distal tendons of the VL and VM muscles with the electrode columns (13 electrodes) oriented along the muscle fibers. Reference electrodes were placed over the malleoli and patella of the dominant leg. A surgical pen was used to mark the location of the electrodes on the skin of the participants, and the participants were
instructed to re-mark the electrode locations daily. Additionally, the position of the electrodes was further reported on a transparent sheet by using anatomical landmarks to ensure similar electrode placement for the post-training measures.
Torque and EMG signals were sampled at 2048 Hz, converted to digital data by a 12-bit analogue to digital converter (EMG-USB 2, 256-channel EMG amplifier, OT Bioelettronica, Torino, Italy, 3dB, bandwidth 10-500 Hz). EMG signals were amplified by a factor of 2000, 1000, 500 and 500 for the 10, 30, 50 and 70% MVC contractions, respectively. Data were stored on a computer hard disk and analyzed in Matlab offline (The Mathworks Inc., Natick, Massachusetts, USA). Finally, before decomposition, the 64-monopolar EMG channels were re-referenced offline to form 59 bi-polar channels using the difference between the adjacent electrodes in the direction of the muscle fibers.
Signal analysis
Motor unit analysis. The EMG signals recorded during the submaximal isometric contractions (from 10 to 70% MVC) were decomposed offline with an extensively validated method (24), which has high reliability and sensitivity to monitor changes in motor unit behavior and properties following training interventions (18, 23). The decomposition accuracy was estimated with the silhouette measure (SIL) and was set at 0.90 (24). Therefore, only motor units which had a SIL>0.90 were included in the analysis. Multichannel motor unit action potential (MUAP) waveforms from double differential EMG signals were obtained by spike triggered averaging the identified discharge patterns (25). A window of 15ms (duration of the MUAP) was used for the average of the surface HDEMG signals (17, 20). The first 50 discharges of each identified motor unit (starting from the first action potential) were used for the conduction velocity average. This number of firings minimize the effects of inter-spike interval variations on the estimated conduction
velocity (17, 20). A custom MATLAB (Mathworks, Natic, MA) script was used to visually display the MUAPs. A minimum of three to a maximum of nine double-differential channels were manually selected for the estimation of the motor unit root mean square (MURMS) amplitude and conduction velocity (MUCV) of each individual motor unit. Manual selection was chosen because it provided the most accurate approach to identify the channels for MUCV and MURMS estimation (17, 18, 20). Channels that had the clearest propagation of the MUAP, with the highest amplitude in the columns of the grid and a cross correlation coefficient between channels >= 0.9, were selected for further analysis. For each motor unit, the recruitment threshold (the torque at which each motor unit started firing action potentials, expressed as %MVC or Nm torque), MUCV, and MURMS were calculated.
Motor unit tracking. A recently reported method was used to track motor units pre and post intervention (18). This method is an extension of the convolutive blind source separation technique described by Negro et al. (24) and extracted motor units with MUAP shapes maximally similar across sessions. After the full blind HDEMG decomposition was performed on the pre-intervention session, a semi-blind separation procedure was applied on the post-training session, focusing on finding only the sources that had MUAP profiles similar to the ones extracted from the pre-intervention session. The normalized cross-correlation between the MUAP profiles was used as a measure of similarity. For each motor unit identified on the baseline session, a semi-blind algorithm was applied on the post-intervention trial until a motor unit with normalized cross-correlation >0.8 was found. The algorithm maximized the probability to find the matched motor units across trials separated by several days. For the tracked motor units, the same channels that were selected for computing MUCV and MURMS on the pre-intervention session were used on the
post-intervention session, to maximize the repeatability of the results. Figure 1 depicts the MUCV/MURMS calculation (Figure 1a) and tracking procedure (Figure 1b). Figure 1a: Vastus medialis motor unit spike trains (50 motor unit firings) obtained from a motor unit which was recruited at 50% MVC were used to trigger HDEMG signals (64 channels). Three monopolar EMG signals from the lower left bottom of the grid are presented as a graphical example (Figure 1a, upper right). Double-differential spike triggered averaged (STA) MUAPs of the motor unit muscle unit (fibers which are innervated by the motoneuron) show propagation of MUAPs from proximal to distal (dashed arrows). The
innervation zone can be seen on the 8th row of the electrode grid. Channels inside the circle
were chosen for MUCV and MURMS calculation. Figure 1b: representative example of the motor unit tracking procedure for VM motor units from one participant in the HIIT group (Figure 1b left) and another participant in the MICT group (Figure 1b right) during a contraction at 70% MVC (recruitment thresholds of these units was ~40% MVC). MUAPs from tracked motor units’ pre and post intervention were matched by cross-correlation (cross-correlation coefficient, CCC) to confirm a correct tracking. The same seven double differential EMG channels were used to calculate MURMS and MUCV for the HIIT motor unit (MUAPs inside rectangle Figure 1b left) and six double differential channels were used to calculate MURMS and MUCV for the MICT motor units (MUAPs inside rectangle Figure 1b right). Since MUCV and MURMS have been previously used as parameters to infer motor unit recruitment (17, 26), we analyzed both the full population of identified motor units (sample of motor units including both matched and unmatched across sessions), to check if any change in MUCV and MURMS was due to modifications in motor unit recruitment or intrinsic changes in motor unit peripheral properties, or both. For this purpose, we also compared the recruitment thresholds from all the identified motor units (in
% MVC torque) as well as the tracked motor units (in Nm torque), to account for the potential effect of progressive motor unit recruitment on motor unit peripheral properties.
Figure 1. Motor unit (MU) identification, MU conduction velocity (MUCV) and MU root mean square amplitude (MURMS) calculation, and MU tracking. A). Vastus medialis motor unit spike trains (50 motor unit firings) obtained from a MU which was recruited at 50% MVC (70% MVC target torque) were used to trigger HDEMG signals (64 channels). Three monopolar EMG signals from the lower left bottom of the grid are presented as a graphical example (Figure 1A, upper right). Double-differential spike triggered averaged (STA) MU action potentials (MUAPs) of the MU muscle unit (fibers which are innervated by the motoneuron) show propagation of MUAPs from proximal to distal (dashed arrows). The innervation zone can be seen on the 8th row of the electrode grid. Channels inside the circle were chosen for MUCV and MURMS calculation. B) Representative example of MURMS and MUCV calculation procedure applied to tracked motor units can be observed for vastus medialis (VM) MUs from one participant in the HIIT group (Figure 1B, left) and another participant in the END group (Figure 1B, right) during a contraction at 70% MVC. MUAPS from tracked MU’s pre (blue MUAPS) and post (red MUAPS) intervention were matched by correlation to confirm a correct tracking (Figure 1B, below). The cross-correlation coefficient (CCC) is displayed above the matched MUAPS. The same seven double differential EMG channels were used to calculate MURMS and MUCV for the HIIT MU (MUAPs inside rectangle (Figure 1B, left) and six double differential channels were used to calculate MURMS and MUCV for the END MUs (MUAPs inside rectangle, Figure 1B, right). MUCV, MURMS and recruitment threshold (% of the maximum voluntary contraction, MVC) values are displayed below the MUAPs of each identified motor unit.
Statistical Analysis
Before comparisons, all variables were tested for normality using the Shapiro-Wilk test. The assumption of sphericity was checked by Mauchley’s test and, if violated, the Greenhouse-Geisser correction was made to the degrees of freedom. Statistical significance was set at p < 0.05. Results are expressed as mean and standard deviation (±) unless stated otherwise.
The effects of HIIT and MICT on cardiorespiratory fitness, peak power output and peak torque were analyzed with two-way repeated measures analysis of variance (ANOVA) with factors, group (MICT and HIIT) and time (pre and post).
The effects of the two training programs on MUCV and MURMS were firstly assessed with linear regression by comparing the slopes and intercepts of all the identified motor units (full population, pre and post intervention), from all subjects, at all torque levels (recruitment thresholds from 0 to 70% MVC) with analysis of covariance (ANCOVA) (27). The recruitment thresholds (%MVC) of all the identified motor units was averaged for each subject at each torque level and compared pre and post intervention, with a four-way repeated measures ANOVA with factors group, time, torque (10, 30, 50 and 70% MVC) and muscle (VM and VL) in order to check if MUCV and MURMS results were influenced by the identification of different populations of MUs pre and post intervention.
Additionally, tracked motor unit results [MUCV, MURMS and recruitment threshold (Nm) were averaged for each of the subjects and compared at all target torque levels (10, 30, 50 and 70% MVC) with a four-way repeated measures ANOVA with factors group, time, muscle and torque level. Pairwise comparisons were made with the Student-Newman-Keuls post hoc test when ANOVA was significant. The partial eta-squared (ηp²)
and observed power for ANOVA was used to examine the effect size of changes in all the aforementioned parameters after the training intervention. A ηp² less than 0.06 was classified as “small”, 0.07-0.14 as “moderate”, and greater than 0.14 as “large” (7).
Finally, a post hoc power analysis was employed to determine the actual power of MUCV results (G*Power ver. 3.1.9; Frank Faul, Universitaet Kiel, Germany). According to study design [two groups (HIIT vs MICT) x two measurements (PRE and POST) x four torque levels (10, 30, 50 and 70% MC)], the number of participants, and the average of MUCV on each training group, an effect size of 0.75 was calculated, obtaining an actual power of 1.0 for the difference between groups.
RESULTS
One subject from the MICT group and one subject from the HIIT group could not complete the full training protocol and were excluded from the analysis. Results are therefore presented for 8 participants in the MICT group (age: 29 ± 2 years, height: 177 ± 6 cm, mass: 77 ± 8 kg) and 8 participants in the HIIT group (age: 29 ± 3) years, height: 177 ± 7) cm, mass: 79 ± 7 kg). There were no differences between groups for anthropometrics (P > 0.51) as well as in any of the outcome variables at baseline (P> 0.35 for all variables). Cardiorespiratory fitness and Motor output
VO2peak increased similarly following either HIIT or MICT (6.8 ± 3.9% and 5.0 ± 7.3% increase respectively) (7) (time effect: p=0.001, ηp²=0.54, observed power= 0.97). Likewise, peak power output increased similarly for HIIT and MICT (7.0 ± 3.1 % and 6.2 ± 2.8% increase respectively) (time effect: p<0.0001, ηp²= 0.87, observed power= 1.0). Despite this, there was a significant time-group interaction for peak torque (P=0.01, ηp²= 0.38, observed power = 0.79) as peak torque only increased in the HIIT group (6.7% ± 2.6% increase, p=0.01).
Motor unit decomposition and tracking
A total of 2688 and 2463 motor units with a SIL>.90 [average 0.91 ± 0.01] were
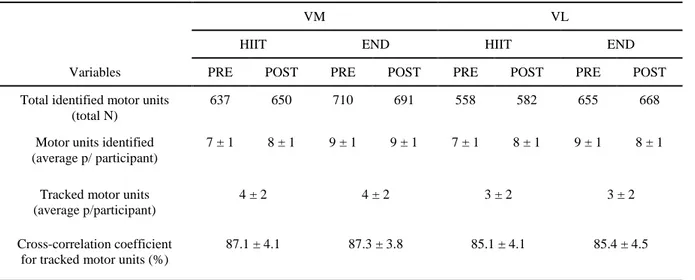
identified for the VM and VL, respectively. This number considers all 16 subjects and the motor units decomposed from both sessions (pre and post) at all target torque levels. Specific details about the number of identified and tracked motor units across sessions, trainings (HIIT or MICT) and participants (average number of identified and tracked motor units per participant) can be found in Table 1.
Table 1. identified and tracked motor units throughout the training intervention
VM VL
HIIT END HIIT END
Variables PRE POST PRE POST PRE POST PRE POST
Total identified motor units (total N)
637 650 710 691 558 582 655 668
Motor units identified (average p/ participant)
7 ± 1 8 ± 1 9 ± 1 9 ± 1 7 ± 1 8 ± 1 9 ± 1 8 ± 1
Tracked motor units (average p/participant)
4 ± 2 4 ± 2 3 ± 2 3 ± 2
Cross-correlation coefficient for tracked motor units (%)
87.1 ± 4.1 87.3 ± 3.8 85.1 ± 4.1 85.4 ± 4.5
Total and average number of motor units identified and tracked throughout the training intervention. Average motor unit results (per participant) consider all contractions [10, 30, 50 and 70% of the maximal voluntary torque MVC)] performed at pre and post training sessions (two sustained contractions per torque level, per session).
Motor Unit Conduction Velocity
The MUCV of all identified motor units increased significantly at low torque levels during both interventions; however, it only increased significantly for the HIIT group at the highest torque levels. Figure 2a shows the regression lines of MUCV from the full pool of identified motor units for VM and VL muscles in the HIIT group before and after the intervention. Figure 2b shows the regression lines of MUCV from the full pool of identified motor units for VM and VL muscles in the MICT group before and after the
intervention. The rate of change in MUCV (slope) was significantly correlated with
recruitment threshold in all conditions and muscles (p<0.0001 in all cases) with R2 values
ranging from 0.27 to 0.47 (average 0.40).
Pre and post intervention MUCV behavior from the full pool of identified motor units differed between groups as revealed by differences in linear regression analysis. In the HIIT group, the y-intercepts of MUCV for both the VM and VL muscles were significantly different after the intervention, with VM MUCV intercepts increasing from 4.15 m/s to 4.32 m/s (4.0% increase, p<0.0001, Figure 2a left) and VL MUCV intercepts increasing from 4.17 m/s to 4.27 m/s (2.3% increase, p<0.0001, Figure 2a right). Moreover, there were no changes in the rate of change of MUCV for any of the muscles following the HIIT intervention (p=0.87 for VM and p=0.97 for VL), showing that MUCV increased systematically at all the investigated torque levels.
These results contrast with those observed for the MICT group where despite an initial increase of the intercept in both the VM and VL (by 6.0 and 4.6%, respectively), MICT participants showed a significant reduction in the rate of change in MUCV after the intervention as MUCV values at the higher torques (from 40 to 70% MVC) decreased or remained similar to baseline. This reduction in MUCV ranged from 0.019 to 0.011 m/s*%MVC (42.1% decrease, p<0.0001, Figure 2b left) and 0.018 to 0.014 m/s*%MVC (38.9% decrease, p=0.001, Figure 2b right) for VM and VL, respectively. These findings can be confirmed with the results of the individual regressions where most of the participants on the HIIT group increased their intercept without changing their slopes, while on the MICT group most of the participants decreased their slopes (See Table, Supplemental Digital Content 1, Participant specific pre and post intervention MUCV linear regression analysis).
Figure 2. Motor unit conduction velocity (MUCV) regression lines [MUCV vs. recruitment threshold in percent of the maximum voluntary contraction torque (MVC)] from the full pool of identified motor units (MU) before (PRE, blue dots) and after (POST, red dots) two weeks of high-intensity interval training (HIIT, figure 2A) and moderate-intensity continuous training (MICT, figure 2B) in vastus medialis (VM, left) and vastus lateralis (VL, right). PRE intervention regression line is shown in black, while POST intervention regression line is shown in red. Regression equations, Pearson’s correlation coefficient,
p-value and coefficient of determination (R2) is displayed on the bottom right corner of each
graph.
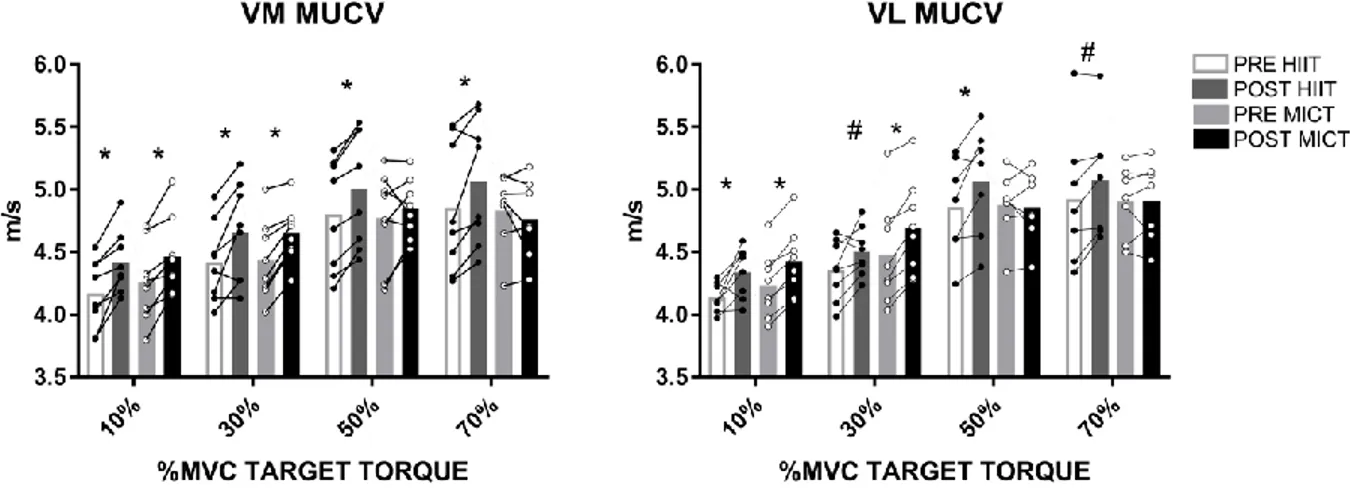
Similarly, the tracked motor units showed an increased MUCV at the lowest torque levels for both groups, but only increased significantly at the highest torques in the HIIT group. Figure 3 shows the MUCV values recorded from the tracked motor units of the VM and VL contracting at 10, 30, 50 and 70% MVC for both training groups. The results revealed that there was a significant interaction between torque, time and group (p=0.001, ηp²=0.36, observed power=0.96). Therefore, the HIIT and MICT groups showed distinct
MUCV torque-related adjustments. HIIT led to a significant increase in MUCV at all torque levels in both the VM (MUCV increased by 5.6, 5.0, 4.1 and 4.2% at 10, 30, 50 and 70% MVC, respectively, p<0.03) and VL (MUCV increased by 4.6, 3.1, 4.8 and 2.8% at 10, 30, 50 and 70% MVC, respectively, p<0.04). In contrast, the MICT group only showed a significant increase in MUCV at 10 and 30% MVC for VM (4.7 and 4.6% increase, respectively, p<0.001) and VL (4.3 and 4.7% increase, respectively, p<0.001).
Figure 3. Motor unit conduction velocity (MUCV) results from tracked motor units at 10, 30, 50 and 70% maximum voluntary contraction (MVC) target torque before and after two weeks of high-intensity interval training (HIIT, black dots) and moderate-intensity continuous training (MICT, white dots) in vastus medialis (VM, left) and vastus lateralis (VL, right). Bars represent the mean, lines represent individual values. Significant differences by pairwise comparisons, *P<0.01, #P<0.05.
MUAP amplitude
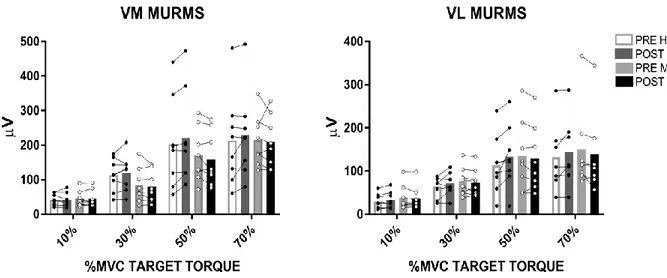
The MURMS of all identified motor units increased in both muscles for the HIIT group, but not for MICT. Figure 4a shows the regression lines of MURMS results from the full pool of identified motor units for both VM and VL for the HIIT group and Figure 4b for the MICT group. All regression lines increased significantly pre and post intervention in
from 0.37 to 0.45 (average 0.41). HIIT showed significantly higher intercepts, changing from 7.9 µV to 19.2 µV for the VM (58.9% increase, p=0.01, Figure 4a left) and 15.8 µV to 19.8 µV for the VL (20.2% increase, p=0.01, Figure 4a right), respectively. In contrast, the MICT group showed a significant decrease of the intercepts from 35.1 µV to 20.6 µV for the VM (41.3% decrease, p=0.01), with the results for VL showing no change of the intercepts (pre: 23.8 µV vs. post: 23.3 µV, p>0.11). These differences in slopes and intercepts can be explained with individual regression results where just two participants increased their intercepts for VM in the HIIT group and two participants decreased their intercepts for VM in the MICT group. Similar results were found for VL (See Table, Supplemental Digital Content 2, Participant specific pre and post intervention MURMS linear regression analysis).
Figure 4. Motor unit root mean square (MURMS) regression lines [MURMS vs. recruitment threshold in percent of the maximum voluntary contraction torque (MVC)] from the full pool of identified motor units (MU) before (PRE, blue dots) and after (POST, red dots) two weeks of high-intensity interval training (HIIT, figure 4A) and moderate-intensity continuous training (MICT, figure 4B) in vastus medialis (VM, left) and vastus lateralis (VL, right). PRE intervention regression line is shown in black, while POST intervention regression line is shown in red. Regression equations, Pearson’s correlation coefficient, p-value and coefficient of determination (R2) is displayed on the upper left corner of each graph.
In contrast, the tracked motor units MURMS did not show any change following the training intervention in both groups. Figure 5 shows MURMS results from tracked motor units. The VM muscle had higher MURMS values compared to the VL (muscle effect: p=0.004, ηp²=0.51, observed power=0.90), at all force levels in both groups. However, there were no changes in MURMS from the tracked MUs after the intervention for either group.
Recruitment threshold
The recruitment thresholds from the full pool of identified motor units was similar pre and post intervention in both training groups for VM [HIIT (mean and range) = pre: 26.1 (0.01-69.5) % vs. post: 25.7 (1.0-69.8) %, and MICT= pre: 27.0 (0.16-67.2) % vs. post: 27.6 (0.6-66.4) %] and VL [(HIIT (mean and range) = pre: 23.7 (0.2-70.6) % vs. post: 24.9 (0.02-67.2) % and MICT= pre: 27.8 (0.4-70.6) % vs. post: 26.6 (0.5-70.9) %), interaction: time-group-torque, p=0.17, ηp²=0.019. The recruitment thresholds from the tracked motor units were also similar in HIIT and MICT for VM [HIIT (mean and range) = pre: 63.0 (9.1-147.0) Nm vs. post: 65.5 (9.3-142.0) Nm and MICT = pre: 65.6 (8.3 – 155.7) Nm vs. post: 65.6 (9.1-163.0) Nm] and VL [HIIT (mean and range) = pre: 66.1 (8.4- 158.4) Nm vs. post: 65.5 (8.5-153.0) Nm and MICT = pre: 69.7 (8.0 – 183.9) Nm vs. post: 67.5 (7.9 – 183.7) Nm] and did not change after the intervention (time-group-torque interaction:, p=0.16, ηp²= 0.16).
Figure 5. Motor unit root mean square (MURMS) results from tracked motor units at 10, 30, 50 and 70% maximum voluntary contraction (MVC) target torque before and after two weeks of high-intensity interval training (HIIT, black dots) and moderate-intensity continuous training (MICT, white dots) in vastus medialis (VM, left) and vastus lateralis (VL, right). Bars represent the mean, lines represent individual values.
DISCUSSION
Two weeks of either HIIT or MICT elicited distinct early adjustments in MUCV recorded from the knee extensor muscles (VM and VL) with no changes in MURMS. MUCV adaptations between trainings were dependent on the level of voluntary torque, since HIIT induced an increase in MUCV at all torque levels, while END induced an increase in MUCV only at the lowest torque levels (10 and 30% MVC). These findings provide novel evidence that HIIT and MICT induce specific adaptations in motor unit peripheral properties, probably due to the divergent nature of both training paradigms. Motor unit conduction velocity
MICT mainly increased the conduction velocity for the low threshold motor units (10 and 30% MVC) while HIIT increased the MUCV in both low and high threshold motor units (10% to 70% MVC). These results were consistent when analyzing both the full population of motor units as well as the tracked motor units. For the full pool of motor units, when comparing the regression lines pre and post intervention, the HIIT group displayed a significant increase in the initial values of MUCV, for both VM and VL (Fig. 2a). Albeit MUCV increased systematically with voluntary force, the rate of change in MUCV was similar pre and post intervention. Similar results were observed in the tracked motor units (Fig. 3), where increases in MUCV were seen at all torque levels. In contrast to these results, the MICT group showed a significant increase in MUCV for low-threshold motor units (Figs. 2b and 3), however, this was not observed for motor units recruited at higher torques. These findings can be due to differences in load intensity and exercise volume between the training protocols, which might have induced a predominant recruitment of different populations of motor units. Due to the high intensity nature of HIIT, it is likely that the HIIT protocol was associated with recruitment of most motor units
(including high threshold) (28, 29), while the MICT protocol, which was performed for longer periods at a lower intensity, likely involved lower and middle threshold units, which are typically associated to muscle fibers that have greater aerobic capacity (e.g. most type I and some IIa fibers) (28, 29). This observation can be supported by both the RPEs and maximum heart rate between protocols, as HIIT was performed until or very close to maximal exertion (max RPE: 19-20, max heart rate 183 bpm), likely demanding high vasti-muscle activation. On the contrary, the participants performing the MICT protocol only reached moderate levels of exertion (max RPE: 13-14, max heart rate 157 bpm), possibly requiring lower activation of the knee extensors to complete the training sessions.
Previous research has also provided evidence showing that the adaptation of high-threshold motor units is load intensity dependent. For instance, Piitulainen et al. (30) reported that discharge rate of high threshold (50 and 75% MVC) motor units of the biceps bracchi increased after maximal eccentric exercise, without any observable change in the discharge rates of low threshold motor units. Moreover, Kamen and Knight (31) also observed increased VL discharge rates at 100% MVC but not at 10% or 50% MVC following 6 wk of maximal knee extension isometric training. Since the activation of high threshold motor units is important to achieve an increase in muscle strength (8), is apparent that the high loads utilized for the HIIT group were able to activate most of the pool of motor units (from low to high threshold) and thus the participants were able to increase their peak torque. Indeed, we previously observed that vasti motor unit discharge rates changed differently following HIIT and MICT, with only the HIIT group displaying higher discharge rate and HDEMG amplitude at high torque levels (50 and 70% MVC) (7). Increases in motor unit discharge rate and recruitment (number of active motor units) have been considered as one of the main neural mechanisms to increase muscle force/torque (8).
However, it is important to mention that other neural mechanisms such as increased reflex-activity and/or reduction of intracortical inhibition (10), might have also played a role in the increased peak torque after HIIT. Regarding the changes in peripheral motor unit properties observed in the present study, it would be tempting to suggest that increases in MUCV (faster propagation of MUAPS) might also be responsible for changes in muscle force/torque, however, this association has not been found in previous studies (32). Consequently is not strange to find increases in MUCV for training protocols which not induce an increase in muscle strength. For instance, the observed increase in conduction velocity at 10 and 30% MVC has also been observed previously between MICT and resistance training (13, 14), suggesting that the electrophysiological properties of the muscle membrane are likely to vary similarly among low threshold motor units, even in such divergent protocols. Nevertheless, only HIIT showed an increase in MUCV among high threshold motor units (50 and 70% MVC). A potential explanation for these differences is a differential adaptation in ionic channels (Na+ and K+) and/or Na+ -K+ pump activity in the muscle fibers of low and high threshold motor units. Ionic channels are responsible for the propagation of action potentials while the Na+ -K+ pump is responsible to restore and maintain the resting membrane potential. Previous research has shown that conduction velocity is highly sensitive to increased concentration of extracellular K+, which reduces MUAP propagation velocity (33, 34). Enhanced activity of the Na+ -K+ pump is crucial to reduce the extracellular concentration of K+. Indeed, stimulation of the Na+ -K+ -ATPase enzyme with adrenaline (catecholamine) increases the conduction velocity of muscle fibers with high extracellular levels of K+ (33). Moreover, Rongen et al. reported that conduction velocity is influenced by inhibition of the Na+ -K+ -ATPase with Ouabain (35). Taken together, the changes in MUCV observed in the present study could at
least be partly due to specific Na+ -K+ -ATPase adaptations. Various authors reported enhanced Na+ -K+ -ATPase activity after training. For instance, Green et al. (36) documented changes in Na+ -K+ -ATPase by using a similar MICT protocol to the one employed in the current study. Since Na+ -K+ -ATPase activity is also enhanced by increased aerobic capacity, it is very likely that the observed changes in low-threshold MUCV after MICT are due to changes in muscle fiber membrane properties. However, such activity was also enhanced in high threshold motor units following HIIT. A previous study comparing prolonged endurance exercise and high-intensity resistance training showed similar up-regulation in Na+ -K+ -ATPase concentration between these two training regimes, despite of their large differences in training load and volume (37). This suggests that differences in MUCV for high threshold motor units between HIIT and MICT cannot be due to different adaptations in Na+ -K+ -ATPase/ Na+ -K+ pump activity. In one of the few studies where MUCV from high-threshold motor units was quantified, Piitulainen et al. (30) was able to show specific changes in MUCV for high threshold motor units after a session of maximal eccentric exercise. The authors suggested that these high-intensity contractions were able to stimulate fast twitch fibers (which are usually found in high threshold muscle units) to a greater extent than slow twitch fibers (which are usually found in low-threshold muscle units), implying that MUCV can be related to the type of muscle fibers recruited during the exercise. Accordingly, Methenitis et al. (16) recently reported differences in MFCV between endurance, strength and power athletes, with the latter group showing the highest values of MFCV, and the endurance group showing the lowest values. Therefore, it is likely that the HIIT group induced a higher recruitment of type II fibers which are known to have higher conduction velocities (16). In the same study, the authors also showed that conduction velocity can be influenced by changes in muscle
fiber size and the % distribution of fibers (e.g. higher proportion of type IIx fibers will lead to larger conduction velocities). It could be possible that differential changes in muscle fiber size between HIIT and MICT protocols might have been responsible for the observed differences in MUCV for high threshold motor units. However, it is very unlikely for these protocols to induce any change in muscle fiber size or change in the proportion of fibers as most studies examining fiber hypertrophy usually report significant changes after a minimum of 6 weeks of resistance training (9). Another potential factor related to differences in MUCV at high torques could be discharge rate. Conduction velocity is indeed influenced by discharge rate (38). Therefore, the higher discharge rates observed for high threshold motor units might have induced an increased MUCV at higher torques for the HIIT group only. Nevertheless, the exact mechanisms by which MUCV might have increased for high threshold motor units in the HIIT group need to be investigated further. MUAP amplitude
The size of the MUAPs from the tracked motor units did not change after either intervention. This finding is expected since the tracking algorithm uses the MUAP profiles to find the same motor units longitudinally (18). Some factors that might influence MUAPs size are changes in muscle architecture and morphology. Since these training protocols were too short to induce such changes, it is very unlikely to observe changes in MUAP amplitude, even when changes in conduction velocity might have influenced the MUAP shapes to some extent (18). However, and despite these observations, we found changes in MURMS when analyzing the full population of motor units following HIIT and END training (Figs. 4a and 4b). The HIIT group showed a systematic increase in MURMS (at all torque levels) in both vasti muscles, while the MICT group either decreased MURMS systematically (VM) or it remained unchanged (VL). Previous studies suggested that motor
unit amplitude (commonly reported as peak-to-peak amplitude) could be used as a parameter to infer motor unit recruitment (39) and/or hypertrophy (22). This observation is related to the high level of correlation between surface EMG amplitude and muscle force (17). Therefore, authors assumed that increases in surface EMG amplitude were related to an increase in the MUAP size. Accordingly, we found a linear increase in MURMS, which was also observed previously in other muscles with parallel/fusiform fibers (30, 40). However, and similar to the results for MUCV, the increase in MURMS observed after HIIT cannot be related to an increase in motor unit recruitment since the recruitment thresholds of the identified units previously and after both trainings were maintained throughout the intervention. One possible explanation for the increase in MURMS can be related to the net increase in surface EMG previously observed for HIIT (7). Two weeks of HIIT increased the surface EMG amplitude (7), likely influencing the identification of motor units of larger MUAPs. Indeed, HDEMG motor unit decomposition algorithms identify the largest motor units, leaving the smallest ones as background noise (24, 41). Therefore, it is probable that, due to the increase in surface EMG after the HIIT intervention, the decomposition algorithm identified some groups of motor units with larger MUAPs but similar recruitment thresholds, influencing the results of the regression slopes for the full identified pool of motor units. In strong support of this explanation, recent research has shown that MURMS does not always relate to muscle force, since deeper motor units having a higher recruitment threshold might show smaller MUAPs (17). Moreover, amplitude estimates (from both surface EMG and motor units) can be influenced by the volume conductor effect of muscles (40) and discharge rate (15), thus increases in MUAP amplitude are not always related to the identification of larger, high-threshold motor units, but rather the identification of different motor units (of similar recruitment
thresholds) that were not detected by the recording electrodes prior the intervention. However, all these limitations can be avoided by tracking motor units, since this would minimize the effect that different populations of motor units have on MUAP amplitude parameters.
Limitations and methodological considerations
Due to limitations of both HDEMG and intramuscular EMG decomposition, it is not possible to identify the full population of active motor units during a contraction, and therefore, obtaining a large sample of motor units is crucial to make inferences about changes in motor unit behavior (18, 23). HDEMG-based motor unit decomposition methods allow a larger sample of motor units to be identified compared to previous intramuscular methods, and also allow single motor units to be tracked longitudinally (18). However, these HDEMG decomposition techniques only include information from superficial motor units and are only able to identify the most superficial fascicles of the muscle units. A combination of both HDEMG and intramuscular methods such as that described by Methenitis et al. (16) could provide a better understanding of how MUCV is distributed across different muscle regions, as present methods estimating MFCV or MUCV with HDEMG systems assume that fascicles belonging to a specific muscle unit are uniformly distributed (i.e. motor unit superficial fascicles will have the same properties as the deep fascicles).
In this study we utilized two training protocols which, despite large differences in total work, induce similar adaptations in aerobic metabolism and endurance performance. This diversity, however, elicited different neuromuscular adaptations in both the central (7) and peripheral motor unit properties as shown in the present study. It would be relevant to understand whether these differences are maintained if the HIIT and MICT protocols were
matched in terms of total work or energy expenditure, as differences in total training volume and intensity might bias results favoring one training over the other (e.g., larger adaptations for high-threshold motor units after HIIT). However, since in work-energy matched protocols the average intensity and total training time is equal, it is likely that they will induce similar changes in neuromuscular function, but this is yet to be elucidated. Another relevant consideration is the baseline training status of the participants. In the present study, we enrolled individuals which were not experienced in either MICT or HIIT, therefore, we cannot discard the possibility that the early adaptations presented herein occurred because the novice participants had not been exposed to such training previously, and were therefore, likely to show greater and more rapid changes in neuromuscular function compared to people regularly participating in such exercise. Longer intervention studies with trained individuals should be conducted to observe if the adaptations presented herein would be present and maintained. Due to the lack of studies comparing the neuromuscular adaptations of “endurance” training protocols [e.g. MICT vs. HIIT or HIIT vs. Sprint interval training (SIT)], differences in MUCV between trainings were mainly discussed based on previous studies focusing on the neuromuscular adaptations of resistance training [e.g. “endurance” vs. resistance training (14)]. It is important to mention that we do not suggest that HIIT has the same metabolic-physiological demands as resistance training, but these adaptations help to explain the neural mechanisms behind differences in strength between protocols. Further research is needed to study the main neuromuscular mechanisms responsible for changes in muscle strength between different endurance training protocols, as the physiological mechanisms leading to increases in muscle strength might differ between endurance and resistance training. Finally, it would have been interesting to add histological and molecular analyses in the present study, in
order to analyze the specific mechanisms responsible for the observed differences in MUCV. Therefore, future studies should aim to understand the cellular/molecular mechanisms behind these electrophysiological adaptations.
Conclusion
This study revealed that just two weeks of HIIT or MICT is sufficient to induce different adjustments in motor unit peripheral properties. HIIT increases MUCV from low to high threshold motor units (from 10 up to 70% MVC) whilst MICT only increased MUCV in low threshold motor units (10 and 30% MVC). These changes were not accompanied by changes in MURMS or recruitment threshold, implying that the observed motor unit adaptations were due to intrinsic changes in the muscle membrane properties. These findings are likely related to the divergent nature of both training protocols, suggesting that changes in MUCV are dependent on the load, volume and intensity of the training regime and this has important implications for exercise prescription.
Acknowledgements
Francesco Negro has received funding from the European Union’s Horizon 2020 research and innovation programme under the Marie Skłodowska-Curie grant agreement No 702491 (NeuralCon). No conflicts of interests are reported. The results of the present study do not constitute endorsement by ACSM. The authors declare that the results of the present study are presented clearly, honestly, and without fabrication, falsification, or inappropriate data manipulation.
References
1. Garber CE, Blissmer B, Deschenes MR, Franklin BA, Lamonte MJ, Lee IM, et al.
American College of Sports Medicine position stand. Quantity and quality of exercise for developing and maintaining cardiorespiratory, musculoskeletal, and neuromotor fitness in apparently healthy adults: guidance for prescribing exercise. Med Sci Sports Exerc. 2011;43(7):1334-59.
2. Gibala MJ, Little JP, Macdonald MJ, Hawley JA. Physiological adaptations to
low-volume, high-intensity interval training in health and disease. J Physiol. 2012;590(5):1077-84.
3. Gibala MJ, Little JP, van Essen M, Wilkin GP, Burgomaster KA, Safdar A, et al.
Short-term sprint interval versus traditional endurance training: similar initial adaptations in human skeletal muscle and exercise performance. J Physiol. 2006;575(Pt 3):901-11.
4. Little JP, Gillen JB, Percival ME, Safdar A, Tarnopolsky MA, Punthakee Z, et al.
Low-volume high-intensity interval training reduces hyperglycemia and increases muscle mitochondrial capacity in patients with type 2 diabetes. J Appl Physiol (1985). 2011;111(6):1554-60.
5. Little JP, Safdar A, Wilkin GP, Tarnopolsky MA, Gibala MJ. A practical model of
low-volume high-intensity interval training induces mitochondrial biogenesis in human skeletal muscle: potential mechanisms. J Physiol. 2010;588(Pt 6):1011-22.
6. McKay BR, Paterson DH, Kowalchuk JM. Effect of short-term high-intensity
interval training vs. continuous training on O2 uptake kinetics, muscle deoxygenation, and exercise performance. J Appl Physiol (1985). 2009;107(1):128-38.
7. Martinez-Valdes E, Falla D, Negro F, Mayer F, Farina D. Differential Motor Unit
Changes after Endurance or High-Intensity Interval Training. Med Sci Sports Exerc. 2017;49(6):1126-36.
8. Duchateau J, Semmler JG, Enoka RM. Training adaptations in the behavior of
human motor units. J Appl Physiol (1985). 2006;101(6):1766-75.
9. Folland JP, Williams AG. The adaptations to strength training : morphological
and neurological contributions to increased strength. Sports Med. 2007;37(2):145-68.
10. Kidgell DJ, Bonanno DR, Frazer AK, Howatson G, Pearce AJ. Corticospinal
responses following strength training: a systematic review and meta-analysis. Eur J Neurosci. 2017;46(11):2648-61.
11. Narici MV, Hoppeler H, Kayser B, Landoni L, Claassen H, Gavardi C, et al. Human
quadriceps cross-sectional area, torque and neural activation during 6 months strength training. Acta Physiol Scand. 1996;157(2):175-86.
12. Gandevia SC. Spinal and supraspinal factors in human muscle fatigue. Physiol
Rev. 2001;81(4):1725-89.
13. Vila-Cha C, Falla D, Correia MV, Farina D. Adjustments in motor unit properties
during fatiguing contractions after training. Med Sci Sports Exerc. 2012;44(4):616-24.
14. Vila-Cha C, Falla D, Farina D. Motor unit behavior during submaximal
contractions following six weeks of either endurance or strength training. J Appl Physiol (1985). 2010;109(5):1455-66.
15. Farina D, Merletti R, Enoka RM. The extraction of neural strategies from the
16. Methenitis S, Karandreas N, Spengos K, Zaras N, Stasinaki AN, Terzis G. Muscle Fiber Conduction Velocity, Muscle Fiber Composition, and Power Performance. Med Sci Sports Exerc. 2016;48(9):1761-71.
17. Del Vecchio A, Negro F, Felici F, Farina D. Associations between motor unit
action potential parameters and surface EMG features. Journal of Applied Physiology. 2017;123(4):835-43.
18. Martinez-Valdes E, Negro F, Laine CM, Falla D, Mayer F, Farina D. Tracking
motor units longitudinally across experimental sessions with high-density surface electromyography. J Physiol. 2017;595(5):1479-96.
19. Cadore EL, Gonzalez-Izal M, Pallares JG, Rodriguez-Falces J, Hakkinen K,
Kraemer WJ, et al. Muscle conduction velocity, strength, neural activity, and morphological changes after eccentric and concentric training. Scand J Med Sci Sports. 2014;24(5):e343-52.
20. Del Vecchio A, Negro F, Felici F, Farina D. Distribution of muscle fibre
conduction velocity for representative samples of motor units in the full recruitment range of the tibialis anterior muscle. Acta Physiol (Oxf). 2018;222(2).
21. Henneman E, Somjen G, Carpenter DO. Excitability and inhibitability of
motoneurons of different sizes. J Neurophysiol. 1965;28(3):599-620.
22. Pope ZK, Hester GM, Benik FM, DeFreitas JM. Action potential amplitude as a
noninvasive indicator of motor unit-specific hypertrophy. J Neurophysiol. 2016;115(5):2608-14.
23. Martinez-Valdes E, Laine CM, Falla D, Mayer F, Farina D. High-density surface
electromyography provides reliable estimates of motor unit behavior. Clin Neurophysiol. 2016;127(6):2534-41.
24. Negro F, Muceli S, Castronovo AM, Holobar A, Farina D. Multi-channel
intramuscular and surface EMG decomposition by convolutive blind source separation. J Neural Eng. 2016;13(2):026027.
25. Farina D, Arendt-Nielsen L, Merletti R, Graven-Nielsen T. Assessment of single
motor unit conduction velocity during sustained contractions of the tibialis anterior muscle with advanced spike triggered averaging. J Neurosci Methods. 2002;115(1):1-12.
26. Andreassen S, Arendt-Nielsen L. Muscle fibre conduction velocity in motor
units of the human anterior tibial muscle: a new size principle parameter. J Physiol. 1987;391:561-71.
27. Zar JH. Biostatistical analysis. 5th ed. Upper Saddle River, N.J.:
Prentice-Hall/Pearson; 2010. xiii, 944 p. p.
28. Vollestad NK, Blom PC. Effect of varying exercise intensity on glycogen
depletion in human muscle fibres. Acta Physiol Scand. 1985;125(3):395-405.
29. Gollnick PD, Piehl K, Saltin B. Selective glycogen depletion pattern in human
muscle fibres after exercise of varying intensity and at varying pedalling rates. J Physiol. 1974;241(1):45-57.
30. Piitulainen H, Holobar A, Avela J. Changes in motor unit characteristics after
eccentric elbow flexor exercise. Scand J Med Sci Sports. 2012;22(3):418-29.
31. Kamen G, Knight CA. Training-related adaptations in motor unit discharge rate
32. Farina D, Arendt-Nielsen L, Graven-Nielsen T. Spike-triggered average torque and muscle fiber conduction velocity of low-threshold motor units following submaximal endurance contractions. J Appl Physiol (1985). 2005;98(4):1495-502.
33. Kossler F, Lange F, Caffier G, Kuchler G. External potassium and action potential
propagation in rat fast and slow twitch muscles. General Physiology & Biophysics. 1991;10(5):485-98.
34. Fortune E, Lowery MM. Effect of Extracellular Potassium Accumulation on
Muscle Fiber Conduction Velocity: A Simulation Study. Annals of Biomedical Engineering. 2009;37(10):2105-17.
35. Rongen GA, van Dijk JP, van Ginneken EE, Stegeman DF, Smits P, Zwarts MJ.
Repeated ischaemic isometric exercise increases muscle fibre conduction velocity in humans: involvement of Na(+)-K(+)-ATPase. J Physiol. 2002;540(Pt 3):1071-8.
36. Green HJ, Barr DJ, Fowles JR, Sandiford SD, Ouyang J. Malleability of human
skeletal muscle Na(+)-K(+)-ATPase pump with short-term training. J Appl Physiol (1985). 2004;97(1):143-8.
37. Green H, Dahly A, Shoemaker K, Goreham C, Bombardier E, Ball-Burnett M.
Serial effects of high-resistance and prolonged endurance training on Na+-K+ pump concentration and enzymatic activities in human vastus lateralis. Acta Physiol Scand. 1999;165(2):177-84.
38. McGill KC, Lateva ZC. History dependence of human muscle-fiber conduction
velocity during voluntary isometric contractions. J Appl Physiol (1985). 2011;111(3):630-41.
39. Hu X, Rymer WZ, Suresh NL. Motor unit pool organization examined via
spike-triggered averaging of the surface electromyogram. J Neurophysiol.
2013;110(5):1205-20.
40. Martinez-Valdes E, Negro F, Falla D, De Nunzio AM, Farina D. Surface
electromyographic amplitude does not identify differences in neural drive to synergistic muscles. J Appl Physiol (1985). 2018;124(4):1071-9.
41. Holobar A, Zazula D. Multichannel blind source separation using convolution
kernel compensation. Ieee Transactions on Signal Processing. 2007;55(9):4487-96.
View publication stats View publication stats
![Figure 2. Motor unit conduction velocity (MUCV) regression lines [MUCV vs. recruitment threshold in percent of the maximum voluntary contraction torque (MVC)] from the full pool of identified motor units (MU) before (PRE, blue dots) and after](https://thumb-eu.123doks.com/thumbv2/123dokorg/5552780.65907/20.918.149.783.120.562/conduction-velocity-regression-recruitment-threshold-voluntary-contraction-identified.webp)
![Figure 4. Motor unit root mean square (MURMS) regression lines [MURMS vs. recruitment threshold in percent of the maximum voluntary contraction torque (MVC)] from the full pool of identified motor units (MU) before (PRE, blue dots) a](https://thumb-eu.123doks.com/thumbv2/123dokorg/5552780.65907/23.918.141.828.120.655/figure-regression-recruitment-threshold-percent-voluntary-contraction-identified.webp)