Research Article
Structural Improvements for Tall Buildings under Wind Loads:
Comparative Study
Nicola Longarini,
1Luigi Cabras,
2Marco Zucca,
1Suvash Chapain,
3and Aly Mousaad Aly
31Politecnico di Milano, Milan, Italy
2University of Trento, Trento, Italy
3Louisiana State University, Baton Rouge, LA, USA
Correspondence should be addressed to Aly Mousaad Aly; [email protected]
Received 27 April 2017; Revised 13 September 2017; Accepted 26 September 2017; Published 6 November 2017 Academic Editor: Evgeny Petrov
Copyright © 2017 Nicola Longarini et al. This is an open access article distributed under the Creative Commons Attribution License, which permits unrestricted use, distribution, and reproduction in any medium, provided the original work is properly cited.
The behavior of a very slender building is investigated under wind loads, to satisfy both strength and serviceability (comfort) design criteria. To evaluate the wind effects, wind tunnel testing and structural analysis were conducted, by two different procedures: (i) Pressure Integration Method (PIM), with finite element modeling, and (ii) High Frequency Force Balance (HFFB) technique. The results from both approaches are compared with those obtained from Eurocode 1 and the Italian design codes, emphasizing the need to further deepen the understanding of problems related to wind actions on such type of structure with high geometrical slenderness. In order to reduce wind induced effects, structural and damping solutions are proposed and discussed in a comparative study. These solutions include (1) height reduction, (2) steel belts, (3) tuned mass damper, (4) viscous dampers, and (5) orientation change. Each solution is studied in detail, along with its advantages and limitations, and the reductions in the design loads and structural displacements and acceleration are quantified. The study shows the potential of damping enhancement in the building to mitigate vibrations and reduce design loads and hence provide an optimal balance among resilience, serviceability, and sustainability requirements.
1. Introduction
1.1. Background. The increased population in urban societies
and the constant pressure of limited land area with expensive prices have caused the evolution of high-rise buildings. High-rise buildings may be considered as a symbol of development and civilization. From structural point of view, these are buildings of which height will be affected by lateral forces resulting from earthquake and wind loads to the extent that such forces will play a major role in the design process [1]. High-rise building construction is a challenging project undertaken by experts and engineers. To build a tall building, one should think of a construction project whose design depends totally on analytical analysis and scaled modeling.
As high-rise buildings are receiving more global emi-nence, their impact on society and economy has become pronounced worldwide. Over time, new frontiers in high-rise construction complement emerging needs for performance,
efficacy, and economic design. Designers are concerned about choosing structural systems that can carry lateral loads as well as ascertained serviceability and occupant com-fort requirements. The economic viability of tall buildings depends strongly upon serviceability and occupant comfort as prerequisites. In general, tall buildings are built to sustain extreme wind loads within an expected long lifespan. The probability of catastrophic failure is small; however, studies on wind induced motion and effects on high-rise buildings are essential from a serviceability and economic point of view. The design of buildings with a slenderness ratio (aspect ratio = height/width) greater than five is usually governed by serviceability more than safety [2]. The serviceability of tall buildings under wind is typically measured by the amount of lateral displacements and acceleration. Excessive lateral dis-placements can cause structural and nonstructural damage, while excessive acceleration can lead to unpleasantness to the building occupants [3].
Volume 2017, Article ID 2031248, 19 pages https://doi.org/10.1155/2017/2031248
An additional challenge is the uncertainty in the amount of structural damping early in the planning phase [4]. To alleviate this issue, structural control is a potential method for structural tuning and damping enhancement. The purpose of structural control in civil engineering structures is to reduce vibrations produced by external stressors such as earthquake and wind loads, by different techniques such as modifying stiffness, mass, damping, or shape. Structural control meth-ods are typically classified as active, passive, and semiactive techniques. Passive systems use supplemental devices, which respond to the vibrations of the structure by dissipating the energy triggered by strong dynamic loads, without the need for an external energy supply. A variety of passive control mechanisms have been suggested by researchers and engineers, including tuned mass dampers, viscous dampers, friction dampers, and tuned water dampers.
An external power source is needed for an active control system to control actuators that apply prescribed forces to a structure/building, to inject/dissipate energy and hence min-imize certain optimization objectives. The command signals to the actuator depend on the measured system response (feed-back control). However, active control systems can be unstable, and they need bulky power transformers and consume significant amount of energy, which may not be available, especially immediately after natural disasters, such as earthquakes and high winds. For this purpose, passive control systems remain the most reliable and practical tech-nique for structural control. Some passive control systems are presented as follows.
1.2. Tuned Mass Dampers (TMDs). A vibration absorber or a
TMD consists of spring, mass, and a damping device installed on a primary system to lessen the dynamic response. The main concept in the TMD is that the frequency of the damper is tuned to resonate out of phase with the vibration of the primary structure, leading to significant energy dissipation. Numerous studies are focused on the performance of the TMD and its capability to suppress vibrations, especially due to wind loads. The concept of vibration suppression by a TMD dates back to 1909, when the vibration absorber was invented by Farham, making it as one of the earliest control devices [5]. Following this invention, numerous studies were conducted to validate the application, as well as to enhance the performance of the device with different structural configurations. The concept of using a robust TMD was proposed recently, in which an approach was devel-oped to determine the optimal parameters under structural uncertainties. Significant reductions in the response can be realized by the optimum selection of the mass ratio and tuning frequency ratio [6]. In high-rise buildings, when the inherent sutural damping is low, the TMD is proved to be very effective in reducing the responses [7]. TMDs are used as controlling devices in high-rise buildings in Japan, Hong Kong, United States, Australia, and some other countries. The Hancock Tower in Boston 244 m, as mentioned in [8], has two TMDs installed at the opposite ends of the 58th floor with each unit weighting 300 tons. However, there are several limitations on the practical application of TMDS; for example, being tuned to a single vibrational mode is limited
to narrow band of operation frequencies [9]. The limitations of the TMD can be significant when dealing with buildings excited at higher modes of vibration, for example, under earthquake loads. Also, TMDs are sensitive to uncertainties in the structural parameters. Structural parameters may change due to damage, material degradation, or even environmental variations. Such changes can lead to a detuned TMD, with reduced effectiveness [10].
1.3. Tuned Liquid Dampers. Tuned liquid dampers (TLDs)
gained increased popularity due to their effectiveness in absorbing low-frequency vibrations induced by wind, being cost effective, requiring less maintenance, and being easily implementable [11]. TLDs are energy dissipation devices, suggested for vibration suppression under different dynamic loads. A typical TLD consists of a container with liquid/water to reduce vibrations of a primary structure. This allows sig-nificant energy dissipation and hence reduced structural responses [12]. The fundamental principle of vibration con-trol in structures using TLDs is based on sloshing and wave breaking for energy dissipation [11]. For efficient energy dissi-pation, the fundamental frequency of liquid in a TLD should be close to that of the primary structure. Several research studies have been conducted on TLDs in the past few decades. The research conducted by Bauer in 1984 [13] proposed a damping device to control vibrations, where a rectangular container filled with two immiscible liquids was utilized, in which the interface motion dissipated the energy effectively. Recently, TLDs have been shown to be effective in lateral vibration control of high-rise buildings. The Hobert Tower in Tasmania (Australia) with a height of 105 m is equipped with 80 TLDs. Similarly, in Kagawa (Japan) 16 units of TLDs are installed in the Gold Tower which has a height of 158 m. The installation of TLDs is found to suppress vibrations of buildings under wind loads by one-third to half of the original responses [8].
1.4. Viscous Dampers. Damping is an important mechanism
that dissipates energy and hence permits a structure to achieve high performance under dynamic loads such as earthquake, strong wind, or blast. Numerous fluid damping devices with practical applications have been proposed over the past few decades. The use of damping devices filled with viscoelastic liquid to dissipate energy was studied extensively, both analytically and experimentally [14]. When a VD is subjected to an external load, friction forces develop among different elements. Friction forces are developed among the molecules of the damping medium, shaft and medium, piston and medium, and so on. All these actions combine together to form a damping force which acts 90 degree out of phase with the displacement driven force in a primary structure [15, 16]. Previous uses of viscous dampers (VDs) in military applications include the attenuation of weapon grade shock, aircraft, ship vibration, and underwater detonation.
Viscous dampers that were used in military applications during the cold war have been adopted for civil engineering structural applications [17]. A number of countries are prac-ticing the use of VDs in tall building including Hong Kong, China, Japan, and United States. The Sato Building (1992)
and Shimura Dormitory (1993) in Japan are vivid examples of application [8]. These devices are of a prime interest in civil engineering because they possess certain characteristics such as (1) compactness; (2) temperature insensitivity; and (3) linear viscous response over a range of frequencies [15]. In 1991 a cooperative effort between NCEER and Taylor Devices, Inc., began to adopt this defense technology for hazard mitigation in buildings [18].
Various theoretical and experimental works are con-ducted on the effective usage of VDs in high-rise buildings. A study conducted on a 39-story building shows that the application of VDs reduced the wind induced acceleration of the building by 35% [19]. The imperial building in India (10 story) was studied, two-thirds of the energy induced by wind and small earthquakes realized to be dissipated by VDs [20]. A super tall 62-story building (Xiamen city of southeast China) with 245.75 m height was studied for wind induced response reduction by VDs; there was a significant reduction in displacement and acceleration [21].
1.5. Belt Trusses and Outriggers. In general, moment resisting
frames and shear walls are efficient and economical structural systems for low- and medium-rise buildings. But when the height of a building goes up, these systems may not be sufficient enough to resist load induced by the wind and earthquakes. Belt truss systems are effectively used to control excessive drift due to lateral loads and also to enhance the stiffness of tall buildings [22]. The outrigger and belt truss systems are dynamic load resisting systems in tall buildings where external columns control core walls with very stiff structural/mechanical elements, at one or more levels. The functional difference between belt trusses and outriggers is that belt trusses tie the peripheral columns of a building, while the later engages them with the central core. Externally induced moments are resisted by the core and axial internal loads developed in outer columns that are connected to an outrigger [23]. Belt trusses are used as “virtual outriggers” because they can transfer the load without the need for a connection between an outrigger system and the core [24]. The Plaza Rakyat Tower (located in Kuala Lumpur) employs “virtual outrigger” systems consisting of belt walls (reinforced concrete building) [8]. The challenges associated with this type of mitigation include the loss of space in build-ings, in addition to accompanying structural complexities [25].
1.6. Paper Layout. The current study addresses the
appli-cation of different response lessening mechanisms in a tall building subjected to wind loads. Five independent response reduction methods are employed to control vibrations under wind loads. Section 2 presents the design criteria set by standard codes for buildings with high slenderness ratios, concerning both strength and serviceability requirements. In Section 3, the building characteristics, wind loads, and wind tunnel experiments are presented. In Sections 4 and 5, the wind induced responses (base moments, base shear, drift, and acceleration) are evaluated using wind tunnel test data and finite element model (FEM). Specifically, Section 4 presents
the pressure integration method, whereas Section 5 intro-duces the high frequency force balance method. Section 6 focuses on the comparison of the wind induced responses obtained in Sections 4 and 5 with the design limits provided in standard codes (the Eurocode 1 (EC1) [26] and the Italian CNR DT207/2008 (CNR) code [27]). Since the response values evaluated exceeded the design limits provided by stan-dard codes, there was a need to propose structural improve-ments. Five different solutions (improvements) are presented in detail to bring those values under the prescribed limits. The improvements explained in Section 7 are height reduction, use of belt trusses, installation of dampers, and orientation change. In the first improvement, about 12.5% of the total height of the building was reduced to check its sensitivity to wind. In the second improvement, internal belt trusses are introduced at different levels, for two and four alignments along the horizontal 𝑥 axis. Again, as third and fourth improvements, installation of a TMD at the top and VDs up to the 20th floors are considered separately to investigate their effectiveness. Rotation of the building to an optimum angle for reduced wind effects is the fifth improvement. All the improvements mentioned above are studied separately, independent of each other. Finally, the conclusions drawn are summarized in Section 8.
2. Design Criteria
2.1. Resistance and Comfort Criteria. An accurate analysis
of the structural system is necessary to build a high-rise building that can withstand the complex wind loads. There are two important design criteria that should be considered while designing high-rise building, the first one is Ultimate Limit State (ULS) which deals with strength requirements of structure and the second is Serviceability Limit State (SLS) that deals with comfort of occupants in the building. The ULS criteria are employed to guarantee that the building will not fail under maximum design loads. Similarly, the SLS criteria are used to ascertain that the building will remain operational and functional by satisfying serviceability (usually comfort) conditions. Purpose of SLS requirements is to address the response of people and objects to the behavior of the structure under the load. These criteria have to be fulfilled, to yield adequate structural robustness, as well as to provide required comfort satisfaction to occupants. The comfort criterion can be fulfilled by limiting peak floor acceleration to predefined values provided in standard codes [28–32]. Moreover, considering the SLS design criterion, it is fundamental to investigate the serviceability behavior (in terms of interstory displacements) of the secondary building elements like finishes and system elements [33, 34]. Generally, the response effects of the structure (also called the stress effects) have to be evaluated and compared with the resistant effects; the stress effects are the actions on the structural elements (in terms of shear, bending, axial, and torsional stresses), in addition to the response (displacement and acceleration) of the structural primary and secondary elements. All stress effects can be evaluated by an appropriate FEM. The following are the notations that will be used in FEM model for stress effects,𝐸Sdfor the actions,𝛿Sdfor the
Table 1: Reference values of the acceleration.
Building usage Design values Notes
[m/s2] [g/1000]
Residential 0.039∼0.082 4.03∼8.43 Up to 0.049 m/s2, the motion is imperceptible Office 0.196∼0.245 20∼25
The motion is perceptible and irksomeness is subjective; up to 0.5 m/s2 serious physical problems Table 2: Resistant displacements (𝛿Sdis top displacements,𝛿Sidis inter-story displacements,𝐻 is building height, and ℎ𝑖is inter-story height).
𝛿Rdvalues 𝛿Ridvalues
𝐻/600 ≤ 𝛿Sd≤ 𝐻/500 𝛿Sid≤ ℎ𝑖/600
displacements, and𝑎Sd for the acceleration. Similarly,𝐸Rd,
𝛿Rd, and𝑎Rdare symbols for the actions, displacements, and
acceleration for the resistant effects, respectively.
The resistance effects in building can be determined by using standard codes. The international codes can be con-sulted to determine the resistant shear, the resistant bending moment, and the resistant axial load for the ULS. However, resistant displacements𝛿Rdand the resistant acceleration𝑎Rd in many cases are not specified in the codes and their values may change either for the characteristics of the finishes or for the use of the building. In most of cases, the resistant displacements𝛿Rdand in particular the resistant acceleration 𝑎Rd are not specified in standard codes and their values
may change depending on the use of the building. Thus, the valued stress effects and the resistant effects must satisfy the following relations:
𝐸Sd≤ 𝐸Rd,
𝑎Sd≤ 𝑎Rd,
𝛿Sd≤ 𝛿Rd.
(1)
The acceleration in (1) refers to the response (accelera-tion) of the building at its top, to satisfy the serviceability requirements (SLS), for 10-year return period (𝑇R= 10 years).
Comfort limits,𝑎Rd, shown in Table 1, are set to avoid health
problems like vertigos, sickness, and so on in the occupants. Moreover, the top displacements (𝛿Sd) and the interstory
displacements(𝛿Sid), calculated for the SLS, can be compared to the resistant values (𝛿Rdand𝛿Rid) shown in Table 2.
2.2. Slenderness Ratio. The aspect ratio or the slenderness
ratio can significantly govern the behavior of high-rise buildings under wind. As the building grows taller, response level to the dynamic load changes. Therefore, proportions of height and length need to be considered carefully. The wind analysis has to be even more accurate if the tall building is characterized by an unusual shape or by large geometrical slenderness(𝜆 = 𝐻/𝑙), defined by its aspect ratio (building height(𝐻)/shortest side of its plan (𝐿)). Usually up to 𝜆 ≥ 8–11
some comfort problems could exist [27], if the structure does not have enough stiffness or it is not equipped with damping devices. In fact, problems affect the comforts in everyday use in some tall buildings and numerous skyscrapers; all the levels cannot be exploited for the same intended use of the lower floors. Very often, for the presence of spire or for very spindly parts at the top, the total height reduction(Δℎtot) is observed in many constructions. The reduction of height is the difference between the top height(𝐻) and the height of the ultimate occupied floor(𝐻𝑓) having the same intended use of the lower floors. Some examples are Burj Khalifa in DubaiΔℎtot = 244.5 m (𝐻 = 829 m, 𝐻𝑓 = 584.5 m), for Willis tower in ChicagoΔℎtot = 114 m (𝐻 = 527 m, 𝐻𝑓 = 413 m), for Taipei 101 in Taiwan Δℎtot = 70 m (𝐻 = 508 m,
𝐻𝑓 = 438 m), for Trump tower in Chicago Δℎtot = 82 m
(𝐻 = 423 m, 𝐻𝑓= 341 m), and for Unicredit tower in Milan Δℎtot= 82 m (𝐻 = 231 m, 𝐻𝑓= 144 m).
Nevertheless, in order to reach symbolic constructions fame, many tall buildings have a value of 𝜆 around the mentioned limit as these are characterized by streamlined shapes with a spire at the top [35]. Among these are the St. Gilus Circus in London (𝐻 = 136.10 m, 𝑙 = 28.05 m, 𝜆 = 7.50), the Pirelli building in Milan (𝐻 = 125 m, 𝑙 = 18.70 m, 𝜆 = 6.68), the Marina City buildings in Chicago (𝐻 = 180 m, 𝑙 = 33.32 m, 𝜆 = 5.40), the Standard Bank building in Johannesburg (𝐻 = 139 m, 𝑙 = 14.17 m, 𝜆 = 9.81), the Trump Tower in NY (𝐻 = 202 m, 𝑙 = 35.04 m, 𝜆 = 5.76), and the Bond Center in Hong Kong (𝐻 = 191.50 m, 𝑙 = 32.70 m, 𝜆 = 5.85).
Furthermore, 𝜆 close to 8 represents a border between a very slender tall building and a stubby chimney (some examples of stubby chimneys in Italy are the Enel chimney in Porto Tolle (𝐻 = 243.80 m, 𝑙 = 26.01 m, 𝜆 = 9.34) and the Enel chimney in “Torre Valdaliga” (𝐻 = 243 m, 𝑙 = 28.70 m, 𝜆 = 8.47)).
In case of high geometrical slenderness𝜆 [36], the classic problems due to the wind load could add up to those caused by dynamic effects, like the galloping due to the vortex shed-ding. In tall buildings, these effects are particularly dangerous since they concern the resistance of both the main structural elements and the elements supported by the main structure (e.g., the steel connections of the facades).
3. Structural and Wind Load Modeling
3.1. Characteristics of the Building. The tall building studied
in this paper is located in north Italy and is optimized for office use. The building is characterized by a high value of slenderness𝜆. The main features of the structure are as follows:
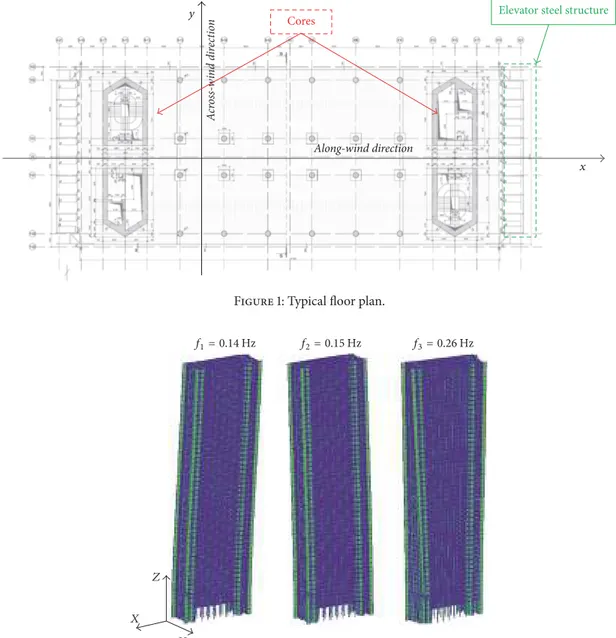
(i) Total height𝐻 = 225 m and rectangular floor plan (Figure 1) has sides𝑙1 ≅ 64 m in 𝑥-direction (along wind) and𝑙2≅ 23 m in 𝑦-direction (across wind); the geometric slenderness ratio is𝜆 ≅ 10;
(ii) Circular columns and cores of the building are made with High Strength Concrete (HSC, with 𝑅ck ≅ 75 MPa), but floor deck is made with Normal Strength
Cores Elevator steel structure x y Along-wind direction A cr oss -w in d dir ec tion
Figure 1: Typical floor plan.
Z
f1= 0.14 (T f2= 0.15 (T f3= 0.26 (T
Y X
Figure 2: First, second, and third mode shapes of the building.
Concrete (NSC, with𝑅ck ≅ 45 MPa); slab is postten-sion reinforced in the two main directions;
(iii) Slab foundation is in NSC with normal and postten-sion reinforcement in the two main directions. The wind resistant structural elements, cores of the building, are located at the opposite sides of the typical floor plan. The thickness of their walls is tapered along the vertical development of the building. Thickness, in the basement, is 1.20 m, from the ground level to the fifth floor is 1.00 m, from the fifth to the twenty-seventh floor is 0.70 m, and from the twenty-seventh to the top of the building is 0.50 m. The inner layout, optimized for the office use, shows four lines of circular columns along the longest side, two of which are located along the facades and the other two are close to the central horizontal axis of the floor plan. The structures of the elevators are made of S355 steel and structural glass; these are
joined to the main concrete structure and do not contribute with the bracing system. Figure 1 shows the floor plan.
In the FEM, the columns and the beams are represented by beam elements; the cores and the decks are represented by plates. The eigenvalue analysis is carried out to calculate the natural frequencies for the first three modes. Frequencies for I, II, and III vibration modes are𝑓I= 0.14 Hz (bending in 𝑥-axis direction),𝑓II = 0.15 Hz (bending in 𝑦-axis direction), and𝑓III = 0.26 Hz (torsional around 𝑧-axis). Figure 2 shows
the mode shapes along with the dominant structural frequen-cies.
3.2. Aerodynamic Loads. High-rise buildings are wind
sensi-tive structures so lateral wind load imposed on building is a governing factor in their structural design. Situation becomes even more complicated if the frequency of oncoming wind resonates with natural frequency of building which depends
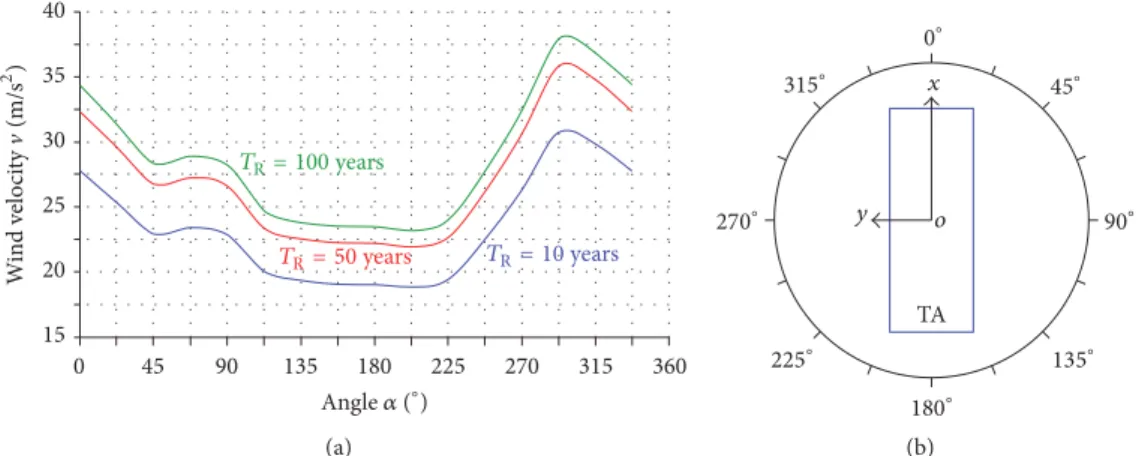
0 45 90 135 180 225 270 315 360 15 20 25 30 35 40 Angle (∘) W ind v elo ci ty (m/ M 2) T2= 100 years T2= 10 years T2= 50 years (a) o y x 0∘ 45∘ 90∘ 135∘ 180∘ 225∘ 270∘ 315∘ TA (b)
Figure 3: (a) Wind velocity as a function of the direction angle𝛼. (b) Angle 𝛼 relative to the position of the building.
on structural properties of building. Pattern in which wind flows around the building is distorted by flow separation and wakes developments. Combination of these affects results in aerodynamic pressures on the structural system that imposes fluctuating forces, and the building tends to respond in the lateral directions, as well as in torsion [37].
The response in the along-wind consists of fluctuating and mean components, and the average wind speed is usually used to directly evaluate mean load and responses based on pressure and load coefficients. The fluctuating component of response and loads depend dominantly on (1) turbu-lence intensity; (2) size reduction effects; and (3) dynamic amplification (resonance). The “gust factor” approach can be employed to predicted the along-wind response with a reasonable accuracy when the interference effects are not significant [37].
Crosswind oscillations can be excessive, if building has low damping. Cross wind excitation is closely related to “vor-tex shedding” [38]. The building acts as bluff body that sep-arates the flow from surface of structure causing asymmetric pressure distribution around the cross-section of structure. There can be a situation of resonance, if vortex shedding fre-quency and natural frefre-quency of building coincide, causing excessive oscillation in transverse direction or even failure.
Possible aerodynamic coupling in various degrees of freedom is responsible for torsional motion of building. If the resultant wind load coincides with center of mass at each floor, an eccentric loading can be expected, which excites the torsional mode of vibration. Torsional responses are sensitive to ratio of transverse to torsional frequencies [39]. Thus, it is fundamental to perform the wind tunnel test for precise evaluation of along-wind, crosswind, and torsional responses in this tall building.
3.3. Wind Tunnel Testing. It is critical to determine the
wind loads for the specific mean recurrence interval and uncertainties associated with these loads. Wind loads and loads factors are prescribed by analytical method given in codes for ordinary building. But in case of tall buildings, these methods lack precision and may not accurately account for important phenomena such as cross wind loads, aerodynamic
instability, vortex shedding, and aerodynamic interaction between adjacent building [40]. Thus, to get more precise, project specific information regarding wind loads and build-ing motion, wind tunnel simulation of a scaled model is required.
For the present case, in this tall building, the wind tunnel tests are fundamental to investigate the effects of the wind, like vortex shedding phenomenon (in relation to the dangerous structural behaviors like the galloping). For the aerodynamic tests, it is essential to obtain wind velocities in the site of construction. There are different approaches for the definition of the wind speed, which are described as fol-lows.
Approach 1. Directional velocities values are considered
based on estimated wind speed in the site.
Approach 2. Directional velocities values are considered only
when these values are higher than the velocities prescribed in the codes; otherwise velocity prescribed in the codes is considered.
Approach 3. The values are set by the codes with relation to
the buildings plan; these values are the same in the two main directions.
Particularly, in this case, “Approach 1” is followed and the site directional velocities come out from an in-depth study of the location site [41]. The different velocities are reproduced in the wind tunnel on a rigid scale models (1 : 100) [36, 42]. The tests have investigated two different layouts, with urban contest and without the urban contest. The present analysis refers to the layout “building with the urban contest,” which has given higher stress values. The maximum wind velocity comes from the north-west direction (270∘–300∘in Figure 3). For return period𝑇R = 100 years, the maximum velocity is Vmax = 38 m/s; this value is higher than the nondirectional
valueVcode= 33 m/s, indicated in the Italian code (DM 2008)
for the same𝑇R. Wind velocities as a function of the direction,
identified by the angle𝛼, are shown in Figure 3.
The forces 𝐹 and the moments 𝑀 at the base of the scale models, during the wind tests for each of the 16 wind
directions, are recorded as a function of the time. These are expressed by the following dimensionless coefficients:
𝐶𝐹𝑋= 𝐹𝑋 𝑞𝐵𝐻, 𝐶𝐹𝑌= 𝐹𝑌 𝑞𝐵𝐻, 𝐶𝐹𝑍= 𝐹𝑍 𝑞𝐵𝐻, 𝐶𝑀𝑋= 𝑀𝑋 𝑞𝐵𝐻2, 𝐶𝑀𝑌= 𝑀𝑌 𝑞𝐵𝐻2, 𝐶𝑀𝑍= 𝑀𝑍 𝑞𝐵𝐻2, (2)
where 𝑞 = 0.5 ⋅ 𝜌 ⋅ V2ref is the dynamic pressure,𝜌 is air density,Vref = V(𝑧ref) refers to the average wind speed at a reference point𝑧ref = 100 m, and 𝐵 represents the longest side (top view), of a building with the height𝐻. Time histories of pressures on the surface of the models are measured, in about 400 pressure meters (“TAPs”), for the same 16 wind directions.
4. Pressure Integration Method (PIM)
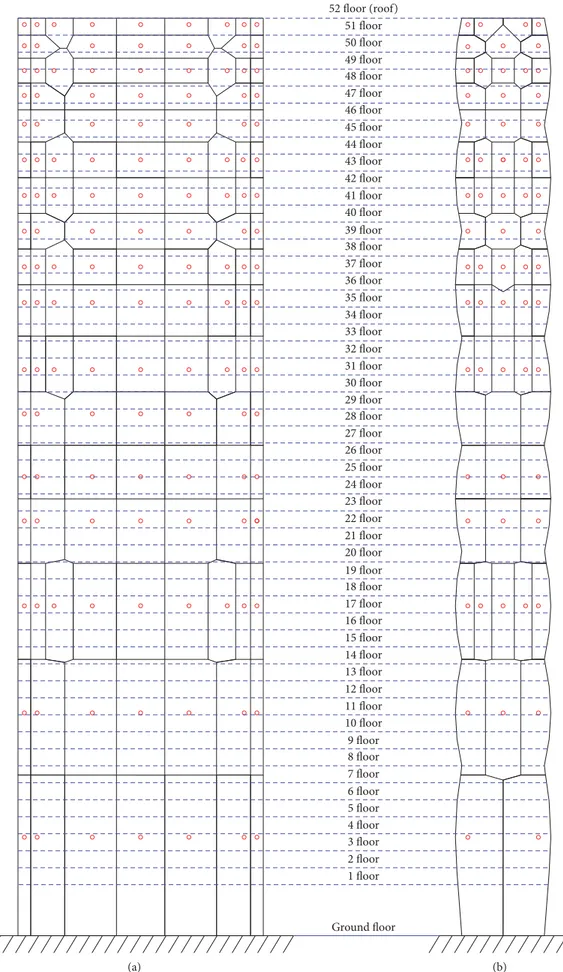
In this method, finite element model of the full scale structure was employed to predict the behavior of the real building. This method has the great potential to estimate the wind loads because it can address the limitations of the conventional force balance technique while maintaining the advantage of that technique [43]. 400 TAPs were distributed on the outer surfaces (for the wind tunnel experiment). The distribution of TAPs is such that number of TAPs per unit area is increasing as it goes upward as shown in Figure 4. Pressure value on each TAP of the model is calculated as
𝑝TAP(𝑡, 𝑧ref) = 𝑐𝑝(𝑡) 𝑞𝑉 (𝑧ref) , (3)
where𝑐𝑝(𝑡) is dimensionless time history of pressure coef-ficient and𝑞 is dynamic pressure. Once the time history of pressure on surface is determined, external force acting on each TAP surface can be calculated as
𝑓TAP(𝑡, 𝑧ref) = 𝑝TAP𝐴TAP, (4) where𝐴TAP is the area of each TAP which is evaluated by Thiessen polygon method. In order to estimate forces𝐹 and moments𝑀 at floor levels, the part of 𝑓TAPcorresponding to
each floor has been identified. For each𝑘-floor the surfaces 𝐴𝑘are identified; the generic𝐴𝑘is given by the space between two floors (product of the horizontal length of the floor and the interstory distance), as shown in Figure 5(a). Then the surfaces𝐴𝑘𝑖(Figure 5(c)) are considered by the intersection of the “area of influence” of the𝑘-floor 𝐴𝑘(Figure 5(a)) and the area of influence of the𝑖-TAP, 𝐴TAP𝑖(Figure 5(b)).
For each wind direction𝛼, the generic wind force 𝐹𝑘and moment𝑀𝑘in the generic𝑘-floor implemented in the FEM are given by
𝐹𝑘= [(𝑝TAP1𝐴(𝐴𝑘1+ 𝑝TAP2𝐴𝑘2+ ⋅ ⋅ ⋅ + 𝑝TAP𝑛𝐴𝑘𝑛) 𝑘1+ 𝐴𝑘2+ ⋅ ⋅ ⋅ + 𝐴𝑘𝑛) ] ,
𝑀𝑘
= (𝑝TAP1𝐴𝑘1𝑙𝑘1+ 𝑝TAP2𝐴𝑘2𝑙𝑘2+ ⋅ ⋅ ⋅ + 𝑝TAP𝑛𝐴𝑘𝑛𝑙𝑘𝑛) ,
(5)
where𝑙𝑘𝑖 (𝑖 = 1, . . . , 𝑛) represents the eccentricity between center of gravity and the centroid of the area 𝐴𝑘𝑖. The corresponding𝐹𝑘and𝑀𝑘were applied in the barycenter of each FEM’s𝑘-floor.
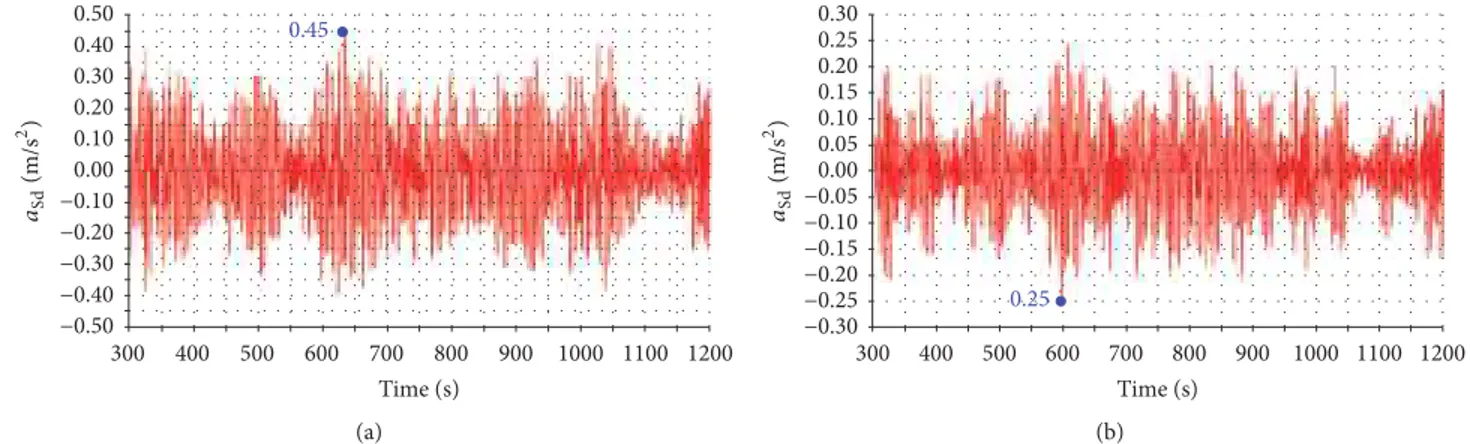
By the linear time history analysis (Figure 6), considering the first 10 mode shapes and different coefficients of structural damping (𝜉 = 1%–4%), the acceleration at the top of the building(𝑎Sd) was obtained. All acceleration is calculated by combing the two translational values (𝑥- and 𝑦-directions) with the torsional value (around𝑧-axis). For 𝜉 = 1% the value of𝑎Sdat top of building is 0.45 m/s2(Figure 6) which is higher than the comfort limit value𝑎Rd= 0.20 m/s2in Table 1. However, when the damping in the building is increased up to 4%, the maximum acceleration is about 0.25 m/s2, which is still higher than the comfort limit value. It implies that damping should be increased beyond 4% to get the desired value of acceleration (i.e., below 0.20 m/s2). This value of damping in the structure can be achieved by installing damping devices (TMD or VDs), which is studied in the subsequent sections.
5. High Frequency Force
Balance Method (HFFB)
The HFFB technique is widely used to measure wind forces on buildings, by wind tunnel testing, replicating the full scale scenario. High accuracy force sensors are employed to mea-sure wind induced loads at the base. The generalized loads are correlated to measured loads, if the building has uncoupled linear translational and uniform mode shapes [44].
HFFB procedure defines the global wind stress action on the building as the summation of the static and dynamic contributions [45–48]. The dynamic contribution is charac-terized by the background and the resonant part. Thus, the generic action, for example, the total moment ̂𝑀totat the base
of the building, is given by ̂
𝑀tot= 𝑀 + 𝑀dyn= 𝑀 + 𝑔𝐵⋅ 𝜎𝑀𝐵+ 𝑔𝑅⋅ 𝜎𝑀𝑅, (6)
where
(i) ̂𝑀totis total stress moment (static and dynamic con-tributions);
(ii)𝑀 is static contribution of the stress moment; (iii)𝑀dynis dynamic contribution of the stress moment; (iv)𝑔𝐵⋅ 𝜎𝑀𝐵is background part of the dynamic
contribu-tion;
1 floor 2 floor 3 floor 4 floor 5 floor 6 floor 7 floor 8 floor 9 floor 10 floor 11 floor 12 floor 13 floor 14 floor 15 floor 16 floor 17 floor 18 floor 19 floor 20 floor 21 floor 22 floor 23 floor 24 floor 25 floor 26 floor 27 floor 28 floor 29 floor 30 floor 31 floor 32 floor 33 floor 34 floor 35 floor 36 floor 37 floor 38 floor 39 floor 40 floor 41 floor 42 floor 43 floor 44 floor 45 floor 46 floor 47 floor 48 floor 49 floor 50 floor 51 floor 52 floor (roof) Ground floor (a) (b)
ℎ ℎ i − 1 i i + 1 Ak Floor k + 1 Floor k Floor k − 1 lki lp/2 (a) i − 1 i i + 1
A4!0i−1 A4!0i A4!0i+1
lp/2 (b) i − 1 i i + 1 Aki−1 Aki Aki+1 lp/2 (c)
Figure 5: (a) Area of influence of the𝑘-floor 𝐴𝑘. (b) Area of influence of the𝑖-TAP 𝐴TAP𝑖. (c) Area𝐴𝑘𝑖obtained by the intersection of𝐴𝑘 and𝐴TAP𝑖. 0.45 Time (s) 300 400 500 600 700 800 900 1000 1100 1200 0.50 0.40 0.30 0.20 0.10 0.00 −0.10 −0.20 −0.30 −0.40 −0.50 a3> (m/ M 2 ) (a) Time (s) 0.25 300 400 500 600 700 800 900 1000 1100 1200 0.25 0.20 0.15 0.10 0.05 0.00 −0.05 −0.10 −0.15 −0.20 −0.25 0.30 −0.30 a3> (m/ M 2) (b)
Figure 6: Time history of the acceleration (in𝑦-direction): (a) for 𝜉 = 1% and (b) for 𝜉 = 4.0%.
In (6) it is possible to distinguish (i) the extreme Gumbel value
̂
𝑀 = 𝑀 + 𝑔𝐵⋅ 𝜎𝑀𝐵 (7)
(ii) the resonant value: ̂ 𝑀dyn,𝑅= 𝑔𝑅⋅ 𝜎𝑀𝑅 = (√2 ln (𝑓𝑖⋅ 𝑇) + 0.5772 √2 ln (𝑓𝑖⋅ 𝑇)) ⋅ √4 ⋅ 𝜉𝜋 𝑓𝑖⋅ 𝑆𝑀(𝑓) (8) in which
(i)𝑇 refers to the time period (for the evaluation of the maximum value of the stress action (600 s));
(ii)𝑓𝑖 is the building natural frequency associated with the direction in which the moment is valued (in
this case, the first, the second, and the third natural frequencies are considered, by a modal analysis using FEM)
(iii)𝑆𝑀(𝑓) refers to the PSD (power spectral density) of the base moments (measured by a dynamometric balance);
(iv)𝜉 is the structural damping.
The Gumbel forces and moments coefficients values (for each time history and for all the wind directions) are obtained starting from the Fisher Tippet II probability density function [49] and the fully probabilistic method [50], ensuring the probabilities of occurrence related to the Gumbel coefficients values and the wind velocities are the same. The resonant part of the dynamic contribution is used to evaluate the forces 𝐹eq(𝑧) and the resonant moment 𝑀eq(𝑧).
𝐹eq(𝑧) = ̂𝑀dyn,𝑅 𝑚 (𝑧) 𝜑𝑖(𝑧) ∫𝑜𝐻𝜑𝑖(𝑧) 𝑧𝑚 (𝑧) 𝑑𝑧, 𝑀eq(𝑧) = ̂𝑀dyn,𝑅 𝜙𝑖(𝑧) 𝐼 (𝑧) ∫𝑜𝐻𝜙𝑖(𝑧) 𝐼 (𝑧) 𝑧 𝑑𝑧 (9)
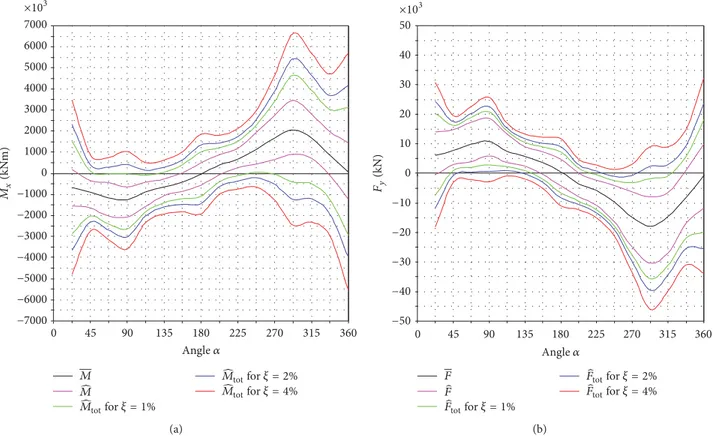
−7000 −6000 −5000 −4000 −3000 −2000 −1000 0 1000 2000 3000 4000 5000 6000 7000 0 45 90 135 180 225 270 315 360 Mx (kN m) Angle M M MNINfor = 1% MNINfor = 2% MNINfor = 4% ×103 (a) 0 10 20 30 40 50 0 45 90 135 180 225 270 315 360 Angle −10 −20 −30 −40 −50 ×103 F F FNINfor = 1% FNINfor = 2% FNINfor = 4% Fy (kN) (b)
Figure 7: Base loads: (a) base moment in𝑥 direction (𝑀𝑥) and (b) base shear in 𝑦-direction.
in which𝑚(𝑧) designates the distributed mass of the tower and 𝐼(𝑧) refers to the second moment of area, while 𝜙𝑖(𝑧) refers to the first eigenvector associated with the direction in which the force is valued. From 𝐹eq(𝑧) and 𝑀eq(𝑧) the translational and rotational acceleration are calculated in 𝑎𝑥(𝑧) = ∫ 𝐻 𝑜 𝜑I(𝑧) 𝐹eq(𝑧) 𝑑𝑧 ∫𝑜𝐻𝜑2 I(𝑧) 𝑚 (𝑧) 𝑑𝑧 𝜑I(𝑧) ; 𝑎𝑧(𝑧) = ∫ 𝐻 𝑜 𝑀eq(𝑧) 𝜑III(𝑧) 𝑑𝑧 ∫𝑜𝐻𝜑2 III(𝑧) 𝑀 (𝑧) 𝑑𝑧 𝜑III(𝑧) ; 𝑎𝑦(𝑧) = ∫ 𝐻 𝑜 𝐹eq(𝑧) 𝜑II(𝑧) 𝑑𝑧 ∫𝑜𝐻𝜑2 II(𝑧) 𝑚 (𝑧) 𝑑𝑧 𝜑II(𝑧) . (10)
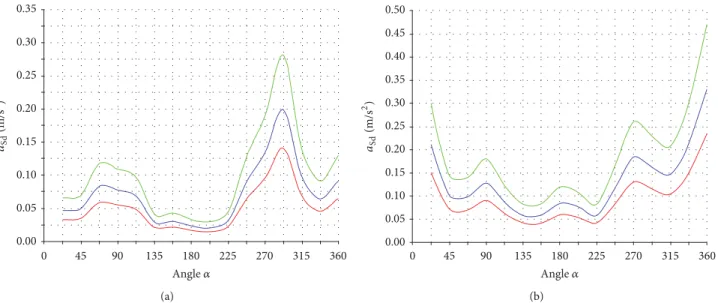
To take the effect of nonsimultaneousness into account, the contributions in𝑥-, 𝑦-, and 𝑧-directions have to be combined by specific coefficients [29]. With the HFFB procedure, it is possible to point out the dynamic effects. Base shear, bending moment, and the acceleration response are calculated as function of the direction angle𝛼, for several damping ratios 𝜉 (1.0%; 2.0%; and 4.0%) (Figures 7 and 8). For each wind direction 𝛼, it is possible to see the static and dynamic contribution of the wind effects, particularly for the sector around 292∘ there are maximum values of the actions. The
differences between the static part and the dynamic part are underlined. The acceleration is calculated at the corner of the building, combing acceleration𝑎𝑥and𝑎𝑦, respectively, with the contribution of the torsional acceleration𝑎𝑧. In Figure 9, point𝑃 represents a generic point on the building floor; 𝑑𝑥 and𝑑𝑦are the distances of𝑃 from the centroid in 𝑥- and 𝑦-direction, respectively. The maximum design acceleration at point𝑃 is given by 𝑎Sd𝑥= 𝑎𝑥+ 𝑑𝑦𝑎𝑧and𝑎Sd𝑦= 𝑎𝑦+ 𝑑𝑥𝑎𝑧.
6. Design Limits
The stress forces and the acceleration, calculated by the PIM and the HFFB procedures, show the dynamic effects due to the geometrical slenderness and shape of the building. The value of shear force (𝐹) and the moment (𝑀) at the base of building and top acceleration(𝑎Sd) are evaluated by two procedures described above which are different from those prescribed in the international codes. The codes used for the comparisons are the Eurocode 1 (EC1) and the Italian CNR DT207/2008 (CNR) indicated in the Italian code (DM 2008).
For the stress forces, comparison is carried out consid-ering the base shear force for𝑇R = 100 years (ULS). In the
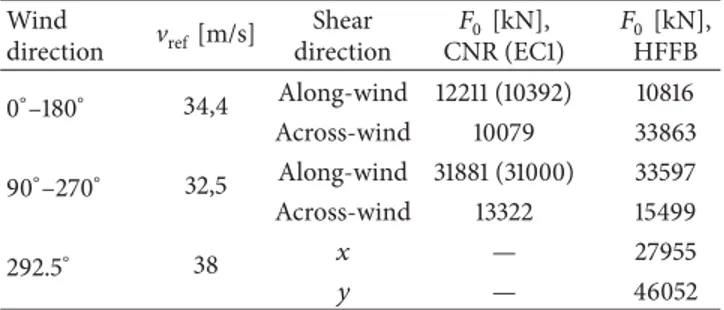
codes (EC1, DM 2008, and CNR), the base shear force along-wind direction (design value) is very similar to that evaluated by the HFFB, but it is different for the across-wind direction. Using the wind velocities estimated for the site [41], the base shear force(𝐹0) is shown in Table 3.
135 180 225 270 315 360 0.35 0.10 0.15 0.05 0.20 0.00 0.25 0.30 Angle 0 45 90 a3> (m/ M 2) (a) 135 180 225 270 315 360 0.50 0.10 0.15 0.05 0.20 0.00 0.25 0.30 0.45 0.40 0.35 Angle 0 45 90 a3> (m/ M 2) (b)
Figure 8: Acceleration response for different damping ratios𝜉: (a) in 𝑥-direction and (b) in 𝑦-direction (the torsional component is considered). X Y O P ax ay az dy dx
Figure 9: Representation of a point𝑃 for acceleration estimation.
Among the applicable codes in Italy, the across-wind effects can be evaluated only by the CNR, but, in their evaluation, the CNR does not consider the maximum wind velocity (38 m/s for 𝛼 = 292.5∘), since it takes in account only the wind speed in correspondence to the main axes of the building. Using the CNR, the structure does not appear afflicted by the vortex shedding, actually realized in wind tunnel testing, which causes high value of stress effects in across-wind direction. From the codes, evaluating the vortex shedding critical velocity Vcr and comparing it with the reference velocityVref, it results that the vortex shedding does not exist in the present building case. In fact, forVcr = 50 m/s (𝑇R= 10 years) the following relations are satisfied:
Vcr< 1.25Vref→ 50 m/s < 39.68 m/s (= 1.25 ⋅ 31.75 m/s) , (valid for EC1) ,
Vcr < Vref → 50 m/s < 31.90 m/s, (valid for CNR) .
(11)
In the estimation ofVcr, structural damping is not natu-rally set, but in case of reinforced concrete structure it ranges between 𝜉 = 0.8 and 2% (for the SLS, it would be more advantageous to use an high values of𝜉). In this building, natural structural damping is taken as 1%. The comparison in terms of acceleration in𝑦-direction is shown in the Table 4 for𝑇R= 10 years (SLS) and for two different damping ratios (𝜉 = 1% and 𝜉 = 4%).
From Table 4 one can see that, in the CNR code, the dynamic effects of the wind are taken into account, even if these are overestimated. In Table 5, the displacements obtained by wind tunnel tests, as well as with PIM, are list-ed.
7. Improvements
From above two procedures applied in wind tunnel test (HFFB and APTH), wind induced responses in the building are determined. In order to reduce those responses up to the acceptable limit prescribed in standard code, there needs to be some improvements in the building. The improvements in the building are analyzed in terms of (i) reduction of height, (ii) changing internal structural configuration by putting belt truss in different level, (iii) installation of damping devices (TMD and VD), and (iv) changing the orientation of build-ing. Before analyzing those improvements, it is necessary to clarify some questions about the wind velocity (Section 7.1).
Table 3: Shear design value at the base of the building. Wind direction Vref[m/s] Shear direction 𝐹0 [kN], CNR (EC1) 𝐹0[kN], HFFB 0∘–180∘ 34,4 Along-wind 12211 (10392) 10816 Across-wind 10079 33863 90∘–270∘ 32,5 Along-wind 31881 (31000) 33597 Across-wind 13322 15499 292.5∘ 38 𝑥 — 27955 𝑦 — 46052
Table 4: Stress design acceleration.
PIM HFFB CNR EC1
𝑎max(𝜉 = 1% - 𝑇R= 10
years) [m/s2] 0.45 0.47 0.53 0.19
𝑎max(𝜉 = 4% - 𝑇R= 10
years) [m/s2] 0.25 0.24 — —
Table 5: Stress design displacements.
Wind tunnel tests PIM 𝛿max(𝜉 = 1% - 𝑇 = 10 anni)
[m] 0.45 0.41
𝛿max(𝜉 = 4% - 𝑇R= 10 anni)
[m] 0.25 0.22
7.1. Wind Velocity and the Building Orientation. To determine
the site wind velocity, it is necessary to take in account two coefficients: the missing data correction coefficient 𝑐1 [51] and the directional coefficient 𝑐2 [52]. If𝑐2 was estimated by Kasperski in place of Cook [53] referring to [51], the maximum value of the site wind velocity could be decreased. For the north-west sector (270∘–360∘) the wind site study sets the reference velocityVref = 28.5 m/s (for 𝑇R = 100 years and quote𝑧 = 100 m). Tacking in account the missing data coefficient𝑐1= 1.14 and the directional correction coefficient 𝑐2 = 1.15 (by Cook), the reference velocity increases to the new value of Vref = 37.3 m/s. As mentioned before, considering Kasperski [52]𝑐2decreases to𝑐2= 1.11 obtaining a new valueVref = 36.06 m/s. This last value is lower than the first one but always higher than the code no-directional velocity estimated by the Italian regulationVref = 33.25 m/s (𝑇R = 100 years, at 100 m). Keeping in mind the fact that
the wind velocity is changed with the direction, one can find an optimal ordination for the building that can result in minimized overall loads and responses. The effect of wind directionality on the responses will be investigated later in this study (Section 7.5).
7.2. Height Reduction. It is obvious that higher the building,
the higher the flexibility, for the same footage. Here the study focuses on how sensitive the wind induced responses are to change in the building height. In the first design phase, the building height was 225 m; a reduction in the height in the order of 12.5% was considered to check the response sensitivity. The reduction in the height was considered to
Table 6: Percentages of increase in the dominant frequencies.
Vibrational mode shape Δ𝑓 [%]
I (flexural along𝑥) 19
II (flexural along𝑦) 18
III (torsional around𝑧) 19
understand its effect as an alternative to installing a TMD, or modifying the layout of the building, by creating belt internal trusses.
The reduction in the height was achieved by eliminating the top five floors. Apparently, the reduction involves the loss of five floors, but if we consider the fact that the structure supporting the TMD needs three floors, the reduction of height actually leads to a loss of two floors, saving costs and execution time. Consequently, the slenderness decreases to 𝜆 ≅ 8.50 leading to (i) a reduction of the displacement at the top; (ii) a reduction of base forces and moments; and (iii) an increase in the structural stiffness, with rigidity improvement. If we consider a simplified cantilever beam model, for the same bending stiffness (EI) of the cross-section and the same distributed load(𝑝), along the height (𝐻), the initial displacement(𝛿𝑖) and the reduced displacement (𝛿𝑟) are given by (per unit load)
𝛿𝑖= (𝑝𝐻𝑖 4) (8EI) , 𝛿𝑟= (𝑝𝐻𝑟 4) (8EI) = 0.59 × (𝑝𝐻𝑟4) (8EI) . (12)
Thus, the reduction in the displacement at the top is about Δ𝛿 ≅ 41%. Considering that the base shear is proportional to the height of the building, and the base moment is a quadratic function of the building height (under the same load𝑝), the reduction in the base shear isΔ𝐹 ≅ 12.5% and the reduction in the bending moment isΔ𝑀 ≅ 23%. The initial stiffness of the building𝑘𝑖 = 8EI/𝐻𝑖3 is increased to𝑘𝑟 = 8EI/𝐻𝑟3 = 1.49 × 8EI/𝐻𝑖3under the same load. Thus, the increment is aboutΔ𝑘 ≅ 49%. An estimate of the main frequencies could be obtained by the following simplified relation:
𝑓 = (𝑘/𝑚)1/2
2𝜋 , (13)
where𝑘 is estimated stiffness and 𝑚 is mass. Due to reduction in height, total mass of building is decreased by(Δ𝑚 = 5.55%) which ultimately increased the natural frequencies(Δ𝑓) as listed in Table 6 (about 20% increase). Combining the reduc-tion in both wind speed and building height, improvements in terms of base shear reduction(Δ𝐹𝑦), moment (Δ𝑀𝑥) and top floor acceleration(Δ𝑎max) reductions are listed in Table 7.
All the improvements are verified by the HFFB method. While Table 7 lists the combined effects of the reduction in the building height and the wind speed, the sole reduction in the responses due to the reduced building height is significant. The reductions in the base shear force are in the order of 13%, the reduction in the base bending moment is about 26%, and the reduction in the acceleration is about 21%.
Table 7: Structural improvements for different velocities and heights: reductions in the base shear and bending moments and the acceleration response of the top floor.
Configuration 𝐻 [m] V [m/s] Δ𝐹𝑦[%] Δ𝑀𝑥[%] Δ𝑎max[%]
Initial 225 38 (Directional velocity) — — —
Initial 225 33 (Directional velocity) 19.8 18.6 9.0
Initial 225 33 (No-directional velocity) 17.4 11 7.7
Proposed 199 38 (Directional velocity) 13 26 21
Proposed 199 36 (Directional velocity) 19.5 38.4 22
Proposed 199 33 (Directional velocity) 32.6 40.6 29.4
Proposed 199 33 (No-directional velocity) 28.2 38.3 15.3
7.3. Structural Configuration. To save the internal layout of
the structure from significant changes that could result from increase of thickness, different structural configurations are considered. Introduction of an internal belt truss system or a beam-wall increases the stiffness of structure. This system consists of main cores linked with outer columns by stiff members which can be about one or more story depth. Under lateral wind loads, the internal moments are resisted by both core and tension/compression developed in outer columns. Thus the effectiveness of the building to carry bending is enhanced [23]. The configurations are characterized by beams height one or two interstory distance. It is possible to realize the beams in concrete (beam-wall case) or in S355 steel (belt truss case).
In both cases, the belt truss could span along two or four horizontal alignment with a depth of one or more stories as shown in Figure 10. In case of two alignments the belt truss can be placed either along the central axes or along the facades.
The analysis discussed in this paragraph is related to the building with a height of 225 m. The beam-wall or belt truss elements work as a stiffening bracing system along the axis𝑥. The response reduction was investigated by using a belt truss system in the building at different levels. Three different cases are studied and configurations of each case are explained below.
Case 1. Two horizontal alignments of belt trusses with four
interstory depths are considered. The configurations of the proposed bracing system for Case 1 over the building’s height are (i) at 1/2 and top; (ii) at 1/2 and 3/4; (iii) at 1/4 and 1/2; (iv) at 1/2; and (v) at top as shown in Figure 11 (see also Table 8).
Case 2. Four horizontal alignments of the belt trusses with
two interstory depth are considered, where the belt trusses are located (i) at 1/2 and (ii) at the top of the building (see Table 9).
Case 3. Four horizontal alignments of the belt truss with one
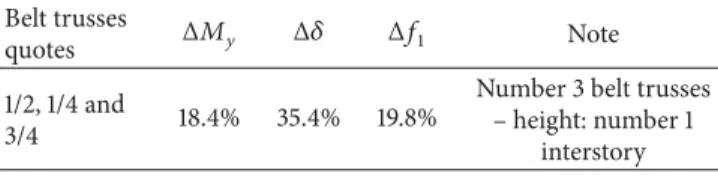
interstory height are considered and belt trusses are intro-duced at 1/4, 1/2, and 3/4 of building height (see Table 10).
The comparisons between the original and the modi-fied configurations are carried out in terms of decrease in base moment, Δ𝑀𝑦 [%]; increase in the first vibrational mode (along the axis𝑥), Δ𝑓1[%]; and decrease of the top
Table 8: Comparisons between the original building and the solution proposed in Case 1, n. 4 interstories in height and n. 2 lines in horizontal length: Case 1.
Belt trusses
quotes Δ𝑀𝑦 Δ𝛿 Δ𝑓1 Note
1/2 and top 15.8% 45.8% 25.7%
Number 2 belt trusses – height: number 2
interstory 1/2 and 3/4 21.0% 50.0% 28.9%
Number 2 belt trusses – height: number 2
interstory 1/4 and 1/2 28.9% 47.9% 26.9%
Number 2 belt trusses – height: number 2
interstory
1/2 19.0% 43.7% 24.4%
Number 2 belt trusses – height: number 4
interstory
Top 6.0% 27.1% 13.6%
Number 2 belt trusses – height: number 4
interstory Table 9: Comparison between the original building and the solution proposed in Case 2, n. 2 interstory in height and n. 4 lines in horizontal length: Case 2.
Belt trusses
quotes Δ𝑀𝑦 Δ𝛿 Δ𝑓1 Note
at 1/2 18.8% 45.8% 25.7%
Number 4 belt trusses – height: number 2
interstories
Top 5.8% 27% 12.9%
Number 4 belt trusses – height: number 2
interstories
displacement in𝑥-direction, Δ𝛿 [%]. The improvements for all the cases are shown in Tables 8–10. If one looks at the general pattern from Tables 8, 9, and 10, it can be observed that the best solution to improve the structural behavior under wind load is to place the belt trusses at half height of the building rather than at the top, as confirmed in Table 11. Although there is maximum reduction of displacement(Δ𝛿 = 50%) in Case 1 when the belt trusses are at 1/2 and 3/4, the reduction in base moment is small as compared to the other configurations (1/4 and 1/2). Thus, among all configurations and best improvements in the base moment(Δ𝑀𝑦= 28.9%),
Cores
Axis 2
Axis 1
Beams connected the two parts of the core
Belt trusses positioning
(a) Cores Axis 2 Axis 1 Axis 4 Axis 3
Beams connected the two parts of the core
Belt trusses positioning
Extension of walls of the core
(b)
Figure 10: Schematic representation of the location of the built trusses in the top view: (a) two alignments and (b) four alignments.
Table 10: Percentages of response reduction achieved by the solution proposed in Case 3, n. 1 interstory in height and n. 4 lines in horizontal length: Case 3.
Belt trusses
quotes Δ𝑀𝑦 Δ𝛿 Δ𝑓1 Note
1/2, 1/4 and
3/4 18.4% 35.4% 19.8%
Number 3 belt trusses – height: number 1
interstory
the displacement (Δ𝛿 = 47.9%) and the natural frequency (Δ𝑓1 = 26.9%) are achieved in Case 1, when the belt trusses are at 1/4 and 1/2 (Table 8).
The significant improvement in terms of natural fre-quency (Δ𝑓1 = 28.9%, this value determines some dynamic effects related to the wind action) is represented by two belt
Table 11: Effects of belt-truss location of the response. Belt trusses
quotes Δ𝑀𝑦 Δ𝛿 Δ𝑓1 Note
top 4.2% 20.2% 9.4%
Number 2 belt trusses – height: number 2
interstories
1/2 14.0% 32.6% 18.6%
Number 2 belt trusses – height: number 2
interstories
trusses with two interstory height located at 1/2 and 3/4, but the base moment is reduced significantly when belt trusses are at 1/4 and 1/2. Clearly, the solution with belt trusses with four interstory heights is more invasive for the layout of the building.
(a) 1/2 and top (b) 1/2 and 3/4 (c) 1/4 and 1/2 (d) 1/2 (double) (e) Top (double)
Figure 11: Schematic representation of the position of the belt trusses for Case 1: see Table 8.
Therefore, structural improvements related to some dif-ferent structural configurations are illustrated. Each configu-ration is characterized by the insertion of concrete beam-wall or steel belt truss to increase the stiffness of the building. The concrete beam-wall seems easier to realize in comparison to the belt truss but the presence of the necessary openings in the longitudinal beam-walls is negative for the strut and tie behavior (thus, only few openings could be realized). Con-versely, the configurations with steel belt trusses guarantee the strut and tie behavior but their positioning could be painstaking.
7.4. Installation of Dampers. To improve the structural
behav-ior some active or passive mass dumpers solutions could be considered [6, 54–56]. In the present case, a solution represented by TMD is taken into account. The damper is represented by a nodal mass linked to center of gravity of top floor, by a linear spring-damper element. The mass damper is implemented in the FEM of building, as well as the HFFB procedure. The TMD stiffness ratio and the coefficient of damping are evaluated according to [55]. The TMD was assumed to be installed at top of the tower, making use of the top three stories, which has increased the structural damping from 1% to 4%. Response reduction is analyzed in terms of reduction in base shear for different wind direction angles. Significant reduction in base shear is achieved by installation of TMD as listed on Table 12. It can be observed from Table 12 that the base shear is considerably reduced in each wind direction angle; however, the highest reduction (Δ𝐹 = 43.46%) is obtained along the 𝑥-axis at a damping ratio 𝜉 of 4.0%, when the wind angle is 292.5∘.
Another solution, represented by VDs, is implemented in the FE model as shown in Figure 12. The dampers are installed transversely in the cores from the base up to the 20th floor. The installation includes problems due to the openings in the walls of the cores to pass from the elevator areas to the inner
Table 12: Improvements by the TMD. Wind
direction Base shear direction
𝐹0 [kN], HFFB –Vsite, 𝜉 = 1.0% 𝐹0 [kN], HFFB –Vsite 𝜉 = 4.0% 0∘–180∘ Along-wind 10816 8338 Across-wind 33863 19847 90∘–270∘ Along-wind 33597 27718 Across-wind 15499 10875 292.5∘ 𝑥-axis 27955 15803 𝑦-axis 46052 35697
areas. By installing viscous dampers base shear is reduced by Δ𝑇0 = 45% (at ULS), peak acceleration in 𝑥-direction is reduced byΔ𝑎𝑥 = 25% (at SLS), and displacement at the top of building is reduced byΔ𝛿 = 33% (at ULS). Although viscous dampers are effective in reducing displacement and base shear, they are not that effective in reducing peak acceleration of building. Despite the installation of viscous dampers, the peak acceleration obtained is 0.32 m/s2, which is greater than the comfort limit of 0.2 m/s2(for office usage). In order to get compatible value of acceleration (smaller than 0.20 m/s2) installation of viscous damper should be extended up to 35th story.
7.5. Global Layout. The wind direction angle and interference
effects are two important factors that should be carefully studied early in the design phase. Wind loads and responses in high-rise buildings depend on wind direction angle and interference of existing building in that area. Since the approaching wind flow may have different mean wind speeds when it reaches the building from different directions, and considering the fact that along-wind and the cross wind responses are different, it is feasible to rotate original building
X Y
Figure 12: FEM with the viscous dampers implemented in the cores.
Table 13: Percentages of response reduction for two proposed orientations.
TA rotation Δ𝑎Sd,𝑦 Δ𝛿Sd,𝑦
45∘ 13% 11%
65∘ 28% 24%
layout in such a way that the wind induced responses are reduced [57].
From the dynamic procedures and the tests in the wind tunnel, it is possible to understand the most correct layout for building, especially if other tall buildings will rise up nearby [58]. The decrease of the stress effects in𝑦-direction is obtained by 45∘ clockwise rotation of building from the initial layout (Figure 13). When the building is rotated by 45∘ there was only slight reduction of responses, but in case of 65∘clockwise rotation the highest reductions of acceleration and the displacement at the top are obtained (Table 13 where symbol of acceleration is𝑎Sd,𝑦, and the displacement is𝛿Sd,𝑦). Acceleration in𝑦-direction is decreased by 27.27% (𝑎Sd,𝑦 is reduced: from 0.88 m/s2 to 0.64 m/s2) and displacement in 𝑦-direction is also reduced by 25% (𝛿Sd,𝑦 is decreased from 1.20 m to 0.90 m). Despite the mentioned improvements in𝑦-direction, the 65∘ clockwise rotation of building from the original layout has increased the acceleration(𝑎Sd,𝑥) and the displacement (𝛿Sd,𝑥) in 𝑥-direction. In the 𝑥-direction, acceleration is increased by 9% and displacement is increased by 3.5% (𝑎Sd𝑥is changed from 0.53 m/s2to 0.58 m/s2and𝛿Sd,𝑥
is changed from 0.85 m to 0.88 m). Since wind effects in the 𝑥-direction are low, compared to 𝑦-direction, slight increase of responses in𝑥-direction could be acceptable, as compared to large reduction of responses in𝑦-direction.
This reduction in responses is achieved without adding any structural element or component in the primary building, hence no additional cost on the building. This confirms the
o y x 0∘ 45∘ 90∘ 135∘ 180∘ 225∘ 270∘ 315∘ TA 292.5∘ y x
Figure 13: Representation of the orientation change.
advantage of rotating the building to the suggested orienta-tion. It also explores the significance of response prediction in high-rise building during preliminary design stage.
8. Conclusions
In this paper, some limits of available design standards (Eurocode 1 & the Italian design code) to evaluate wind actions on high-rise buildings (displacements and accelera-tion responses) are presented, pointing them out in a compar-ison to a more sophisticated methods (i.e., the use of the PIM with FEM of the building, and the HFFB technique). These limits are highlighted by the fact that the detailed analysis method resulted in higher base shear and moment values than those provided by the design standards, and that was strongly influenced by the high aspect ratio of the building. In fact, vortex shedding effects were realized in the current study in both results obtained by the PIM and the HFFB methods, and such phenomenon was greatly dependent on the building geometry which is not fully addressed in the codes.
Structural improvements are proposed which resulted in considerable response reductions, without significantly alerting the architectural shape of the original building. These solutions include (i) height reduction, (ii) steel belts, (iii) tuned mass damper, (iv) viscous dampers, and (v) orientation change. A reduction in the apparent height in the order of 12.5% was considered to check the response sensitivity. The reduction in the height was considered to understand its effect as an alternative to installing a TMD. The reduction in the height was achieved by eliminating the top five floors. Apparently, the reduction involves the loss of five floors, but if we consider that the structure supporting the TMD needs three floors, the reduction of height actually leads to a loss of only two floors. This height lessening led to reduced base shear force, in the order of 13%, reduced base bending moment (26%), and reduced acceleration (21%).
Belt truss systems with different structural configurations are studied and compared in terms of their capability to
bring reduction to the base bending moment, reduction of displacement at the top, and the increase of natural frequencies. The optimal numbers and location of belt trusses are determined by comparing three different cases for the maximum reduction of wind induced responses. In each case, it is observed that the performance of the belt truss systems is at its maximum level when they are placed at half height of the building rather than at the top. It can also be concluded that two horizontal alignments of belt trusses along the major axis of the building are more effective than four alignments, considering same number of belt trusses. Nevertheless, two horizontal alignments of belt trusses with two interstory depths located at 1/4 and 1/2 the height of the building (Case 1) are efficient in reducing the responses, where the displacement at the top is reduced by about 48% and the bending moment is reduced by 29%.
Vibration suppression by the installation of a TMD is evaluated by reductions in the base shear and bending moments, as well as displacement and acceleration. Results show considerable reduction in base shear in each wind direction angle; however a maximum reduction in base shear (43.5%) is achieved by an equivalent damping ratio of 4.0%, when the wind direction angle is 292.5∘. The TMD appears to be a valid technical solution but, in order to implement it, the loss of the top three floors has to be considered, which is necessary to build the structure supporting the TMD.
Another improvement is presented by viscous dampers, where the dampers are installed transversely in the cores from the base up to the 20th floor. VDs were installed to examine their potential to reducing the base loads, peak acceleration, and the maximum displacement. Substantial improvements are achieved using viscous dampers: base shear is reduced by 45%, peak acceleration is lessened by 25%, and the displacement is reduced by 33%. Although the installation of viscous dampers up to the 20th floor is effective in reducing displacement and base shear, it is not enough to reduce the peak acceleration to the prescribed limits. Thus, the installation of VDs up to the 35th floor was suggested.
Finally, the importance of the global positioning of the building (orientation change) was examined, considering its rotation with respect to an original layout. The rotation of the building by 65∘ from the initial layout resulted in the highest reduction in displacement and acceleration. The reduction in the acceleration is 27% whereas the displacement is reduced by 25%. This reduction in responses is achieved without adding any structural elements or components to the primary building, hence no additional cost. This reveals the advantage of rotating the building to the suggested orientation and highlights the significance of response pre-diction in high-rise buildings during the preliminary design stage.
Conflicts of Interest
The authors declare that there are no conflicts of interest regarding the publication of this paper.
Acknowledgments
Partial support received from the Louisiana Board of Regents (BoR) (Research Competitiveness Subprogram [RCS]) is acknowledged.
References
[1] A. Farouk, High Rise Buildings and How They Affect Countries
Progression, Department of Architecture Engineering, Cairo
University, 2011, https://www.g-casa.com/conferences/zagreb/ papers/Akram1-HighRise.pdf.
[2] H. Y. O. S. Park and C. L. I. M. Park, “Drift control of high-rise buildings with unit load method,” vol. 6, pp. 23–35, 1997. [3] H. S. Park, H. G. Sohn, I. S. Kim, and J. H. Park, “Application of
GPS to monitoring of wind-induced responses of high-rise buildings,” The Structural Design of Tall and Special Buildings, vol. 17, no. 1, pp. 117–132, 2008.
[4] T. Kijewski, “Full-scale study of the behavior of tall buildings under winds,” Proc. SPIE, vol. 4337, no. 219, pp. 441–450, 2001. [5] R. Rana and T. T. Soong, “Parametric study and simplified
design of tuned mass dampers,” Engineering Structures, vol. 20, no. 3, pp. 193–204, 1998.
[6] A. M. Aly, “Vibration control of high-rise buildings for wind: A robust passive and active tuned mass damper,” Smart Structures
and Systems, vol. 13, no. 3, pp. 473–500, 2014.
[7] Y.-M. Kim, K.-P. You, and H.-Y. Kim, “Wind-induced excitation control of a tall building with tuned mass dampers,” The
Structural Design of Tall and Special Buildings, vol. 17, no. 3, pp.
669–682, 2008.
[8] A. Kareem, T. Kijewski, and Y. Tamura, “Mitigation of Motion of Tall Buildings with Specific Examples of Recent Applications,”
Wind Struct, vol. 2, no. 3, pp. 201–251, 2007.
[9] K. A. O’Connor, J. D. Johnson, S. E. Hammack et al., “Inescap-able shock induces resistance to the effects of dexamethasone,”
Psychoneuroendocrinology, vol. 28, no. 4, pp. 481–500, 2003.
[10] S. Nagarajaiah and B. Basu, “Output only modal identification and structural damage detection using time frequency wavelet techniques,” Earthquake Engineering and Engineering Vibration, vol. 8, no. 4, pp. 583–605, 2009.
[11] Y. Fujino, L. Sun, B. M. Pacheco, and P. Chaiseri, “Tuned liquid damper (TLD) for suppressing horizontal motion of structures,”
Journal of Engineering Mechanics, vol. 118, no. 10, pp. 2017–2030,
1992.
[12] M. J. F. Silva and A. C. Costa, “Experimental Studies On The Characteristics Of Tuned Liquid Dampers For Reducing Vibra-tion In Structures,” in Proceedings of the 14th World Conference
Earthquake, China, 2008.
[13] H. F. Bauer, “Oscillations of immiscible liquids in a rectangular container: A new damper for excited structures,” Journal of
Sound and Vibration, vol. 93, no. 1, pp. 117–133, 1984.
[14] N. Makris, M. C. Constantinou, and G. F. Dargush, “Analytical model of viscoelastic fluid dampers,” Journal of Structural
Engineering, vol. 119, no. 11, pp. 3310–3325, 1994.
[15] M. C. Constantinou and M. D. Symans, “Seismic response of structures with supplemental damping,” The Structural Design
of Tall and Special Buildings, vol. 2, no. 2, pp. 77–92, 1993.
[16] C. Prabha and L. Mathew, “Effect of Fluid Viscous Dampers in Multi-Storeyed Buildings,” International Journal of Research in