Energy cost of walking and running at extreme
uphill and downhill slopes
ALBERTO E. MINETTI,2CHRISTIAN MOIA,1GIULIO S. ROI,3 DAVIDE SUSTA,1 AND GUIDO FERRETTI1
1De´partement de Physiologie, Centre Me´dical Universitaire, 1211 Gene`ve 4, Switzerland;2Centre for Biophysical and Clinical Research into Human Movement, Department of Exercise and Sport Science, Manchester Metropolitan University, Alsager, Cheshire ST7 2HL, United Kingdom; and3Medical Committee, Federation for Sport at Altitude, 13900 Biella, Italy
Received 29 November 2001; accepted in final form 29 April 2002
Minetti, Alberto E., Christian Moia, Giulio S. Roi, Davide Susta, and Guido Ferretti. Energy cost of
walk-ing and runnwalk-ing at extreme uphill and downhill slopes. J Appl Physiol 93: 1039–1046, 2002; 10.1152/japplphysiol. 01177.2001.—The costs of walking (Cw) and running (Cr) were measured on 10 runners on a treadmill inclined be-tween⫺0.45 to ⫹0.45 at different speeds. The minimum Cw was 1.64⫾ 0.50 J䡠kg⫺1䡠m⫺1at a 1.0⫾ 0.3 m/s speed on the level. It increased on positive slopes, attained 17.33 ⫾ 1.11 J䡠kg⫺1䡠m⫺1 at ⫹0.45, and was reduced to 0.81 ⫾ 0.37 J䡠kg⫺1䡠m⫺1at⫺0.10. At steeper slopes, it increased to reach 3.46 ⫾ 0.95 J䡠kg⫺1䡠m⫺1 at ⫺0.45. Cr was 3.40 ⫾ 0.24 J䡠kg⫺1䡠m⫺1on the level, independent of speed. It increased on positive slopes, attained 18.93 ⫾ 1.74 J䡠kg⫺1䡠m⫺1 at ⫹0.45, and was reduced to 1.73 ⫾ 0.36 J䡠kg⫺1䡠m⫺1at⫺0.20. At steeper slopes, it increased to reach 3.92 ⫾ 0.81 J䡠kg⫺1䡠m⫺1at⫺0.45. The mechanical efficiencies of walking and running above⫹0.15 and below ⫺0.15 attained those of concentric and eccentric muscular contraction, respectively. The optimum gradients for mountain paths approximated 0.20–0.30 for both gaits. Downhill, Cr was some 40% lower than reported in the literature for sedentary subjects. The estimated maximum running speeds on positive gradients corresponded to those adopted in uphill races; on negative gradients they were well above those attained in downhill competitions.
gradients; exercise; optimum path; maximum running speed
THE ENERGY COSTS OF LEVEL walking (Cw) and running (Cr) in humans have been extensively investigated (e.g., Refs. 4, 10, 12, 14, 15). Cw varies as a function of the speed, showing a minimum value at⬃1.3 m/s. Cr is independent of the speed. Both Cw and Cr depend on the characteristics of the terrain, resulting higher on soft than on hard ground (13, 27). Adding a 1-kg load on the lower limbs increases Cr up to 7%, depending on where masses are added (16). Cr is also affected by the foot landing patterns, which allow a different efficiency of leg muscles and tendons (2) and increase when muscles are fatigued (5).
When walking or running on positive gradients, both the minimum Cw and the Cr increase as a function of the incline [up to⫹0.15 for running and up to ⫹0.40 for walking (14, 15)]. When negative gradients are ap-plied, both Cr and the minimum Cw attain their lowest value at⫺0.10. Below this slope, and down to ⫺0.20 for running and to ⫺0.40 for walking, minimum Cw and Cr are negatively related to the incline, becoming higher the lower the slope (14, 15). The range of run-ning gradients (from ⫺0.20 to ⫹0.15), narrower than for walking, was set by the aerobic power of the sub-jects, none of whom was a professional long-distance runner.
Margaria (14) introduced also the concept of “me-chanical efficiency,” defined as the ratio of me“me-chanical work for vertical displacement to the energy expended. He adopted the approximation of considering just the mechanical potential work (and disregarding the ki-netic one) because he assumed that beyond a given gradient the rise (or descent) of the center of mass is the prevailing contributor to the mechanical external work. This assumption was supported by recent re-search (19, 20), which set the ⫾0.15 gradient as the threshold for pure positive and negative work in uphill and downhill locomotion, respectively. At slopes above ⫹0.20, Margaria found that the efficiency of walking was⬃0.25, i.e., close to that of concentric muscle con-tractions (26). At slopes below ⫺0.20, the mechanical efficiency of walking was about⫺1.20, as for eccentric muscular contractions (1). Margaria postulated that this would have been the case also for running. Suc-cessively, little attention was paid to the study of the cost of locomotion at extreme slopes, despite the fact that in recent years walking and running on mountain paths became common practices in leisure time and sport. Davies et al. (8) studied one subject running downhill at ⫺0.40; their results appear to agree with Margaria’s hypothesis. To our knowledge, however, no systematic study of Cr during downhill and uphill running has been carried out so far.
Address for reprint requests and other correspondence: G. Fer-retti, De´partement de Physiologie, Centre Me´dical Universitaire, 1, rue Michel Servet, 1211 Gene`ve 4, Switzerland (E-mail: guido. [email protected]).
The costs of publication of this article were defrayed in part by the payment of page charges. The article must therefore be hereby marked ‘‘advertisement’’ in accordance with 18 U.S.C. Section 1734 solely to indicate this fact.
The aim of the present study was to determine Cw and Cr on men walking and running on a treadmill at slopes ranging from ⫺0.45 to ⫹0.45, to encompass, especially for running, a wider range of slopes than in any previous study. In addition, we compared the max-imum estimated running speeds as a function of the gradient, with the top performances in just-uphill and just-downhill fell running races.
METHODS
Subjects. After local ethical approval, 10 subjects were admitted to the study [men age 32.6 ⫾ 7.5 yr, body mass 61.2⫾ 5.7 kg, maximal O2consumption (V˙O2 max) 68.9⫾ 3.8 ml䡠min⫺1䡠kg⫺1]. They were all elite athletes practicing en-durance mountain racing.
Methods. The O2consumption (V˙O2) and CO2output (V˙CO2) at rest and at the exercise steady state were measured by the standard open-circuit method. Expired air was collected in Douglas bags and analyzed for gas composition by use of O2 and CO2 analyzers (Leybold Haereus) and for volume by using a dry gas meter (Singer). V˙O2 and V˙CO2 were then calculated and expressed inSTPD. V˙O2 maxwas measured by an incremental exercise test on the treadmill.
Heart rate was measured continuously by cardiotachogra-phy (Polar), and blood lactate concentration was determined after each run by an electroenzymatic method (Eppendorf EBIO 6666) on 20-l micro blood samples from an ear lobe as a check for submaximal aerobic exercise.
The rate of metabolic energy expenditure (E˙ , in W/kg) was calculated from the net V˙O2values (measured minus resting) assuming an energy equivalent of 20.9 kJ/l O2(corresponding to a nonproteic respiratory exchange ratio of 0.96). Cw and Cr were calculated (J䡠kg⫺1䡠m⫺1) as the ratio between E˙ and the nominal speed. The mechanical efficiency of locomotion was calculated as the ratio of the mechanical work rate (W˙vert, W/kg) done to lift or absorbed in lowering the body mass at each stride to the rate of metabolic energy expenditure. W˙vert was calculated as
W˙ vert⫽ gv sin 共arc tan 兩i兩兲 (1) where g is gravity acceleration (9.81 m/s2), v is the treadmill speed (m/s), and i is the gradient.
Procedure. Each subject performed up to three walking and three running trials on a motor-driven treadmill at progressively increasing speeds on the level, and at the slopes of 0.10, 0.20, 0.30, 0.35, 0.40, and 0.45 uphill and downhill. Each trial lasted 4 min. Expired gas was collected into Douglas bag in the course of the fourth minute of exer-cise and analyzed immediately after the end of the trial. During uphill running, two consecutive trials were separated by 5-min recovery intervals, during which blood was taken for lactate determinations at minutes 1, 3, and 5.
Before a test was performed, the speed of spontaneous transition between walking and running was identified em-pirically. Each test was performed according to an incremen-tal procedure. At all gradients the speed of the first walking trial, carried out at the lowest investigated speed, was 0.69 m/s. The subsequent walking speeds were chosen in such a way as to stay within the speed range between 0.69 m/s and the apparent spontaneous transition speed. When possible, the speed increment was 0.42 m/s. The speed of the first running trial was set equal to the spontaneous transition speed. For the successive two trials at faster speeds, an increment of 0.56 m/s was usually imposed. This increment was reduced at high positive slopes, to cope with the need of
performing submaximal exercise trials. However, in some cases, a test was interrupted without completing the three running speeds, if blood lactate accumulation was higher than 4 mM. This happened particularly at the highest posi-tive slopes, and on four subjects running could not be per-formed at slopes of⫹0.40 and ⫹0.45.
RESULTS
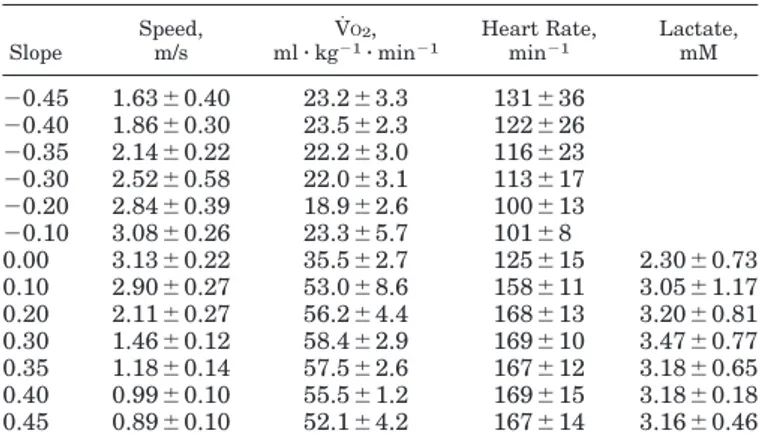
V˙O2 increased as a function of speed from 0.69 m/s onward during walking. During running, it increased linearly with the speed. At each speed, it was higher the higher the uphill gradient. The V˙O2 values ob-served at the highest tested speed on the level and during uphill locomotion at each slope are reported in Table 1, together with the corresponding heart rate and blood lactate values.
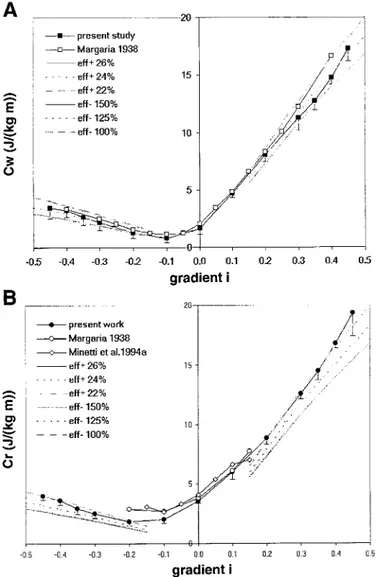
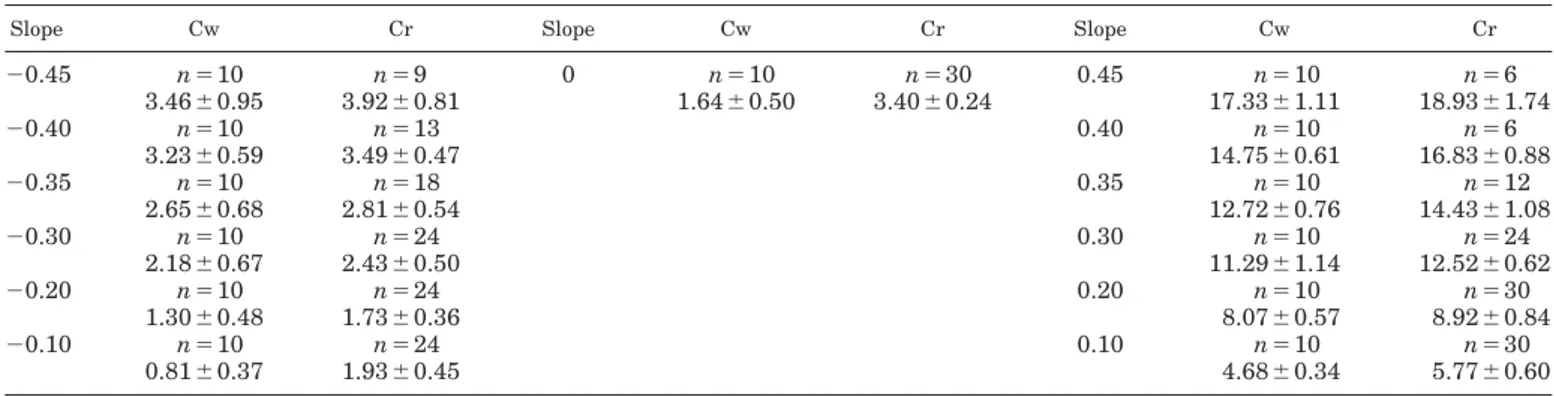
The Cw on the level was 1.85⫾ 0.57 J䡠kg⫺1䡠m⫺1at the speed of 0.69 m/s. The average minimum Cw was 1.64⫾ 0.50 J䡠kg⫺1䡠m⫺1at a speed of 1.0⫾ 0.3 m/s. The minimum Cw is plotted in Fig. 1A as a function of the slope. During uphill walking, the minimum Cw in-creased with the slope. At the slope of⫹0.45, minimum Cw was 17.33⫾ 1.11 J䡠kg⫺1䡠m⫺1at the speed of 0.69 m/s for all subjects. During downhill walking, the min-imum Cw attained its lowest value (0.81 ⫾ 0.37 J䡠kg⫺1䡠m⫺1) at the slope of⫺0.10 at the average speed of 3.14 ⫾ 0.22 m/s. At slopes below ⫺0.10, it progres-sively increased. At ⫺0.45, it was 3.46 ⫾ 0.95 J䡠kg⫺1䡠m⫺1.
Cr on the level was 3.40 ⫾ 0.24 J䡠kg⫺1䡠m⫺1, inde-pendent of speed. The average Cr at the investigated speeds is plotted in Fig. 1B as a function of the slope. Cr increased with the slope uphill to attain 18.93 ⫾ 1.74 J䡠kg⫺1䡠m⫺1at ⫹0.45. This value was only 9.2 ⫾ 2.6% higher than the minimum Cw at the same slope, whereas on the level Cr was 107.3⫾ 49.8% higher than the minimum Cw. During downhill running, Cr de-creased and attained its lowest value at⫺0.20 (1.73 ⫾ 0.36 J䡠kg⫺1䡠m⫺1). At lower slopes it increased again. At⫺0.45, it was 3.92 ⫾ 0.81 J䡠kg⫺1䡠m⫺1. The average minimum Cw and the Cr observed at each investigated slopes are summarized in Table 2.
Table 1. Metabolic parameters of running at the
highest tested speed at each uphill slope Slope
Speed, m/s
V˙O2,
ml䡠 kg⫺1䡠 min⫺1 Heart Rate,min⫺1 Lactate,mM
⫺0.45 1.63⫾0.40 23.2⫾3.3 131⫾36 ⫺0.40 1.86⫾0.30 23.5⫾2.3 122⫾26 ⫺0.35 2.14⫾0.22 22.2⫾3.0 116⫾23 ⫺0.30 2.52⫾0.58 22.0⫾3.1 113⫾17 ⫺0.20 2.84⫾0.39 18.9⫾2.6 100⫾13 ⫺0.10 3.08⫾0.26 23.3⫾5.7 101⫾8 0.00 3.13⫾0.22 35.5⫾2.7 125⫾15 2.30⫾0.73 0.10 2.90⫾0.27 53.0⫾8.6 158⫾11 3.05⫾1.17 0.20 2.11⫾0.27 56.2⫾4.4 168⫾13 3.20⫾0.81 0.30 1.46⫾0.12 58.4⫾2.9 169⫾10 3.47⫾0.77 0.35 1.18⫾0.14 57.5⫾2.6 167⫾12 3.18⫾0.65 0.40 0.99⫾0.10 55.5⫾1.2 169⫾15 3.18⫾0.18 0.45 0.89⫾0.10 52.1⫾4.2 167⫾14 3.16⫾0.46 Values are means ⫾ SD. V˙O2is the overall steady-state oxygen
The vertical cost of walking and running (J䡠kg⫺1䡠mvert⫺1 ) is defined as the energy expenditure to walk or to run a distance that corresponds to a vertical displacement of 1 m. It is plotted in Fig. 2A for walking and in Fig. 2B for running. The vertical cost decreased during uphill running to attain a minimum value of 44.9 ⫾ 3.8
J䡠kg⫺1䡠m⫺1 in the slope range of 0.20–0.40. During downhill running, the vertical cost decreased, to attain a minimum of 9.2⫾ 1.7 J䡠kg⫺1䡠m⫺1in the slope range from ⫺0.20 to ⫺0.40.
The mechanical efficiency for running is shown in Fig. 3. For uphill slopes steeper than⫹0.15, they were 0.243⫾ 0.012 and 0.218 ⫾ 0.06 for walking and run-ning, respectively. For downhill slopes steeper than ⫺0.15, they were ⫺1.215 ⫾ 0.184 and ⫺1.062 ⫾ 0.056, respectively.
DISCUSSION
The present study demonstrates that uphill Cw and Cr data are directly proportional to the slope above ⫹0.15, compatibly with a mechanical efficiency of 0.22–0.24. During downhill locomotion, Cw and Cr show a linear negative relation with the slope below ⫺0.15, compatibly with a mechanical efficiency of ⫺1.06 to ⫺1.21. These results fully support the hypoth-esis of Margaria and co-workers (14, 15), according to which the efficiency of uphill locomotion at sufficiently high slopes ought to become equal to that of concentric muscular work, whereas downhill efficiency ought to become close to that of negative work, i.e.,⫺1.2 (1). It is important to remember that the mechanical effi-ciency mentioned so far is calculated by dividing the potential energy changes by the metabolic consump-tion; thus those values are reliable only when the kinetic energy changes are incomparably smaller and when only positive or only negative work is associated to the motion of the body center of mass. In Fig. 3, the arrow defines the gradient range⫾0.15, within which the mechanical external work of walking (19) and run-ning (20) is still contributed by a mixture of positive and negative work. For steeper positive gradients, the 0.25 efficiency value implies that all the work be done to lift the body: only positive work is done in both gaits, and the descending phase of the pendulum-like and bouncing ball (6) mechanisms of walking and running is lost. By analogy, for steeper negative gradients, the ⫺1.2 efficiency value implies that only negative work is done in both gaits and that the ascending phase of the pendulum-like and bouncing ball (6) mechanisms of walking and running is lost. Because either mecha-nism requires both an ascending and a descending phase of the trajectory to allow for the recovery of mechanical energy, the concept (21) that walking and running, when operated at gradients steeper than the ⫾0.15 range, lose the pendulum-like and the bouncing-ball mechanism, respectively, is reinforced. If this is so, and if we consider how Cw and Cr become close at the steepest gradients, we wonder whether it is legitimate to speak of “walking” or “running” at the steepest slopes. A biomechanical study of walking and running on steep gradient would be required for an appropriate characterization of the gait and for a clear identifica-tion, from the measure of contact times, of the transi-tion from a walkinglike to a runninglike gait when the differences between walking and running tend to dis-appear.
Fig. 1. Metabolic energy cost of walking (Cw; A) or running (Cr; B) as a function of the gradient from the present investigation and from the work by Margaria (14, 15) and Minetti et al. (20, only for running). Minimum energy cost of walking and average energy cost of running for each gradient have been reported. To accurately describe the relationship between Cw or Cr and the gradient i within the investigated range, 5th-order polynomial regressions were per-formed, that yielded
Cwi⫽ 280.5i 5 ⫺ 58.7i4 ⫺ 76.8i3 ⫹ 51.9i2 ⫹ 19.6i ⫹ 2.5 共R2 ⫽ 0.999兲 Cri⫽ 155.4i 5 ⫺ 30.4i4 ⫺ 43.3i3 ⫹ 46.3i2 ⫹ 19.5i ⫹ 3.6 共R2 ⫽ 0.999兲 Gray curves represent the metabolic cost corresponding to a given positive and negative efficiency, according to
Ceff⫽
W˙vert v eff⫽
g sin共arc tan 兩i兩兲
eff
where C is metabolic cost, W˙vertis vertical work rate, v is treadmill
speed, g is gravity acceleration, and eff is efficiency. The eff values for uphill and downhill locomotion, respectively, were chosen as equal to 26% and 150% (solid curve), 24% and 125% (finely dashed curve), and 22% and 100% (grossly dashed curve).
A comparison of the present results with those from previous studies is attempted in all the illustrated figures. Despite of the different methodology involved, the spontaneous speed of transition between walking
and running is similar to the one reported in a subset of gradients (21). Although Cw is very similar to what previously reported (14), as shown in Fig. 1A, Cr seems to resemble the reported data (14, 15, 20) only at level and uphill gradients (see Fig. 1B). This suggests that the athletes presently investigated, specifically trained in fell-running, developed a more economical style than nonathletic subjects during descent. Because little can be done on the path of the center of mass at extreme slopes that could reduce the overall mechanical work, a possible explanation of the greater economy could be the decrease in cocontractions needed to stabilize the descent.
The vertical cost of walking and running on slopes has been introduced (18) to focus on the optimization of
Fig. 2. Metabolic energy cost of walking (A) or running (B), ex-pressed per unit of vertical distance (mvert) as a function of the
gradient, from the present investigation (■), and from Minetti (18), where reprocessed data from Margaria (14, 15) were presented.
Fig. 3. Mechanical efficiency of the work done for the vertical dis-placement of the body during locomotion as a function of the gradi-ent. Data are from the present investigation, from Margaria (14, 15) and from Minetti (20). Double-headed arrow parallel to the x-axis defines the gradient range where the external work of locomotion is contributed by a combination of positive and negative work. Note that the y-axis scale reports the absolute value of efficiency: the sign ought to be negative for downhill locomotion, positive for uphill locomotion.
Table 2. Minimum cost of walking and cost of running at the indicated slopes on the treadmill
Slope Cw Cr Slope Cw Cr Slope Cw Cr
⫺0.45 n⫽10 n⫽9 0 n⫽10 n⫽30 0.45 n⫽10 n⫽6 3.46⫾0.95 3.92⫾0.81 1.64⫾0.50 3.40⫾0.24 17.33⫾1.11 18.93⫾1.74 ⫺0.40 n⫽10 n⫽13 0.40 n⫽10 n⫽6 3.23⫾0.59 3.49⫾0.47 14.75⫾0.61 16.83⫾0.88 ⫺0.35 n⫽10 n⫽18 0.35 n⫽10 n⫽12 2.65⫾0.68 2.81⫾0.54 12.72⫾0.76 14.43⫾1.08 ⫺0.30 n⫽10 n⫽24 0.30 n⫽10 n⫽24 2.18⫾0.67 2.43⫾0.50 11.29⫾1.14 12.52⫾0.62 ⫺0.20 n⫽10 n⫽24 0.20 n⫽10 n⫽30 1.30⫾0.48 1.73⫾0.36 8.07⫾0.57 8.92⫾0.84 ⫺0.10 n⫽10 n⫽24 0.10 n⫽10 n⫽30 0.81⫾0.37 1.93⫾0.45 4.68⫾0.34 5.77⫾0.60
mountain paths. It was concluded that for walking the gradient minimizing the metabolic cost should be ⬃0.25–0.28, both uphill and downhill. This concept is essentially supported by the present results (see Fig. 2A), though the minimum vertical cost for downhill walking looks broader than expected. In running, it was previously impossible to estimate such an opti-mum gradient, mainly because of the limited slope range available (see Fig. 2B, open circles). The present work, by extending the slope range to ⫾0.45, shows that it is similar to the one for walking, despite the broader minima: these probably reflect the athletes’ ability to perform in very different conditions (see Fig. 2B). Particularly at downhill gradients, at which ath-letes report a 30–50% reduction in the vertical cost, a better technique allowing a greater recovery of elastic energy could be responsible for the increased economy. From the results of the present investigation, it is now possible 1) to estimate the maximum (aerobic) running speed as a function of both positive and neg-ative gradient and 2) to compare it with the best results from uphill-only and downhill-only races, avail-able from official mountain Federation of Sport at Altitude competitions.
As indicated in METHODS, the metabolic energy cost (Crv,i, in J䡠kg⫺1䡠m⫺1) of running a unit distance at any given speed and gradient has been calculated as
Crv,i⫽
E˙v,i
vi
(2)
where E˙v,iis the net metabolic power (W/kg) measured
during the experiments. It is widely known, and it was confirmed by this study too, that Crv,ichanges at each
gradient i (see Fig. 2), but it is quite constant at all running speeds within every single gradient; thus the index v can be removed from that symbol. Such a peculiar characteristic of running, so different from
other gaits such as walking, allows estimation at each gradient of the maximum running speed (vmax,i, m/s). The previous equation can be expressed as
vmax,i⫽ E˙max,i
Cri
(3)
where E˙max,iis the maximum oxygen consumption (in W/kg) of the subjects group (11). Because only a frac-tion of the maximum metabolic power (E˙sub max,i) can be used to sustain aerobic exercise in long-lasting events (see below), and this last parameter is obviously independent from i, the last equation becomes
vmax,i⫽
E˙sub max Cri
(4)
Once the numerator in Eq. 2 has been set, say 18 W/kg, the maximum running speed is obtained, as shown by the thick curve in Fig. 4. Those estimates linearly scale with the maximum aerobic power or its sustainable fraction, as indicated by the other two curves in Fig. 4. The same applies to the calculation of the maximum vertical speed of running (vmax vert, mvert/s), as obtained from
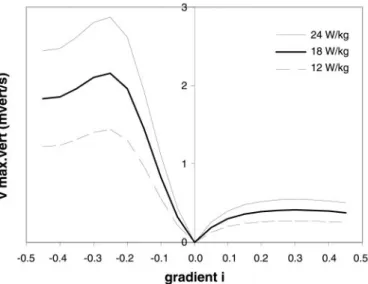
vmax vert,i⫽ vmax,isin共arc tan 兩i兩兲 (5) and shown in Fig. 5 for three levels of available meta-bolic power. For instance, vmax vertwas estimated to be ⬃2.1 and 0.4 mvert/s for downhill (i⫽ ⫺0.25) and uphill (i ⫽ ⫹0.25) gradients, respectively, for a V˙O2 submit equal to 18 W/kg.
To compare these estimates to the real running speeds, as observed during competition, we could not expect the race results to follow a single curve in Fig. 4 or 5, because, even assuming that all the athletes report the same maximum aerobic power, two other main variables affect the available metabolic power during the event, even for the same average gradient. Fig. 4. Maximum running speed on the incline, as a function of the
gradient, as predicted by combining Eqs. 2 and 3. The 3 curves refer to different submaximal oxygen consumption (V˙O2 submax) values (net
metabolic powers of 12, 18 and 24 W/kg).
Fig. 5. Maximum running speed, expressed in vertical meters per second, vs. gradient, as predicted by combining Eqs. 2 and 3. The three curves refer to different V˙O2 submaxvalues (net metabolic
In fact, it is known that the available fraction of V˙O2 max (E˙max,i) depends on the exercise duration (fractduration) (23) and on the altitude above sea level (fractaltitude) (7) at which the exercise is performed, and both effects are strongly involved in gradient running events. Thus we could write
E˙sub max⫽ E˙maxfractdurationfractaltitude (6) where
fractduration⫽
940⫺tevent 60
1,000 (7)
adapted from Saltin (24), where tevent is the event duration, and
fractaltitude⫽ 1 ⫺ 11.7 䡠 10⫺ 9altitude2
⫺ 4.01 䡠 10⫺ 6altitude (8) from Cerretelli (7). In Eqs. 7 and 8, teventand altitude are expressed in seconds and meters, respectively.
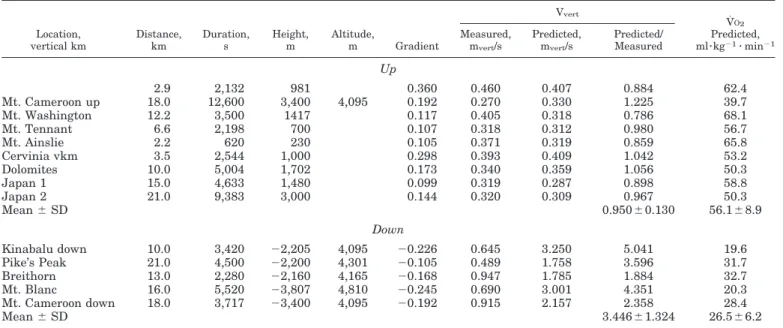
Table 3 reports data available from the Internet about some only-uphill and only-downhill running races. When the event best time, the distance traveled, the difference in altitude and, sometimes, the maxi-mum altitude reached are known, the average gradient and the predicted vmax,iand vmax vert can be calculated by using Eqs. 3-8. In the sample of events shown in the table, the striking result is the very close match be-tween predicted and measured maximum vertical speed in uphill running (their ratio is 0.950 ⫾ 0.130), whereas predicted speed for downhill races overesti-mates the measured one by a factor of 3 (their ratio is 3.446⫾ 1.324), as shown in Fig. 6.
Such a discrepancy is astonishingly too large to be explained in terms of differences in muscular efficiency
only. In downhill competitions, athletes do not seem to use the full amount of the available aerobic power for increasing their speed. The reasons should be method-ological and/or inherent in reproducing an outdoor con-dition in the laboratory. In the following, a list of potential determinants of such a speed choice is
re-Fig. 6. Predicted maximum vertical speed vs. actual vertical speed as reported from mountain-running competitions. Predictions were made according to Eqs. 3–8 and the data regarding distance, dura-tion, and average altitude. Only uphill (gray circles) and only down-hill (E) competitions are reported. The assumption of a maximal rate of aerobic energy expenditure of 22.6 W/kg was made.
Table 3. Predicted versus actual performances during uphill and downhill competitions
Location, vertical km Distance, km Duration, s Height, m Altitude, m Gradient Vvert V˙O2 Predicted, ml䡠kg⫺1䡠 min⫺1 Measured, mvert/s Predicted, mvert/s Predicted/ Measured Up 2.9 2,132 981 0.360 0.460 0.407 0.884 62.4 Mt. Cameroon up 18.0 12,600 3,400 4,095 0.192 0.270 0.330 1.225 39.7 Mt. Washington 12.2 3,500 1417 0.117 0.405 0.318 0.786 68.1 Mt. Tennant 6.6 2,198 700 0.107 0.318 0.312 0.980 56.7 Mt. Ainslie 2.2 620 230 0.105 0.371 0.319 0.859 65.8 Cervinia vkm 3.5 2,544 1,000 0.298 0.393 0.409 1.042 53.2 Dolomites 10.0 5,004 1,702 0.173 0.340 0.359 1.056 50.3 Japan 1 15.0 4,633 1,480 0.099 0.319 0.287 0.898 58.8 Japan 2 21.0 9,383 3,000 0.144 0.320 0.309 0.967 50.3 Mean⫾ SD 0.950⫾0.130 56.1⫾8.9 Down Kinabalu down 10.0 3,420 ⫺2,205 4,095 ⫺0.226 0.645 3.250 5.041 19.6 Pike’s Peak 21.0 4,500 ⫺2,200 4,301 ⫺0.105 0.489 1.758 3.596 31.7 Breithorn 13.0 2,280 ⫺2,160 4,165 ⫺0.168 0.947 1.785 1.884 32.7 Mt. Blanc 16.0 5,520 ⫺3,807 4,810 ⫺0.245 0.690 3.001 4.351 20.3 Mt. Cameroon down 18.0 3,717 ⫺3,400 4,095 ⫺0.192 0.915 2.157 2.358 28.4 Mean⫾ SD 3.446⫾1.324 26.5⫾6.2
ported in descending order for relevance (and likeli-hood).
1) During downhill running, other criteria such as
the maintenance of a reasonable safety factor could be operating to minimize joint and tissue injuries. It is likely that at extreme downhill slopes muscles could not cope with the tendency of the body to accelerate, rather than maintaining a constant speed throughout a controlled constant braking. That would result in the lack of the fine motor control needed to maintain body trajectory on a rough and slippery terrain. Among the associated risks is the iliotibial band friction syndrome, more frequent in downhill running because the knee flexion angle at foot strike is reduced (22, 23), and the intravascular hemolysis due to foot impact forces (17) is high.
2) Methodological issues could have led a) to
under-estimation of Cr because of the differences in terms of path geometry and surface properties between the rough terrain and the smooth treadmill surface, a discrepancy particularly accentuated for downhill gra-dients because of the much higher speeds involved; and
b) to overestimation of vmax,i(and vmax vert) because the prediction for each gradient has been made outside the investigated speed range (extrapolation) by assuming Cr speed independent.
3) It has also been reported that, particularly in
downhill running, a) a stricter alignment of locomotor-respiratory coupling occurs (25), which could be dis-rupted by even a slight increase in speed and related stride frequency; b) the motoneuron pool excitability decreases (3), with effects on the overall motor control; and c) a time-dependent upward drift of V˙O2 (⫹10%, which should proportionally increase Cr), and increase in EMG activity (9) take place.
This analysis points out how in competitive downhill running, differently from the uphill situation and many other sport activities, “power without control is nothing.” To verify the relative contribution and the relevance of the hypothesized list of determinants for choosing to run slower than metabolically possible at extreme downhill gradients, further experiments on the capacity of the neuromusculoskeletal system to brake the body motion are needed.
In conclusion, the present study extends the pre-vious literature about the economy of locomotion to include extreme slopes up to ⫾0.45, an unprece-dented range particularly for running. The results show that 1) the minimum in energy cost is similar in walking and running at⬃0.10–0.20 downhill gra-dient; 2) the optimum gradient for mountain paths is close to 0.20 – 0.30, both uphill and downhill, for the two gaits; 3) a better progression economy is ex-pected in mountain-running athletes in the downhill range; and 4) the running speeds adopted in downhill competition are far lower than metabolically feasi-ble, mainly because of safety reasons. If athletes wish to improve their performances in competitions alternating ascent and descent phases, they should pay greatest attention to the training of movement coordination during downhill running.
We are indebted to Marino Giacometti, President of the Interna-tional Altitude Sport Federation, for invaluable help in the organi-zation of this study.
This work was supported by a grant from the Federal Office of Sport, Macolin, Switzerland, and from the International Altitude Sport Federation, Biella, Italy.
G. S. Roi is presently at Isokinetic Rehabilitation Center, Bologna, Italy.
REFERENCES
1. Abbott B, Bigland B, and Ritchie JM. The physiological cost of negative work. J Physiol 117: 380–390, 1952.
2. Ardigo` LP, Lafortuna C, Minetti AE, Mognoni P, and Saibene F. Metabolic and mechanical aspects of foot landing
type, forefoot and rearfoot strike, in human running. Acta
Physiol Scand 155: 17–22, 1995.
3. Bulbulian R and Bowles DK. Effect of downhill running on motoneuron pool excitability. J Appl Physiol 73: 968–973, 1992. 4. Bobbert AC. Energy expenditure in level and grade walking.
J Appl Physiol 15: 1015–1021, 1960.
5. Brueckner JC, Atchou G, Capelli C, Duvallet A, Barrault
D, Jousselin E, Rieu M, and di Prampero PE. The energy
cost of running increases with the distance covered. Eur J Appl
Physiol 62: 385–389, 1991.
6. Cavagna GA, Thys H, and Zamboni A. The sources of exter-nal work in level walking and running. J Physiol 262: 639–657, 1976.
7. Cerretelli P. Limiting factors to oxygen transport on Mount Everest. J Appl Physiol 40: 658–667, 1976.
8. Davies CTM, Sargeant AJ, and Smith B. The physiological responses to running downhill. Eur J Appl Physiol 32: 187–194, 1974.
9. Dick RW and Cavanagh PR. An explanation of the upward drift in oxygen uptake during prolonged sub-maximal downhill running. Med Sci Sports Exerc 19: 310–317, 1987.
10. Di Prampero PE. The energy cost of human locomotion on land and in water. Int J Sports Med 7: 55–72, 1986.
11. Di Prampero PE, Atchou G, Bru¨ ckner JC, and Moia C. The
energetics of endurance running. Eur J Appl Physiol 55: 259– 266, 1986.
12. Dill DB. Oxygen used in horizontal and grade walking and running on the treadmill. J Appl Physiol 20: 19–22, 1965. 13. Lejeune TM, Willems PA, and Heglund NC. Mechanics and
energetics of human locomotion on sand. J Exp Biol 201: 2071– 2080, 1998.
14. Margaria R. Sulla fisiologia e specialmente sul consumo ener-getico della marcia e della corsa a varia velocita` ed inclinazione del terreno. Atti Accademia Nazionale dei Lincei 7: 299–368, 1938.
15. Margaria R, Cerretelli P, Aghemo P, and Sassi G. Energy cost of running. J Appl Physiol 18: 367–370, 1963.
16. Martin PE. Mechanical and physiological responses to lower extremity loading during running. Med Sci Sports Exerc 17: 427–433, 1985.
17. Miller BJ, Pate RR, and Burgess W. Foot impact force and intravascular hemolysis during distance running. Int J Sports
Med 9: 56–60, 1988.
18. Minetti AE. Optimum gradient of mountain paths. J Appl
Physiol 79: 1698–1703, 1995.
19. Minetti AE, Ardigo` LP, and Saibene F. Mechanical determinants
of gradient walking energetics in man. J Physiol 471, 725–735, 1993. 20. Minetti AE, Ardigo` LP, and Saibene F. Mechanical
determi-nants of the minimum energy cost of gradient running in hu-mans. J Exp Biol 195, 211–225, 1994.
21. Minetti AE, Ardigo` LP, and Saibene F. The transition between
walking and running in man: metabolic and mechanical aspects at different grades. Acta Physiol Scand 150: 315–323, 1994. 22. Noble CA. Iliotibial band friction syndrome in runners. Am J
Sports Med 8: 232–234, 1980.
23. Orchard JW, Fricker PA, Abud AT, and Mason BR. Biome-chanics of iliotibial band friction syndrome in runners. Am J
24. Saltin B. Oxygen transport by the circulatory system during exercise in man. In: Limiting Factors of Physical Performance, edited by Keul J. Stuttgart: Thieme, 1973, p. 235–252. 25. Takano N. Phase relation and breathing pattern during
loco-motor/respiratory coupling in uphill and downhill running. Jpn
J Physiol 45: 47–58, 1995.
26. Woledge RC, Curtin NA, and Homsher E. Energetic Aspects
of Muscle Contraction. London: Academic, 1985, p. 267.
(Mono-graphs of the Physiological Society 41)
27. Zamparo P, Perini R, Orizio C, Sacher M, and Ferretti G. The energy cost of walking or running on sand. Eur J Appl