Cooperative sound design: A protocol analysis
Stefano Delle Monache
Department of Architecture and Arts Iuav University of Venice
Venezia, Italy
[email protected]
Davide Rocchesso
Department of Architecture and Arts Iuav University of Venice
Venezia, Italy
[email protected]
ABSTRACT
Formal protocol analysis and linkographic representations are well-established approaches in design cognition studies, in the visual domain. We introduce the method and tools in the auditory domain, by analysing a case of collaborative sound design. We show how they can provide relevant qual-itative and quantqual-itative information about the efficiency of the creative process.
CCS Concepts
•Applied computing → Sound and music computing; •Human-centered computing → Scenario-based design;
Keywords
Protocol analysis; Linkography; Sonic interaction design
1.
INTRODUCTION
Despite of the several interactions and exchanges with clients and teams, sound designers often approach the cre-ative process as a solipsistic activity. The typical situation is that of sitting in front of a computer, with a bunch of soft-ware tools and an audio system, transforming early ideas into refined realizations. This looks surprising to rational scrutiny, as in most other areas of design the process is ex-tensively cooperative. It is more surprising if we observe that humans mainly use sounds to communicate to other humans, and even come together for the mere purpose of enjoying the cooperative production of sound (a.k.a. mu-sic).
There may be multiple reasons for this state of affairs, such as the lack of a shared design language among stake-holders [1], working conditions under pressing time con-straints, or simply the general availability of sound design tools which do not afford nor support the immediacy of co-operative processes. It would be interesting to analyze these aspects, however this is not the focus of this paper.
Permission to make digital or hard copies of all or part of this work for personal or classroom use is granted without fee provided that copies are not made or distributed for profit or commercial advantage and that copies bear this notice and the full cita-tion on the first page. Copyrights for components of this work owned by others than ACM must be honored. Abstracting with credit is permitted. To copy otherwise, or re-publish, to post on servers or to redistribute to lists, requires prior specific permission and/or a fee. Request permissions from [email protected].
AM ’16, October 04-06, 2016, Norrköping, Sweden c
2016 ACM. ISBN 978-1-4503-4822-5/16/10. . . $15.00 DOI:http://dx.doi.org/10.1145/2986416.2986424
As researchers, we have been working at subverting the current sound design practices by means of workshops, edu-cation activities, and tools for cooperative sound design [3]. In this paper, we introduce linkographic analysis as a for-mal method to understand the efficiency of the design pro-cess. In particular we analyze how individuals cooperate to tackle a sound design task as a group. The task, proposed in the context of educational research, is that of imagining and creating the engine sound for a concept car, and presenting it in the form of a soundtrack added to a silent video of the car in motion [2].
1.1
The design task
The design task was proposed in the workshop held at Aalborg University Copenhagen, Master in Sound and Mu-sic Computing1, in November 2015. Twenty-two master stu-dents, split in six teams, attended the workshop and experi-enced a week of activities around the theme of sonic sketch-ing.
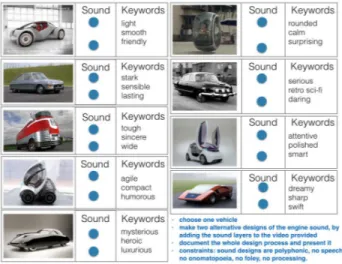
Figure 1: The design task.
The task at hand was introduced after a set of prepara-tory exercises aimed at fostering team-building and the use of physical props, Foley techniques, and vocalizations as col-laborative means to quickly produce and shape sound design ideas. In particular, the assignment requires to choose one concept car among nine items, shown in Figure 1, and sketch the sound for the chosen vehicle. Three keywords and two
1
referent sounds were associated to each car. The time con-straint to deliver the edited video was set to sixty minutes. We devised three different sound production conditions, one condition per pair of groups: 1) vocalizations only; 2) Foley only; 3) sound synthesis, sampling and processing only, in order to compare the quality and creativity of the sketch-ing processes. The comparative analysis is not discussed in this paper, instead we focus on the application of linko-graphic analysis methods to the sketching process of one group under the first condition, that is the exclusive use of vocalizations.
Specific constraints under vocal sketching condition in-cluded the production of polyphonic sketches, no speech, nor onomatopoeias, and no sound processing. The six par-ticipants in the team were encouraged to cooperate and to use their voice to accomplish the task, and they were allowed to use their favorite software for basic editing and montage operations. In practice, they could import the silenced video in iMovie2or alike, record individual or choral vocalizations, and layer them in the multitrack. Only syncing, mixing, and basic editing (cut, fade in/out) operations were allowed.
1.2
Protocol analysis of the design process
The whole groupwork was audiovisually recorded by a free-running camera, steadily positioned on a tripod. Work-ing in group, the designers are naturally inclined to express their thoughts aloud, using whatever means they have at their disposal, namely spoken words, non-verbal vocal ex-pressions, and gestures. The audiovisual recording is there-fore a rich source of information that can be parsed through protocol analysis to extract the most relevant dynamics of the design process.
Protocol analysis is a commonly used method to study design cognition and it relies on segmenting the design pro-cess, developing a coding scheme, and categorizing the seg-ments [6]. It is usually made possible by enforcing a think-aloud protocol, where participants are asked to say whatever comes into their mind as they proceed through their task. In the case of collaborative sound design no such enforcement is needed, and the researcher can actually be somewhere else while the design process is ongoing, thus eliminating possible sources of unnaturalness and conditioning. The re-searcher will only act afterwards, by processing the collected audiovisual documentation.
Typically, protocols are parsed in analysis units (i.e., de-sign moves), minimal sequential acts in the process that change the situation at hand. These small increments in thought are further composed of arguments, the smallest semantic units which, taken together, support a comprehen-sible concept. The length of the moves may vary according to the parsing scheme and the level of detail of the study. For example, the segmentation may be time-based, take in account turn-taking in the case of teamwork, decision-making processes, or context-specific conventions set by the researcher.
Once the process has been segmented, it becomes neces-sary to encode its units according to a scheme of categoriza-tion.
1.3
The Function-Behavior-Structure code
The Function-Behavior-Structure (FBS) ontology of de-sign is here used to develop a coding of elementary dede-sign
2
http://www.apple.com/mac/imovie/.
moves [5]. This generic categorization scheme was developed with the aim to be valid across design domains and design tasks. The codes used are:
F Function, the teleology of the artifact, what it is for; Be expected Behavior, as expected from the Function or
from the configuration of the artifact, the Structure; Bs structural Behavior, as derived from the artifact
con-figuration;
S Structure, the constitutive elements and their relation-ships forming the artifact configuration;
D Documentation, the set of design descriptions as out-come of the FBS process.
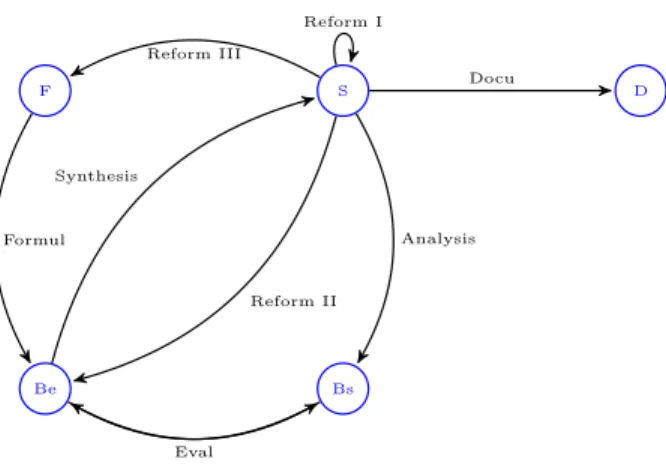
According to the FBS ontology proposed by Gero [14, 5], these codes correspond to the states of the finite automaton of figure 2, where the arcs are labeled according to design processes:
1 Formulation, the act of transforming the set of func-tions into a set of expected behaviors;
2 Synthesis, the emergence of a configuration suitable to perform the expected behavior;
3 Analysis, the inquiry of the configuration produces derived behavior;
4 Evaluation, the expected behavior is compared against the behavior derived from the structure;
5 Documentation, the process of storing and designat-ing final or partial designs, through craftdesignat-ing;
6 Reformulation I implies a revision of the configura-tion;
7 Reformulation II affects the set of expected behaviors as a consequence of the emerging structure;
8 Reformulation III redefines the teleology of the arti-fact as a consequence of the emerging structure.
F Be Bs S D Formul Synthesis Analysis Eval Docu Reform I Reform II Reform III
Figure 2: Design moves as transitions in a finite-state automaton.
In the case of collaborative sound design, the source ma-terials to be coded are not only verbalizations, but also
non-verbal vocalizations and gestures, as the three commu-nication channels may all contribute to develop a sound-design discourse. Once the audiovisual material has been segmented to extract the relevant elements in the three chan-nels, the segments are put in relation with each other using the finite-state automaton of figure 2. This creates links between design moves, and the extraction of information from this network of links is what design theorists call linko-graphic analysis [8].
1.4
Design moves in a network of links
A linkograph is a potential source of insight to better un-derstand the design process, and quantitative statistical in-dicators can be extracted and used to make comparisons across teams, or tasks, or strategies [13, 12].
Typically, the researcher analyzes the parsed protocol and decides whether there is a link between two or more design moves, based on their contents. Being this an interpretive activity based on “common sense”, it is necessary to have more than one coder in order to ensure intersubjective ver-ification and consensus around the occurrence of links.
As shown in the example in Figure 3, links emerge as nodes of the reasoning, that can be established as forward or backward, based on their contents. Forelinks denote acts of synthesis. Backlinks reveal evaluation steps in design think-ing.
Figure 3: Example of linkograph with four moves. Move 1 has forelinks to moves 2 and 3. Move 3 shows a backward link to move 1 and a forward link to move 4.
In this paper we show how protocol analysis can be ap-plied to collaborative sound design sessions, and how sen-tences, vocalizations, and gestures can be extracted, coded, and related to each other to extract qualitative and quan-titative summaries of design processes. This is exemplified through the analysis of a group of six master students in sound and music computing, collaborating to design and video-prototype the engine sound of a concept car, as de-scribed in section 1.1.
In section 2 we describe the software tools that we have been using to prepare and perform the protocol analysis. In section 3 we analyze the early minutes of the design session, which were used to calibrate the analysis and to collect some descriptors of short-term interactions among participants. Finally, we report some early observations about the whole session.
2.
THE TOOLS AND THEIR USE
Elan is a freeware audio/video annotation software pro-duced by The Language Archive project at the Max Planck Institute for Psycholinguistics, in Nijmegen3. It is widely
used in speech and gesture research. For our purpose, the whole recorded session was loaded as a single audiovisual track, and parsed in six annotation tracks, one per partici-pant. Each track contained three types of annotation tiers,
3
https://tla.mpi.nl/tools/tla-tools/elan/
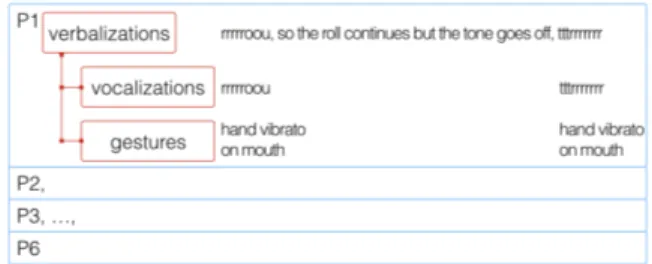
verbalizations, non-verbal vocalizations, and gestures, ac-cording to the organization shown in Figure 4.
Figure 4: Example of transcription. Non-verbal vo-calizations and gestures are always set as subtiers of the verbalization tier.
Author SDM isolated the expressed actions or intentions [6] of the participating designers, and produced segments that contain the text transcriptions of relevant verbalizations, vo-calizations, and gestures. Vocalizations are represented as sequences of letters in an informal onomatopoetic comic-like style, and gestures are verbally described. Vocalizations and gestures are always subtiers of a parent tier, which may or may not contain text. Indeed, there are frequent non-verbal interactions in which design intentions are expressed through voice and gestures only. In these cases, the par-ent tier is empty. Author DR reviewed the transcription, introducing minor adjustments.
From Elan a tab-delimited text file was exported, contain-ing each segment transcription as a row, with author type label (e.g., P1_v would be the label for vocalizations pro-duced by participant P1) and time information.
The text file was imported in Excel where the label and annotation text columns were merged, and inserted in the .xls template of the software LINKOgrapher4[16]. At this stage, absolute temporal information is neglected, as linko-graphic analysis is only based on a discrete temporal logic.
In Excel, the transcription were further refined by: (i) removing empty text segments, (ii) swapping some rows so that the vocalizations and gestures of a given participant that are children of a text, occur after that text, (iii) fixing text if needed.
Together, the authors went through the transcriptions of the early five minutes of recorded material, to assign FBS codes and links. The LINKOgrapher software allowed to produce a compact linkograph of this subsession, which was printed out and manually adjusted on paper by the first author. Both the authors went through the transcription once more discussing and introducing modifications in codes and links.
Codes and links were inserted in the .xls sheet as columns, and special care was used to insert codes and links that are compatible with the transitions of the FBS automaton. The LINKOgrapher software extracts general statistics as well as parameters of dynamic models proposed in the literature for design processes [13, 12].
3.
THE EARLY FIVE MINUTES
4https://sites.google.com/a/linkographer.com/
Summary: the group works on the top-rightmost con-cept hover car5, in Figure 1. The group starts with a free discussion on the overall sound identity of the hover car. From a confused brainstorming, the group progressively dis-entangles the design of a few functions of the car (i.e., igni-tion, engine idling, engine revs-up, braking), from the sound composition of the car motion (e.g., syncronization and tem-poral unfolding of the functional sounds). A first collabora-tive sketch of the whole video is produced.
3.1
Converging to a coding procedure
From the researchers viewpoint, the early five minutes of audiovisual recording were used to converge to a shared prac-tice of coding and linking. In particular, the first few dozens of segments served to let an agreed procedure emerge, and they needed to be made homogeneous with the rest of the labeling, through adjustments and simplifications in codes and links.
Some major decisions were taken during this early stage (examples refer to the linkograph of the early five minutes, depicted in figure 5):
- When the participants record a collective vocalization they are actually producing documentations, defined as external representations. External representations and their acts are labeled as D;
- Documentations are prone to interpretations, corresponding to the seeing-as stage in the mind/knowledge ←→ sketch/ representation loop [7]. Interpretive acts result in new knowl-edge and manifest in the seeing-that production of new forms (either lateral or vertical). According to the FBS ontology, seeing-as links are interpretive acts of depicted structures, and are represented by the connection D > S. Since this transition is not represented as a process in the automaton, it was decided that occurring D > S connections would also include backlinks to the latest structural element S that led to the production of the corresponding external representa-tion D. For example, participant P1 makes a D > S con-nection at segment 59. His vocalization is the interpretive result of the rolling-sound D representation at segment 32, and segment 59 is also backlinked to the structural vocal-ization at segment 27 (which is forelinked to segment 32); - Normally, vocalizations and gestures occur as propositions
within verbal-thinking acts (e.g., segment 12). However, since they represent descriptions of structural elements, they have been always labeled as S, despite of the nature of the parent verbalization (Bs, Be, or S, e.g., segment 13.). In some cases, when vocalizations, accompanied by gesture or not, occur as autonomous acts, these may take other forms too, Be or Bs (e.g., segment 64);
- When gestures are functional to a vocalization, i.e. they are used to physically affect the vocal production (e.g., segment 29, damper effect), they are linked to the corresponding vo-cal utterance. Instead, gestures that are complementary to a vocalization, i.e. they add further iconic descriptions of the behavioral/structural elements at hand, have been solely linked to the referent parent segment. For example the shaky gesture at segment 49 and the braking gesture at segment 55 are meant to indicate certain aspects of the sound, hence adding concrete details to the overall synthesis process.
5
The group was provided with an extract of the videoclip available at https://www.youtube.com/watch?v= JWh2qT9yiTo, for educational purpose.
3.2
Qualitative description of the linkograph
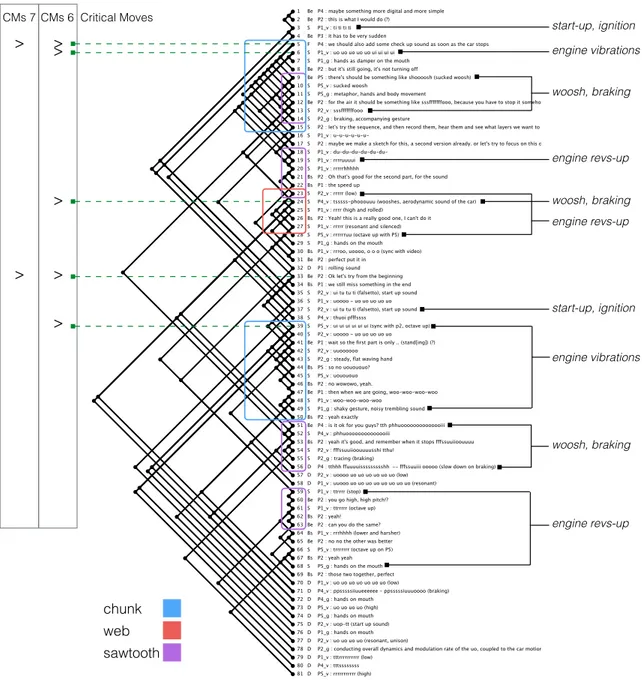
The linkograph of the 81 segments corresponding to the early five minutes of the cooperative design process is de-picted in Figure 5.
In linkographic analysis, a chunk is a group of moves that are almost exclusively linked among themselves; chunks rep-resent the in-depth examination of a topic, or in other words lines of thought focused on a specific design element. Con-nections between chunks can reveal the examination of re-lated questions or different viewpoints in approaching the the problem at hand. Connections between distant chunks in the linkograph may mean the resume of a design problem that was abandoned or put in stand-by. Chunks describe the structure of the thinking process.
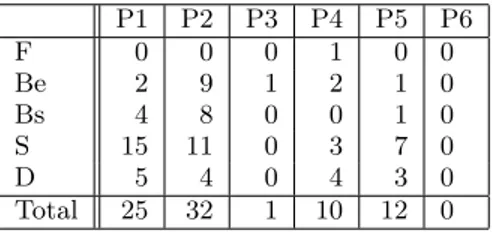
A web is a group of a few moves related by a high density of inter-links. Webs are smaller than chunks, and indicate a step in the process intensely focused on inspecting a certain issue. Finally, a sawtooth track is a sequence of at least four linked moves, signifying that the process is mostly proceed-ing linearly [8, 13]. P1 P2 P3 P4 P5 P6 F 0 0 0 1 0 0 Be 2 9 1 2 1 0 Bs 4 8 0 0 1 0 S 15 11 0 3 7 0 D 5 4 0 4 3 0 Total 25 32 1 10 12 0
Table 1: Participants role taking based on the oc-currence of codes in the early five minutes.
The visual inspection of the linkograph of the early five minutes, in Figure 5, highlights interesting dynamics in co-operative sonic sketching:
- In the first twenty moves, a brainstorming process, mainly carried out individually or in a pair, is focused on under-standing and distilling the basic sound elements of the sketch, and namely i) a start-up ignition sound, ii) the engine vibra-tions, iii) the aerodynamic component of the engine sound, especially associated with the car braking, and iv) the en-gine revs-up. The ignition sound is proposed individually by P1 at move 3. At move 4, P4 stresses the need (i.e., a function F) of some acoustic warning for emphasizing the car deceleration and stop. This is formulated as expected behavior (Be) in terms of a woosh braking sound by P5 and P2 at moves 9 and 12. Meanwhile, P1 proposes a sound for the engine vibrations at move 6. Finally, the last ele-ment, the engine revs-up sound emerges from the individual proposition of P1 again, at moves 18 and 19;
- From the groupwork dynamics viewpoint, these early steps show how participants apply for a role by taking over a spe-cific task, and progressively balance and optimize the cre-ation pace into cooperative sketching. This phase ends at move 15, when P2 proposes to synthesize the propositions in a first recording. This early process as a whole is high-lighted by the corresponding chunk in the blue-framed box. In addition, the role taking is reflected in Table 1 which shows the occurrence of codes per participant in the early five minutes. It is evident that P2 takes a leading role, with the highest and balanced occurrence of moves and codes. P1 is the most productive in terms of synthesis elements, as his
chunk web sawtooth start-up, ignition engine vibrations woosh, braking engine revs-up woosh, braking engine revs-up start-up, ignition engine vibrations woosh, braking engine revs-up CMs 7 CMs 6
>
>
>
>
>
>
>
Critical MovesFigure 5: The linkograph of the early five minutes.
activity on the engine vibrations and revs-up is especially concentrated in the sawtooth boxes, in the only web box, and in the second chunk box. P5 is mainly supporting the process, with a well-balanced presence spanned throughout the chunks and the web. P4 actually triggers the process, by setting the first function at move 5, however he is left in an apparently marginal role, mainly taking care of a few linear iterations of the aerodynamic braking sound (sawtooth at move 51). P3 and P6 are inactive at this stage;
- It has to be noted that the description of the participants role taking is not directly related to the quality of their par-ticipation in the design process. Indeed, their activism is related to the number of critical moves per participant.
Moves with a high number of links have been defined as critical, as they designate synthesis instances which result crucial for the quality and creativity of the design process.
Critical moves can be forward (CMs>), backward (<CMs), or bidirectional (<CMs>) [13]. Normally, the links thresh-old is set by the researchers, based on the depth of the linko-graphic analysis. For this purpose, given the coding conven-tion of a general dependency of vocalizaconven-tions and gestures on verbal propositions (as described in Section 3.1), we set a threshold of 6 and 7 links to highlight in Figure 5 the critical moves in the early five minutes. These moves represent the peculiar turning points in the unfolding of the cooperative design process. Hence, we can speculate that apparently less productive participants may play a significant role in the process instead, if they show segments coded as criti-cal. This is the case of P5 at move 39 and P4 at moves 5 and 24. In particular, by setting the critical threshold to 5, one can see how influential are P4 forward critical moves. The summary of the critical moves per active participant,
for thresholds of 5, 6, and 7 links, is reported in Table 2. CMs5> CMs6> CMs7> P1 2 1 0 P2 2 1 1 P4 2 2 1 P5 2 1 0 Total 6 5 2
Table 2: Critical moves per active participant.
The emerging critical path represents a summary of the most influent steps in the design process: Move 5 triggers the whole reasoning, moves 6 and 24 indicate a strong con-sensus around the two propositions at hand, respectively the engine vibrations sound and the woosh braking. Moreover, the early critical move at segment 6 suggests that the group adopted the very first sound idea proposed by P1. This proposition, although established and shared by the group, is iterated and object of a deep analysis, reformulations and evaluation in the chunk highlighted by the critical move at segment 39. Move 33 by P2 is different in nature, since it af-fects the pace of the process by re-organizing the sound ma-terials before their actual documentations. It sets the break in the workflow, where exploration converges to clarification and ultimately to resolution (i.e., documentation) [9].
The combination of critical moves with different peculiar networks of links (chunks, web, sawtooths) shows how the funnel of design iterations unfolds, in the stages of concepts (moves 5 - 17), exploration (moves 18 - 32), clarification (moves 33 - 69), and resolution (moves 70 - 81).
The sound sketching iterations are all set in the early twenty moves: the start-up ignition sound is proposed at move 3 and mostly accepted as it was; the analysis of the aerodynamic woosh sound for the braking function is some-what left behind, in the background of the process, with a linear iteration of a few moves in the sawtooth at move 51; the two sound items for the engine vibrations and revs-up are object of a deeper discussion, as highlighted by the chunks and sawtooths, in Figure 5. However, their most sig-nificant iterations, respectively at moves 39 and 59, occur when the overall process is at a clarification stage, just be-fore resolving the documentations. This suggests that the two sounds mostly underwent a process of refinement, or vertical transformation of the two early ideas proposed at the very beginning.
3.3
Quantitative description of the linkograph
Some general statistics are reported for the early five min-utes, as they give a general idea about segments and links:
- Number of segments: 81 were retained for coding out of 109 extracted from ELAN export;
- Number of links: 124. The link index, an indicator of linking activity, is of 1.53 links per segment;
- Average segment length: 7.35 seconds, computed on non-empty segments;
- The occurrence of different FBS categories is reported in table 3.
The average duration of segments is in line with previous studies on linkographic analysis in the visual domain [8]. The link index is not necessarily an indicator of creativity
Code Segments F 1 1.2% Be 14 17.3% Bs 13 16.0% S 37 45.7% D 16 19.8%
Table 3: FBS codes in the early five minutes.
or good design, as high ratios between the number of links and the number of moves may hide repetitions or discontin-uous explorations of alternative ideas. Nonetheless, it is an indicator of productivity. Structure codes are the most in-fluential elements in this session, thus suggesting a tendency to support and confirm the behavioral elements as they are.
Taken together, these basic statistics tell us of a process which is mainly focused on searching a shared and steady arrangement and progression, certainly to the detriment of creative and out-of-the-box solutions.
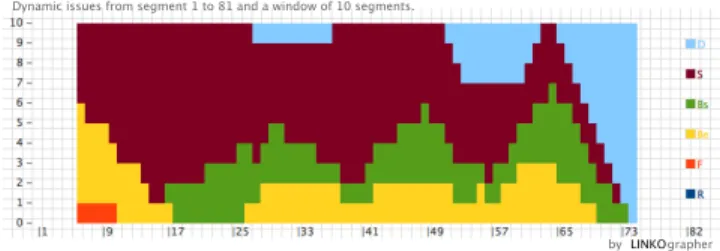
Figure 6: Temporal distribution of codes.
A qualitative description of the design session can be sup-ported by a quantitative analysis of the temporal distribu-tions of states and processes, as extracted by LINKOgra-pher. Figure 6 depicts the dynamic distribution of codes, obtained through sliding window of ten segments. It is eas-ily observed how evaluation starts being intense after the early 25 moves, and it is roughly structured in three cy-cles. This representation describes more clearly the occur-rence of the four design stages, as already highlighted by the qualitative inspection of the critical moves. It confirms the urgency of the group in exploring and quickly settling a modus operandi. Indeed, the episode shape is closer to a pipeline structure, rather than a funnel, with an almost equally-spaced distribution of the conception, exploration, clarification, and resolution steps.
3.3.1
Processes
A > B is a valid semantic transition if A is a segment linked back by B in the linkograph [4]. The design pro-cesses (arcs of the finite automaton) are derived from such transitions, and their occurrences are reported in table 4.
As seen from a different angle, the higher occurrence of synthesis and reformulation-I processes tells us about the presence of a typical bias in design cognition, that is the confirmation tendency towards pre-existing beliefs [10], es-pecially present in the creative work of novice designers, as the workshop participants were. Typically, confirmation bi-ases in concept generation easily lead to design fixations of initial ideas. From the educational viewpoint, stressing such issues in teamwork dynamics assists the researcher in taking alternative measures, aimed at improving the rationale of
Process Occurrence Percentage Formulation 3 2.7% Synthesis 25 22.5% Analysis 14 12.6% Evaluation 11 9.9% Documentation 18 16.2% Reformulation I 33 29.7% Reformulation II 7 6.3% Reformulation III 0 0%
Table 4: Occurrence of design processes.
objectives and constraints in the conception of sound design assignments.
3.3.2
Markov models
When states and arcs of the finite automaton have been associated to the segments representing design moves, em-pirical probabilities of code-to-code transitions can be com-puted. These constitute a first-order Markov model [4]. The transition probabilities of codes across links for the early five minutes are reported in table 5.
F Be Bs S D F 0.00 0.33 0.00 0.67 0.00 Be 0.00 0.03 0.16 0.81 0.00 Bs 0.00 0.60 0.20 0.20 0.00 S 0.00 0.10 0.19 0.46 0.25 D 0.00 0.00 0.00 1.0 0.00
Table 5: Transition probabilities between FBS codes.
Notice that more transitions are found than the ones rep-resented in the automaton of figure 2. For example, we can notice that the Bs state is likely to be forward linked to Be (0.60), but it can also be linked directly to a structural specification (0.20).
The combined reading of the transition probabilities to-wards S structural elements stresses the presence of design fixations on the initial ideas. However, adding this read-ing together with the transition value Be <> Bs (0.60) emphasizes a cohesive effort of refinement and evaluation of the emerging structural configurations. In line with the workflow represented in figure 6, it is possible to deduce the content of the three evaluation cycles, occurring in the early five minutes episode. To conclude, the group quickly fix-ated a few sound ideas, and focused their exclusive work on the sound quality of the structural elements, without ques-tioning their appropriateness, nor looking for other possible different sounds for the behaviors set. Indeed, we antici-pate that, despite the assignment requirements of proposing two alternative sound designs, the group managed to pro-duce only one advanced sketch in the whole session (fifty minutes).
The software LINKOgrapher also returns second-order Mar-kov and first-passage models [4, 15], which are not reported in this analysis.
3.3.3
Entropy
The strength of an idea can be measured quantitatively
by using entropy [12]. There is a potential correlation be-tween the entropy of a linkograph and the productivity of the design activities.
To use the information-theoretic concept of entropy, every link between two segments is considered as an event, which does or does not occur. In the measurement of dynamic entropy only the structure of the linkograph is considered, ignoring the codes. For the reported LINKOgrapher compu-tations over the early five minutes, we used a sliding window of ten segment. This means that, given a segment, the soft-ware checks for the presence or absence of a link with other segments not farther than ten positions away.
There are three kinds of entropy, that can be used to mea-sure different features of the design activity:
Forelink (initiations) entropy. Weak or fixated ideas are both characterized by low entropy. Weakness is cor-related to a small number of forelinks, conversely fix-ation is occurring when there are too many forelinks. Forelink entropy measures the opportunity for new cre-ations or initicre-ations;
Backlink (responses) entropy measures opportunities ac-cording to enhancements of responses. If an idea is very novel, it will not have backlinks, and therefore it will have low entropy. ;
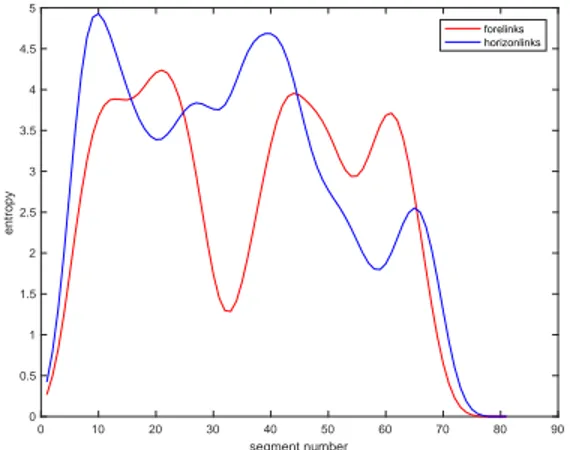
Horizonlink (cohesiveness) entropy measures the occur-rence of incubated segments, that is it considers the distance between interconnected moves which are far apart in the linkograph. Low entropy indicates a strong cohesiveness between moves. This entropy measure describes the opportunities for ideas generation and development, based on cohesiveness and incubation. Figure 7 shows the time-varying forelink and horizonlink entropies, computed on a sliding window of ten segments and smoothed by gaussian filtering. It is possible to observe
0 10 20 30 40 50 60 70 80 90 segment number 0 0.5 1 1.5 2 2.5 3 3.5 4 4.5 5 entropy forelinks horizonlinks
Figure 7: Forelink and horizonlink entropy. Sliding window of 10 segments. Smoothing by 15-segment wide gaussian convolution.
two main moments of ideas incubation, starting at the initial chunk of moves, and at move 33 which represents the break towards the clarification stage. This passage is confirmed by the corresponding low forelink entropy. If we look at the two passages where forelink entropy is higher than horizonlink entropy, these mostly span the sawtooths at moves 18, 51,
and 59. This can be read as a sign of good progression, but not development of the idea at hand. Indeed, it has been suggested that the quality of the design outcome is rather related to the rate of change of entropy than to entropy alone [11].
4.
EXTENDING THE ANALYSIS
Having tested and refined the tools and technique for the early five minutes, we extended the analysis to the whole design session, which was made of 416 segments spanning about 50 minutes of groupwork. Here we only have room to report a few observations. In general, the group iterations follow the arrangement found in the early five minutes. The process undergoes a deeper process of refinement and doc-umentation delivery, though. The overall session shows a prevalent cohesiveness of moves, signifying that opportuni-ties for creation, when emerging, arose through mostly linear progressions of design-thinking processes.
Often, one of the main criticisms to sound design work-shops is the inability to bring groupwork to a satisfying pro-duction level, in terms of both quality and quantity, despite a careful pacing of preparatory activities. Systematic protocol analyses of sound design exercises support the understand-ing of the cognitive behaviors and bottlenecks involved in creative processes. The qualitative and quantitative anal-yses facilitated by linkographic representations and by ex-tracted measures allow direct comparisons between sections of the same design session, as well as between different ses-sions.
5.
CONCLUSIONS
We introduced the application of protocol analysis and linkographic representations as means to develop a fine-grain understanding of the sound design process, especially cerning the unfolding of design-thinking in the early con-ceptual stage. In the future, we want to compare different vocal sketching sessions, possibly involving novice and ex-pert designers, individually and collaboratively. By further comparing sessions exploiting different sketching approaches and tools, we aim at assessing their effectiveness and appro-priateness.
6.
ACKNOWLEDGMENTS
The work described in this paper is part of the project SkAT-VG, which received the financial support of the Future and Emerging Technologies (FET) programme within the Seventh Framework Programme for Research of the Euro-pean Commission under FET-Open grant number: 618067. We are thankful to Cumhur Erkut and Stefania Serafin for organizing and hosting the workshop.
7.
REFERENCES
[1] M. Carron, T. Rotureau, F. Dubois, N. Misdariis, and P. Susini. Portraying sounds using a morphological vocabulary. In Euronoise 2015 Proc. 10th European Congress and Exposition on Noise Control
Engineering, Maastricht, Netherlands, 2015. [2] S. Delle Monache, D. Rocchesso, S. Baldan, and
D. Mauro. Growing the practice of vocal sketching. In K. Vogt, A. Andreopoulou, and V. Goudarzi, editors, ICAD 2015 Proc. of the 21th International Conference on Auditory Display, pages 59–65, 2015.
[3] K. Franinovi´c and S. Serafin. Sonic interaction design. Mit Press, 2013.
[4] J. S. Gero, J. W. Kan, and M. Pourmohamadi. Analysing design protocols: Development of methods and tools. In A. Chakrabarti, editor, Proc. of the 3rd International Conference on Research into Design Engineering, pages 3–10, 2011.
[5] J. S. Gero and U. Kannengiesser. An anthology of theories and models of design: Philosophy, approaches and empirical explorations. In A. Chakrabarti and L. T. M. Blessing, editors, An Anthology of Theories and Models of Design, chapter The
Function-Behaviour-Structure Ontology of Design, pages 263–283. Springer London, London, 2014. [6] J. S. Gero and T. Mc Neill. An approach to the
analysis of design protocols. Design studies, 19(1):21–61, 1998.
[7] G. Goldschmidt. The dialectics of sketching. Creativity Research Journal, 4(2):123–143, 1991.
[8] G. Goldschmidt. Linkography: unfolding the design process. MIT Press, 2014.
[9] S. Greenberg, S. Carpendale, N. Marquardt, and B. Buxton. Sketching User Experiences: The Workbook. Morgan Kaufmann Publishers Inc., San Francisco, CA, USA, 1st edition, 2011.
[10] G. M. Hallihan, H. Cheong, and L. Shu. Confirmation and cognitive bias in design cognition. In ASME 2012 Proc. International Design Engineering Technical Conferences and Computers and Information in Engineering Conference, pages 913–924. American Society of Mechanical Engineers, 2012.
[11] J. Kan and J. Gero. Can an objective measurement of design protocols reflect the quality of a design outcome? In Proc. International Conference on Engineering Design, ICED07, pages 1–12, 2007. [12] J. W. Kan, Z. Bilda, and J. S. Gero. Comparing
entropy measures of idea links in design protocols: Linkography entropy measurement and analysis of differently conditioned design sessions. AI EDAM: Artificial Intelligence for Engineering Design, Analysis, and Manufacturing, 21:367–377, 11 2007. [13] J. W. Kan and J. S. Gero. Acquiring information from
linkography in protocol studies of designing. Design Studies, 29(4):315–337, 2008.
[14] J. W. Kan and J. S. Gero. Using the FBS ontology to capture semantic design information in design protocol studies. In About: Designing. Analysing Design Meetings, pages 213–229. CRC Press, 2009. [15] J. W. T. Kan, J. S. Gero, and S. Sarkar. Using a
generic method to study software design cognition. In A. vander Hoek, M. Petre, and A. Baker, editors, Workshop on Studying Professional Software Design, pages 1–7, 2010.
[16] M. Pourmohamadi and J. S. Gero. LINKOgrapher: An analysis tool to study design protocols based on FBS coding scheme. In S. Culley, B. Hicks,
T. McAloone, T. Howard, and J. Clarkson, editors, ICED 2011 Proc. of the 18th International Conference on Engineering Design, Impacting Society through Engineering Design, volume 2: Design Theory and Research Methodology, pages 294–303, 2011.