Bone marrow megakaryocytic activation predicts fibrotic
evolution of Philadelphia-negative myeloproliferative
neoplasms
by Mattia Schino, Vincenzo Fiorentino, Elena Rossi, Silvia Betti, Monica Di Cecca,
Valentina Ranucci, Patrizia Chiusolo, Maurizio Martini, Valerio De Stefano, and Luigi Maria Larocca
Haematologica 2020 [Epub ahead of print]
Citation: Mattia Schino, Vincenzo Fiorentino, Elena Rossi, Silvia Betti, Monica Di Cecca,
Valentina Ranucci, Patrizia Chiusolo, Maurizio Martini, Valerio De Stefano, and Luigi Maria Larocca. Bone marrow megakaryocytic activation predicts fibrotic evolution of Philadelphia-negative
myeloproliferative neoplasms. Haematologica. 2020; 105:xxx doi:10.3324/haematol.2020.264143 Publisher's Disclaimer.
E-publishing ahead of print is increasingly important for the rapid dissemination of science. Haematologica is, therefore, E-publishing PDF files of an early version of manuscripts that have completed a regular peer review and have been accepted for publication. E-publishing of this PDF file has been approved by the authors. After having E-published Ahead of Print, manuscripts will then undergo technical and English editing, typesetting, proof correction and be presented for the authors' final approval; the final version of the manuscript will then appear in print on a regular issue of the journal. All legal disclaimers that apply to the journal also pertain to this production process.
1
Article
Bone marrow megakaryocytic activation predicts fibrotic evolution of
Philadelphia-negative myeloproliferative neoplasms.
Mattia Schino,1* Vincenzo Fiorentino,1* Elena Rossi,2,3 Silvia Betti,3 Monica Di Cecca,2 Valentina Ranucci,1 Patrizia Chiusolo,2,3 Maurizio Martini,1,3# Valerio De Stefano2,3 # and Luigi Maria Larocca1,3° 1Department of Life Sciences and Public Health, Università Cattolica del Sacro Cuore, Largo F. Vito 1, 00168 Rome, Italy: Mattia Schino, [email protected];Vincenzo Fiorentino, [email protected]; Valentina Ranucci, [email protected]; Maurizio Martini, [email protected]; Luigi Maria Larocca, [email protected].
2 Department of Radiological and Hematological Sciences, Università Cattolica del Sacro Cuore, Largo F. Vito 1, 00168 Rome, Italy: Elena Rossi [email protected]; Monica Di Cecca, [email protected]; Patrizia Chiusolo, [email protected]; Valerio De Stefano, [email protected].
3Fondazione Policlinico Universitario A. Gemelli IRCCS, Largo A. Gemelli 8, 00168, Rome, Italy: Silvia Betti, [email protected].
*These authors (MF and VF) contributed equally to this work
#These authors (VDS and MM) share equal senior authorship
Running heads
: Megakaryocytic activation and fibrotic evolution of MPNs°Corresponding author
Prof. Luigi Maria Larocca
Department of Life Sciences and Public Health, Università Cattolica del Sacro Cuore
Fondazione Policlinico Universitario A. Gemelli IRCCS, Largo A. Gemelli 8, 00168 Roma, Italy.
Phone: +39-06-30154433 Fax: +39-06-3015883
e-mail:
[email protected]
Word count
: Abstract: 201; Text: 3125; References: 32; Figure 2; Table 4; Supplementary Figures 3; Supplementary Table 12
Abstract
Philadelphia-negative chronic myeloproliferative neoplasms (MPNs) have been traditionally considered as indistinctly slowly progressing conditions; recent evidence proves that a subset of cases have a rapid evolution, so that MPNs’ prognosis needs to be personalized.
We identified a new morphological parameter, defined as Megakaryocytic Activation (M-ACT) based on the coexistence of megakaryocytic emperipolesis, megakaryocytes (MK) clusters formation and evidence of arrangement of collagen fibers around the perimeter of MK. We retrospectively analyzed the bone marrow biopsy of two MPNs cohorts of patients with polycythemia (PV) (n=64) and non-PV patients [including essential thrombocythemia (ET), and early/prefibrotic primary myelofibrosis (PMF)] (n=222).
M-ACT showed a significant correlation with splenomegaly, white blood cell (WBC) count, and LDH serum levels in both groups, with JAK2 V617F allele burden in PV patients, and with CALR mutations, and platelet count in non-PV patients. Progression-free survival, defined as PV-to-secondary MF progression and non-PV-to-overt PMF, was worse in both PV and early/prefibrotic PMF patients with M-ACT in comparison to those without M-ACT (P<.0001). Interestingly, M-ACT was not found in the subgroup of ET patients.
In conclusion, M-ACT can be helpful in the differential diagnosis of MPNs and can represent a new morphologic parameter with a predictive value for progression of MPNs.
3
Introduction
Philadelphia-negative chronic myeloproliferative neoplasms (MPNs) represent a group of hematological disorders that originate from the neoplastic transformation of a pluripotent stem cell and are characterized by clonal proliferation of one or more hematopoietic progenitors in the bone marrow (BM) and in extramedullary sites.
According to the WHO 2017 classification, MPNs can be divided into three main sets: Polycythemia Vera (PV), Essential Thrombocythemia (ET) and Primary Myelofibrosis (PMF), whose early stages’ differential diagnosis is often challenging.1
While MPNs have been traditionally considered as indistinct slow progressing conditions,2,3 recent evidence, on the contrary, demonstrated that a subset of cases had a rapid evolution, leading different groups to develop several prognostic scores, mainly based on clinical and laboratory parameters with less emphasis on morphological, immunophenotypic and molecular data.4
The first prognostic score was The International Prognostic Scoring System (IPSS), edited in 2009 by an international study group, which enabled survival estimation at the time of diagnosis primarily employing five clinical and hematologic parameters;5 this model was further revised as Dynamic International Prognostic Scoring System (DIPSS) and then as DIPSS-plus score.6,7 The above, nonetheless, applied to already-established myelofibrosis (both PMF and post-PV/ET MF) only, determining survival from the time of disease progression/transformation to death without considering the heterogeneous disease history before the appearance of BM changes.8
On the basis of advances in MPNs’ molecular profiling, in order to improve the prognostic prediction in PMF patients, novel models included JAK2, CALR, and MPL mutation status in addition to the IPSS parameters.8 Moreover, novel insights were provided by in-depth analysis of genomic subsets with different clinical outcomes.9 Recent publications have introduced new risk models for PMF, namely MIPSS70 (mutation-enhanced international prognostic scoring system for transplant-age patients),10 MIPSS70+ version 2.0 (karyotype-enhanced MIPSS70) and GIPSS (genetically-inspired prognostic scoring system).11,12 Similar risk models have been recently introduced for both ET and PV
4
under the name of MIPSS-ET and MIPSS-PV, highlighting the prognostic contribution of spliceosome gene mutations.13 However, all these predictive models did not consider morphological and
phenotypical features, except bone marrow (BM) fibrosis grade in the MIPPS70 model.
In this study we evaluated a new morphological parameter, defined by the coexistence of emperipolesis of megakaryocytes (MK) (i.e. the presence of an intact cell within the cytoplasm of another cell), MK clustering and peri-MK fibrosis in bone marrow (BM) biopsy, which was named Megakaryocytic Activation (M-ACT). Larocca et al. in 2015 demonstrated that extensive BM
emperipolesis associated to BM fibrosis was present in patients affected by gray platelet syndrome, with up to 65% MK containing 2-4 leukocytes engulfed within the cytoplasm;14 a similar phenomenon has been described either in BM patients with PMF,15 and in the BM of animal models of myelofibrosis.16,17
We demonstrated that M-ACT is a useful morphological parameter in forecasting both PV and early/prefibrotic PMF to myelofibrosis progression and could also help in the differential diagnosis between ET and early/prefibrotic PMF.18
5
Methods
Patients' features
Formalin-fixed, paraffin-embedded BM biopsy specimens, obtained from the posterior superior iliac spine,19 were available in our Institute of Pathology for 460 patients clinically diagnosed with a MPN and followed at our Institute of Hematology (Fondazione Policlinico Universitario “A. Gemelli”, IRCCS) from January 2005 to October 2019. The study was carried out in accordance with the Declaration of Helsinki and the consent for retrospective analysis of all clinical data, according to the Ethical Committee of the Catholic University School of Medicine, and obtained by all the patients at the hospital admission. Patients were clinically followed-up over the observation time by one single team physician (V.D.S. and E.R as senior members).
All 286 cases were sorted out up until October 2019, according to three inclusion criteria: clinical diagnosis of either PV or non-PV MPN, first BM biopsy at diagnosis for non-PV cohort and within 0-24 months from the clinical diagnosis for PV cohort and no grade 2-3 bone marrow fibrosis. Accordingly, patients with diagnosis of overt PMF or secondary myelofibrosis were excluded. Furthermore, BM biopsies were revised by two skilled pathologists (L.M.R. and M.M.) and categorized according to the WHO 2017 criteria (PV, ET, early/prefibrotic PMF).
Clinical and hematological data (according to WHO 2017 criteria) were collected in order to trace LDH increase (i.e. LDH serum levels ≥ 250 UI/L), palpable splenomegaly, leukocytosis (i.e. WBC ≥ 11 × 109/L), high hemoglobin level (i.e. Hgb > 16 g/dL for woman and Hgb > 16.5 g/dL for man) and thrombocytosis (i.e. PLT ≥ 450 × 109/L) for each patient at diagnosis. We also verified the occurrence of Arterial/Venous (A/V) thrombotic events and/or major bleeding events during the clinical course (until October 2019) for each case. Thrombotic and bleeding events were defined as previously described.20 JAK2 V617F mutation and allele burden analysis, CALR exon 9 mutations and MPL exon 10 mutations were performed as previously described.20 Progression to secondary myelofibrosis was defined from the patient chart review and based on the International Working Group for Myelofibrosis Research and Treatment (IWG-MRT) consensus criteria.21
6
The main clinical, hematological and molecular characteristics of the 286 patients are shown in Table 1 for PV cohort (64 patients), in Table 2 and Table 1S for non-PV cohort [including 199 early/prefibrotic PMF patients (Table 2) and 23 ET patients (Table 1S)].
Bone marrow biopsy analysis and M-ACT histological parameters
All the biopsy specimens had a suitable length (at least 1.5-2 cm) in order to obtain at least ten partially preserved intertrabecular areas, since subcortical medullary lacunae are less cellular than deep ones (especially in the elderly) and since focal pathologies can have a deep localization.22 After
collection, each biopsy specimen was kept in a properly-labelled clean container filled with 10% natural buffered formalin at pH 7.6 for 12 hours for fixation, decalcified with a Decalcifier II solution (Leica Biosystems, Milan, Italy) for 1 hour at room temperature, then fixed with 10% natural buffered
formalin at pH 7.6 for 2 hours and finally included in paraffin. Sections, 3-5 μm thick, were taken from
each block for staining with H&E and Gordon&Sweet’s silver staining to evaluate morphological features and fibrosis.23,24 The specimens were concurrently examined and reviewed by two pathologists experienced in BM biopsy interpretation (L.M.L. and M.M.),who were blinded toward the patients’ characteristics and survival. Cases with disagreement were discussed using a multiheaded microscope until agreement was achieved. The agreement indices (Cohen’s K) between the two pathologists were very good: k=0.83 and k=0.85 for PV group and for non-PVs group, respectively.
In the definition of M-ACT the following parameters were examined in detail (as shown in Figure 1): (1) MK emperipolesis, (2) MK clustering and (3) peri-MK fibrosis.
1) MK emperipolesis was defined as the presence of one or more leukocyte or a precursor of hematopoiesis within the cytoplasm of at least 30% MKs in the specimen.
2) MK clustering was defined as an aggregation of 3 or more megakaryocytes in close contact with each other and at least 25% of MKs are distributed in clusters in the specimen.
7
3) peri-MK fibrosis was used to define the arrangement of collagen fibers around the perimeter of the vast majority of MKs, underlining their primary role in the genesis of fibrosis.
ACT positive patients showed the contemporary presence of all three parameters and M-ACT was evaluated only on the first BM biopsy at diagnosis and before any treatment.
Statistical Analysis
Statistical analysis was performed using GraphPad-Prism 5 software (Graph Pad Software, San Diego, CA) and MedCalc version 10.2.0.0 (MedCalc Software, Mariakerke, Belgium).25 Statistical
comparison of continuous variables was performed by the Mann-Whitney U-test (t test), as appropriate. Comparison of categorical variables was performed by chi-square statistic, using the Fisher’s exact test. To evaluate the agreement between the two pathologists about the presence or absence of M-ACT in bone marrow biopsies, we calculated the inter-rater agreement (Kappa) using MedCalc software.
The endpoint was progression-free survival (PFS), defined as the time between the first
diagnosis and PV-to-secondary MF progression and early/prefibrotic PMF -to-overt PMF progression, respectively.
We followed the WHO 2017 criteria to establish the progression for PV-to-secondary MF and for early/prefibrotic PMF to overt myelofibrosis progression.1
Kaplan-Meier survival curves were plotted and differences in survival between groups of patients were compared using the log-rank test. Multivariate analysis was performed using the Cox proportional hazards regression analysis including only those clinical and biological variables with a p-value of 0.10 or lower at the univariate analysis. P-p-values less than 0.05 were considered as statistically significant.
8
Results
Megakaryocytic activation in PV cohort
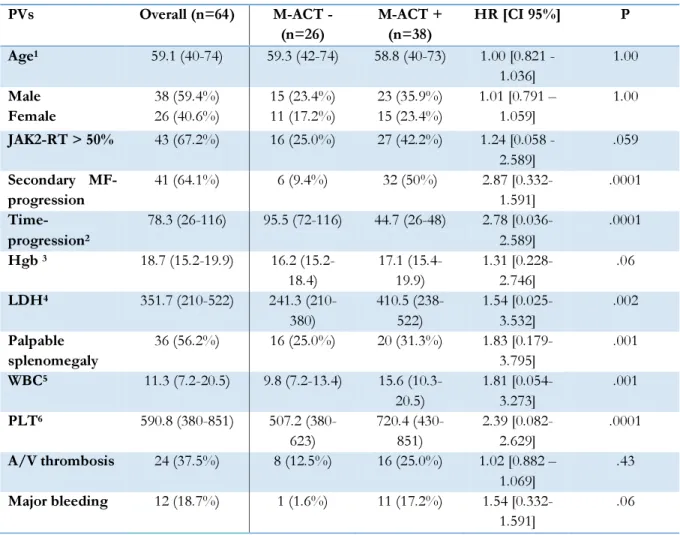
Twenty-six out of the 64 PVs did not meet histological criteria for M-ACT (40%), versus 38 who did (60%). In PV cohort, M-ACT showed a significant correlation with one clinical parameter, i.e. palpable splenomegaly (P=.001), and with hematologic parameters, like platelet count (P=.0001), LDH serum levels (P=.002) and WBC count (P=.001). On the other hand, no significant correlation was found between M-ACT and age (P=1.00), gender (P=1.00), A/V thrombosis (P=.43), while major bleeding (P=.06), Hgb level (P=.06) and JAK2V617F burden>50% (P=.059) showed a certain associative trend (Table 1).
We found that patients with M-ACT had a significant lower progression-free survival (PFS) than those without M-ACT (Table 1; Figure 2 panel A, for PFS: median PFS for M-ACT positive patients 58 months versus median PFS for M-ACT negative patients 108 months, P<.0001, HR 6.81, 95% CI from 3.48 to13.32). Moreover, JAK2V617Fallele burden≥50% and history of major bleeding had a significant correlation with a worse PFS (P=.0225 and P=.0174, respectively, Figure S1), while WBC count>11x109/l showed a certain trend toward significance (P=.0823, Figure S1). Conversely, age (P=.3718), gender (P=.3645), LDH serum level (P=.1305), PLT count (P=.5643), Hgb level (P=.1024) and A/V thrombosis (P=.4216) did not show significant correlation with PFS.
Multivariate analysis of PFS, including M-ACT status, JAK2 status, WBC count and history of major bleeding, showed that the presence of M-ACT and the JAK2V617Fallele burden were the only significant predictors (for M-ACT status, P<.0001, HR 10.4180, 95% CI: from 4.0978 to 26.4858; for JAK2V617Fallele burden≥50%, P=.0105, HR 0.0105, 95% CI: from 1.2855 to 6.6460; Table 3).
Megakaryocytic activation in non-PV MPNs cohort
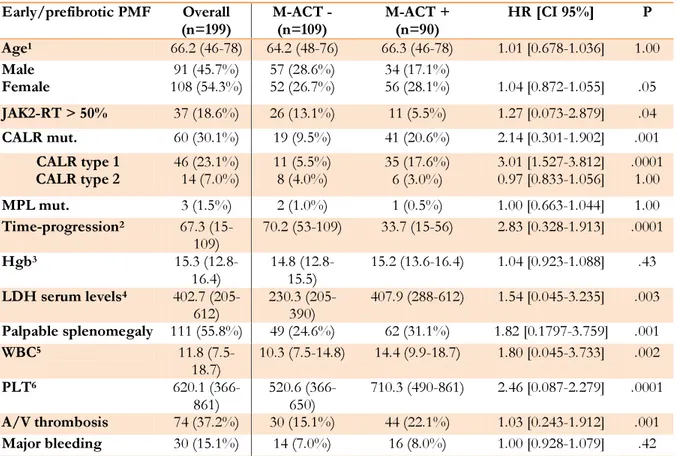
One hundred and nine of 199 early/prefibrotic PMF patients did not meet histological criteria for M-ACT (55%), versus 90 who did (45%). In this cohort, M-ACT showed a strong correlation with clinical parameters, such as palpable splenomegaly (P=.001) and history of major bleeding (P=.001),
9
and with hematologic parameters, like platelet count (P=.0001), LDH serum levels (P=.003), WBC count (P=.002), presence of CALR mutations (P=.001; Table 2). Notably, we found a significant association between M-ACT and CALR type 1 mutation (P=.0001) while we did not find a significant correlation between M-ACT and CALR type 2 mutation (P=1.0). We found a significant yet milder correlation with gender, being M-ACT more prevalent in females (P=.05), and with JAK2V617F allele burden≥50% (P=.04). On the contrary, no significant correlation was found between M-ACT and age (P=1.00), Hgb level (P=.43), MPL mutations (P=1.00) and A/V thrombosis (P=.42; Table 1).
Similarly to what happened in the PV cohort, when we correlated M-ACT status with PFS, we found that patients with early/prefibrotic PMF and with M-ACT had a significant lower PFS than those without M-ACT (Table 1; Figure 2 panel B, for PFS: median PFS for M-ACT positive patients 44 months versus median PFS for M-ACT negative patients 77 months, P<.0001, HR 3.17, 95% CI from 2.27 to 4.44). Moreover, male gender, CALR type 1 mutations, WBC count>11x109/l, presence of palpable splenomegaly, PLT≥600x109/l and LDH≥250 U/l had a significant correlation with a worse PFS (P=.0187, P<.0001, P<.0001, P<.0001, P<.0001 and P=.0025, respectively, Figure 2S).
Conversely, age (P=.8831), major bleeding (P=.7244), JAK2 V617F allele burden≥50% (P=.3459), Hgb level (P=.5234), MPL mutations (P=.2268) and A/V thrombosis (P=.2003) did not show significant correlation with PFS.
Multivariate analysis of PFS, including M-ACT status, CALR status, WBC count, gender, LDH serous level, splenomegaly, and platelet count, showed that the presence of M-ACT and CALR type 1 mutation, WBC count>11x109/l and male gender were the significant predictors (for M-ACT status, P<.0001, HR 2.1510, 95% CI: from 1.5598 to 2.9661; for CALR status, P=.0285, HR 1.446, 95% CI: from 1.0395 to 2.0124; for WBC count, P=.0211, HR 1.5425,95% CI: from 1.0673 to 2.2294; for gender, P=.0074, HR 1.5024, 95% CI: from 1.1153 to 2.0240; Table 4).
In the non-PV MPNs cohort, we also analyzed a small subgroup of 23 ET patients. We did not find M-ACT in any of the ET BM biopsies performed at the time of the diagnosis. The ET patients
10
had a better PFS in comparison to patients with early/prefibrotic PMF either with M-ACT (Figure 3S; P<.0001) and without M-ACT (Figure 3S; P<.0001).
Interestingly, we found that the incidence of M-ACT among triple-negative patients in the non-PV cohort was significantly lower in respect to patients with a driver gene mutation [21 out of 85 (24.7%) triple negative patients vs 90 out of 222 (40.5%); P=.0115], and that triple-negative patients with M-ACT also had a significant lower PFS than those without M-ACT (median PFS for M-ACT positive triple-negative patients 56 months versus median PFS for M-ACT negative triple-negative patients 79 months, P<.0023, HR 2.76, 95% CI 1.44 to 5.32; data not shown).
11
Discussion
For about two decades, one of the most important problems in the treatment of patients with MPNs has been the identification of biological and non-biological factors that could represent a determinant key to the prediction of prognosis. Accordingly, several prognostic scores have succeeded over time, mainly based on clinical, hematological and molecular parameters, in order to identify the fraction of MPNs patients that could have a high risk of developing a leukemic transformation or a bone marrow fibrotic failure. However, none of these models take the morphological parameters into factual consideration, while these parameters play an important role in the diagnostic phase.
In this retrospective and monocentric study, we propose a novel morphological parameter, defined as M-ACT, as a new possible predictive marker of fibrotic evolution among Philadelphia-negative MPNs. Furthermore, this new parameter seems to be useful to supplement WHO 2017 classification criteria in the differential diagnosis of the MPN subtype between ET and early/prefibrotic PMF.
In our study, carried out on a large cohort of MPNs’ bone marrow biopsies at diagnosis, extensive evidences support this statement. In fact, in univariate analysis M-ACT correlates with relevant MPN clinical and hematologic parameters (see Table 1 and 2), such as palpable splenomegaly, WBC or PLT count, and LDH levels, but also with molecular profiles defined by the JAK2 V617F allele burden and CALR mutations (especially the CALR type 1 mutation).
In PV patients the PFS was influenced at the multivariate analysis by the JAK2 V617F allele burden > 50%, as already reported;26 in early/prefibrotic PMF patients’ PFS was influenced by the presence of the CALR type 1 mutation, WBC count>11x109/l and male gender, in agreement with previous reports.27
Moreover, patients with M-ACT had a significant correlation with a worse PFS and with an overt-myelofibrotic bone marrow failure, in both PVs and early/prefibrotic PMF (P<.0001). This last result is also confirmed at multivariate analysis. Interestingly, PV and early/prefibrotic PMF patients with this parameter showed a rapid clinical progression before the end of the 5-year follow-up,
12
suggesting that M-ACT could be an early predictive marker capable of precociously identifying patients that need a closer follow-up.
Numerous scientific papers have highlighted that in the evolution towards myelofibrosis of MPNs, a central role seems to be played by megakaryocytes. Patients with MPNs and fibrotic evolution showed a significant increased number of megakaryocytes with an abnormal nuclear/cytoplasmic ratio and a reduced polyploid state, often organized in clusters.27,28 Experiments using in-vitro cultures of CD34+ hematopoietic stem cells of patients with fibrotic MPNs have shown that megakaryocytes expand excessively, are immature and show delayed apoptosis owing to increased expression of the anti-apoptotic factor Bcl-xL.29 Moreover, mice with a megakaryocyte-specific deficiency of the transcription factor–encoding gene GATA1 show elevated numbers of immature megakaryocytes in the bone marrow and an increased and pathologic neutrophil emperipolesis that may represent one of the mechanisms leading to myelofibrosis by releasing fibrogenic MK cytokines and neutrophil
proteases in the microenvironment of in-vivo experiments.14,16 Finally, megakaryocytes from individuals with PMF secrete increased levels of the fibrotic cytokines such as TGF-β, compared to
megakaryocytes from healthy individuals, and the extracellular matrix (ECM) microenvironment, especially the fibronectin component, is able to sustain progenitor cell proliferation and
megakaryopoiesis in a TPO-independent manner.16,30,31 These pro-fibrotic cytokines would presumably act mainly in the microenvironment near to those megakaryocyte clusters which are, in turn, their main producers. Furthermore, the criteria defining the megakaryocytic activation could represent the
morphological counterpart of what is postulated by in-vitro and in-vivo studies regarding the role of megakaryocytes in the bone marrow fibrotic evolution of patients with MPNs.
Recent evidence has suggested that treating patients with early-stage MF may lead to better outcomes with a less severe splenomegaly, a lower incidence of cytopenia, and less-severe bone marrow fibrosis. However, the argument is debated, especially considerating the adverse events of the JAK2 inhibitor treatment (ruxolitinib). M-ACT parameter, as an early predictive marker capable of
13
precociously identifying patients with an overt-myelofibrotic bone marrow failure, could also select those patients that would benefit from precocious treatment.32
Our analysis not only supports the role of the megakaryocytes and its activation in the evolution of PV and early/prefibrotic PMF, but also seems to suggest that, for the treatment of this neoplasia, as well as the inhibition of specific mutations, which may partially alter the natural history of the disease, the blockage of the fibrotic evolution and therefore of its main key-player, the megakaryocyte, should be a future therapeutic strategy to be investigated.30
M-ACT is also a very useful morphological parameter in the diagnostic phase of MPNs. In fact, none of the ET patients showed M-ACT, which when present, identifies only an early/prefibrotic PMF.
Interestingly the M-ACT showed a significant lower incidence in triple-negative patients in comparison to those with a driver gene mutation (24.7% vs 40.5%) reinforcing the idea of a more indolent disease for this subgroup though maintaining its predictive role for the fibrotic evolution also in triple-negative patients.
In addition, M-ACT parameter evaluation represents an easily executable analysis with a high agreement index between pathologists. Moreover, the search for M-ACT on the bone marrow biopsies in the diagnostic phase of MPN patients can be performed widely without the need for further analysis such as immunohistochemistry or molecular analysis.
The main limitation of our study is the retrospective design, so that the estimate of the time of progression to overt myelofibrosis and the estimate of PFS based on the patient chart review can lack of accuracy. Moreover, the team physician was unchanged over years and the criteria for diagnosing progression to overt myelofibrosis were aligned with those of the IWG-MRT consensus.21
Although we analyzed a large cohort, the results of this monocentric study need confirmation in other independent MPN patient cohorts, and M-ACT should be validated as a prognostic tool.
14
List of abbreviations
MPNs: chronic myeloproliferative neoplasms PV: Polycythemia Vera
ET: Essential Thrombocythemia PMF: Primary Myelofibrosis M-ACT: Megakaryocytic Activation MK: megakaryocytes
PFS: progression free survival OS: overall survival
15
Declarations
Ethics approval and consent to participate
The study was carried out in accordance with the Declaration of Helsinki and the consent for
retrospective analysis of all clinical data, according to the Ethical Committee of the Catholic University School of Medicine, was obtained by all the patients at the hospital admission. The report does not present identifying images or other personal or clinical details of participants that compromise anonymity.
Acknowledgment
We thank Dr. Sara Capodimonti and Dr. Tonia Cenci for their technical support.
Founding
This study was supported by Università Cattolica del Sacro Cuore, Fondi d’Ateneo, Linea D1 (2018 and 2019; MM and LML).
Availability of data and materials
The datasets used and/or analyzed during the current study are available from the corresponding author on reasonable request.
Authors’ contributions
L.M.L., M.S., V.F. and M.M. were the principal authors and the main contributors in writing the manuscript. E.R., S.B., V.R., M.D.C. and P.C. analyzed and interpreted the patient data. M.M., L.M.L., M.S. and V.F. performed the biopsies analysis. L.M.L. and V.D.S. read and corrected the manuscript. All authors read and approved the final manuscript.
Consent for publication
Not applicable.Competing interests
16
References
1.
Swerdlow SH, Campo E, Harris NL, Jaffe ES, Pileri SA, Stein H, Thiele J. WHO Classification of Tumours of Haematopoietic and Lymphoid Tissues (Revised 4th edition). IARC: Lyon 2017.2.
Murphy S. Diagnostic criteria and prognosis in polycythemia vera and essential thrombocythemia. Semin Hematol. 1999;36(1 Suppl 2):9‐13.3.
Georgii A, Buesche G, Kreft A. The histopathology of chronic myeloproliferative diseases. Baillieres Clin Haematol. 1998;11(4):721‐749.4. Barbui T, Thiele J, Gisslinger H, et al. The 2016 WHO classification and diagnostic criteria for myeloproliferative neoplasms: document summary and in-depth discussion. Blood Cancer J.
2018;8(2):15.
5.
Cervantes F, Dupriez B, Pereira A, et al. New prognostic scoring system for primary myelofibrosis based on a study of the International Working Group for Myelofibrosis Research and Treatment. Blood. 2009;113(13):2895-2901.6.
Passamonti F, Cervantes F, Vannucchi AM, et al. A dynamic prognostic model to predict survival in primary myelofibrosis: a study by the IWG-MRT (International Working Group for Myeloproliferative Neoplasms Research and Treatment). Blood. 2010;115(9):1703-1708.7.
Gangat N, Caramazza D, Vaidya R, et al. DIPSS plus: a refined Dynamic International Prognostic Scoring System for primary myelofibrosis that incorporates prognostic information from karyotype, platelet count, and transfusion status. J Clin Oncol. 2011;29(4):392-397.8.
Rumi E, Cazzola M. Diagnosis, risk stratification, and response evaluation in classical myeloproliferative neoplasms. Blood. 2017;129(6):680-692.9.
Grinfeld J, Nangalia J, Baxter EJ et al. Classification and Personalized Prognosis in Myeloproliferative Neoplasms. N Engl J Med. 2018;379(15):1416-1430.10.
Guglielmelli P, Lasho TL, Rotunno G, et al. MIPSS70: Mutation-Enhanced International Prognostic Score System for Transplantation-Age Patients With Primary Myelofibrosis. J Clin Oncol. 2018;36(4):310-318.17
11.
Tefferi A, Guglielmelli P, Lasho TL, et al. MIPSS70+ Version 2.0: Mutation and Karyotype-Enhanced International Prognostic Scoring System for Primary Myelofibrosis. J Clin Oncol. 2018;36(17):1769-1770.12.
Tefferi A, Guglielmelli P, Nicolosi M, et al. GIPSS: genetically inspired prognostic scoring system for primary myelofibrosis. Leukemia. 2018;32(7):1631-1642.13.
Tefferi A, Guglielmelli P, Lasho TL, et al. Mutation-enhanced international prognostic systems for essential thrombocythaemia and polycythaemia vera. Br J Haematol. 2020;189(2):291-302.14.
Larocca LM, Heller PG, Podda G, et al. Megakaryocytic emperipolesis and platelet function abnormalities in five patients with gray platelet syndrome. Platelets. 2015;26(8):751-757.15.
Schmitt A, Jouault H, Guichard J, Wendling F, Drouin A, Cramer EM. Pathologic interaction between megakaryocytes and polymorphonuclear leukocytes in myelofibrosis. Blood. 2000;96(4):1342-1347.16.
Centurione L, Di Baldassarre A, Zingariello M, et al. Increased and pathologic emperipolesis of neutrophils within megakaryocytes associated with marrow fibrosis in GATA-1(low) mice. Blood. 2004;104(12):3573-3580.17.
Yan XQ, Lacey D, Hill D, et al. A model of myelofibrosis and osteosclerosis in mice induced by overexpressing thrombopoietin (mpl ligand): reversal of disease by bone marrow transplantation. Blood. 1996;88(2):402-409.18.
Gianelli U, Iurlo A, Vener C, et al. The significance of bone marrow biopsy and JAK2V617F mutation in the differential diagnosis between the "early" prepolycythemic phase of polycythemia vera and essential thrombocythemia. Am J Clin Pathol. 2008;130(3):336-342.19.
Ridgeway JA, Tinsley S, Kurtin SE. Practical Guide to Bone Marrow Sampling for Suspected Myelodysplastic Syndromes. J Adv Pract Oncol. 2017;8(1):29-39.20.
De Stefano V, Ruggeri M, Cervantes F, et al. High rate of recurrent venous thromboembolism in patients with myeloproliferative neoplasms and effect of prophylaxis with vitamin K antagonists. Leukemia. 2016;30(10):2032-2038.18
21.
Barosi G, Mesa RA, Thiele J, et al. Proposed criteria for the diagnosis of post-polycythemia vera and post-essential thrombocythemia myelofibrosis: a consensus statement from the International Working Group for Myelofibrosis Research and Treatment. Leukemia. 2008;22(2):437-438.22.
Lee SH, Erber WN, Porwit A, Tomonaga M, Peterson LC. International Council forStandardization In Hematology. ICSH guidelines for the standardization of bone marrow specimens and reports. Int J Lab Hematol. 2008;30(5):349-364.
23.
Vardiman JW, Thiele J, Arber DA, et al. The 2008 revision of the World Health Organization (WHO) classification of myeloid neoplasms and acute leukemia: rationale and important changes. Blood. 2009;114(5):937-951.24.
Afkhami M, Vergara-Lluri M, Brynes RK, Siddiqi IN. Peripheral blood smears, bone marrow aspiration, trephine and clot biopsies: methods and protocols. Methods Mol Biol. 2014;1180:257-269.25.
Martini M, Cenci T, D'Alessandris GQ, et al. Epigenetic silencing of Id4 identifies aglioblastoma subgroup with a better prognosis as a consequence of an inhibition of angiogenesis. Cancer. 2013;119(5):1004-1012.
26.
Passamonti F, Rumi E, Pietra D, et al. A prospective study of 338 patients with polycythemia vera: the impact of JAK2 (V617F) allele burden and leukocytosis on fibrotic or leukemic disease transformation and vascular complications. Leukemia. 2010;24(9):1574-1579.27.
Cerquozzi S, Tefferi A. Blast transformation and fibrotic progression in polycythemia vera and essential thrombocythemia: a literature review of incidence and risk factors. Blood Cancer J.2015;5(11):e366.
28.
Ciurea SO, Merchant D, Mahmud N, et al. Pivotal contributions of megakaryocytes to the biology of idiopathic myelofibrosis. Blood. 2007;110(3):986-993.29.
Villeval JL, Cohen-Solal K, Tulliez M, et al. High thrombopoietin production by hematopoietic cells induces a fatal myeloproliferative syndrome in mice. Blood. 1997;90(11):4369-4383.30.
Wen QJ, Yang Q, Goldenson B, et al. Targeting megakaryocytic-induced fibrosis in myeloproliferative neoplasms by AURKA inhibition. Nat Med. 2015;21(12):1473-1480.19
31.
Malara A, Gruppi C, Abbonante V, et al. EDA fibronectin-TLR4 axis sustains megakaryocyte expansion and inflammation in bone marrow fibrosis. J Exp Med. 2019;216(3):587-604.32.
Palandri F, Sabattini E, Maffioli M. Treating early-stage myelofibrosis. Ann Hematol. 2019;98(2):241-253.20
Table 1. Correlation between M-ACT and the main PV patient’s clinical and molecular features.
JAK2-RT: JAK2 V617F allele burden; Hgb: Hemoglobin, serum levels; LDH: Lactate dehydrogenase, serum levels; WBC: White blood cell count; PLT: Platelet count; A/V: Arterial/venous; HR: Hazard ratio; CI: Confidence interval 1In years 2In months 3 (g/dL) 4(UI/L) 5( x 109 /L ) 6( x 109 /L ) PVs Overall (n=64) M-ACT - (n=26) M-ACT + (n=38) HR [CI 95%] P Age1 59.1 (40-74) 59.3 (42-74) 58.8 (40-73) 1.00 [0.821 - 1.036] 1.00 Male Female 38 (59.4%) 26 (40.6%) 15 (23.4%) 11 (17.2%) 23 (35.9%) 15 (23.4%) 1.01 [0.791 – 1.059] 1.00 JAK2-RT > 50% 43 (67.2%) 16 (25.0%) 27 (42.2%) 1.24 [0.058 - 2.589] .059 Secondary MF-progression 41 (64.1%) 6 (9.4%) 32 (50%) 2.87 [0.332-1.591] .0001 Time-progression2 78.3 (26-116) 95.5 (72-116) 44.7 (26-48) 2.78 [0.036-2.589] .0001 Hgb 3 18.7 (15.2-19.9) 16.2 (15.2-18.4) 17.1 (15.4-19.9) 1.31 [0.228-2.746] .06 LDH4 351.7 (210-522) 241.3 (210-380) 410.5 (238-522) 1.54 [0.025-3.532] .002 Palpable splenomegaly 36 (56.2%) 16 (25.0%) 20 (31.3%) 1.83 [0.179-3.795] .001 WBC5 11.3 (7.2-20.5) 9.8 (7.2-13.4) 15.6 (10.3-20.5) 1.81 [0.054-3.273] .001 PLT6 590.8 (380-851) 507.2 (380-623) 720.4 (430-851) 2.39 [0.082-2.629] .0001 A/V thrombosis 24 (37.5%) 8 (12.5%) 16 (25.0%) 1.02 [0.882 – 1.069] .43 Major bleeding 12 (18.7%) 1 (1.6%) 11 (17.2%) 1.54 [0.332-1.591] .06
21
Table 2. Correlation between M-ACT and the main early/prefibrotic PMF patient’s clinical
and molecular features.
Early/prefibrotic PMF Overall
(n=199) M-ACT - (n=109) M-ACT + (n=90) HR [CI 95%] P
Age1 66.2 (46-78) 64.2 (48-76) 66.3 (46-78) 1.01 [0.678-1.036] 1.00 Male Female 108 (54.3%) 91 (45.7%) 57 (28.6%) 52 (26.7%) 34 (17.1%) 56 (28.1%) 1.04 [0.872-1.055] .05 JAK2-RT > 50% 37 (18.6%) 26 (13.1%) 11 (5.5%) 1.27 [0.073-2.879] .04 CALR mut. 60 (30.1%) 19 (9.5%) 41 (20.6%) 2.14 [0.301-1.902] .001 CALR type 1 CALR type 2 46 (23.1%) 14 (7.0%) 11 (5.5%) 8 (4.0%) 35 (17.6%) 6 (3.0%) 3.01 [1.527-3.812] 0.97 [0.833-1.056] .0001 1.00 MPL mut. 3 (1.5%) 2 (1.0%) 1 (0.5%) 1.00 [0.663-1.044] 1.00 Time-progression2 67.3 (15-109) 70.2 (53-109) 33.7 (15-56) 2.83 [0.328-1.913] .0001 Hgb3 15.3 (12.8-16.4) 14.8 (12.8-15.5) 15.2 (13.6-16.4) 1.04 [0.923-1.088] .43 LDH serum levels4 402.7 (205-612) 230.3 (205-390) 407.9 (288-612) 1.54 [0.045-3.235] .003 Palpable splenomegaly 111 (55.8%) 49 (24.6%) 62 (31.1%) 1.82 [0.1797-3.759] .001 WBC5 11.8 (7.5-18.7) 10.3 (7.5-14.8) 14.4 (9.9-18.7) 1.80 [0.045-3.733] .002 PLT6 620.1 (366-861) 520.6 (366-650) 710.3 (490-861) 2.46 [0.087-2.279] .0001 A/V thrombosis 74 (37.2%) 30 (15.1%) 44 (22.1%) 1.03 [0.243-1.912] .001 Major bleeding 30 (15.1%) 14 (7.0%) 16 (8.0%) 1.00 [0.928-1.079] .42
JAK2-RT: JAK2 V617F allele burden; CALR mut: CALR exon 9 mutations (type 1 + type 2); MPL mut: MPL exon 10 mutations; Hgb: Hemoglobin: serum levels; LDH: Lactate dehydrogenase, serum levels; WBC: White blood cell count; PLT: Platelet count; A/V: Arterial/venous; HR: Hazard ratio; CI: Confidence interval]
1In years 2In months 3(g/dL) 4(UI/L) 5( x 109 /L ) 6( x 109 /L )
22
Table 3.
PV cohort: PFS multivariate analysis.Covariate b SE Wald P Exp(b) 95% CI of Exp(b)
Major bleeding -0.1562 0.3890 0.1614 0.6879 0.8554 0.3991 to 1.8333
JAK2 status 1.0726 0.4191 6.5500 0.0105 2.9229 1.2855 to 6.6460
M-ACT 2.3435 0.4761 24.2335 <0.0001 10.4180 4.0978 to 26.4858
WBC -0.1520 0.3604 0.1780 0.6731 0.8590 0.4239 to 1.7407
b= coefficient estimates; SE=standard error for coefficient estimates b; Exp(b)= Hazard Ratio value; 95% CI of Exp(b)= 95% confidence interval of Hazard Ratio. Major bleeding vs no major bleeding; JAK2 burden≥50% vs
JAK2 burden<50% (JAK2 status); Megakaryocyte activation vs no megakaryocyte activation (M-ACT);
23
Table 4.
Early/prefibrotic PMF subset: PFS multivariate analysis.Covariate b SE Wald P Exp(b) 95% CI of Exp(b)
WBC 0.4334 0.1879 5.3207 0.0211 1.5425 1.0673 to 2.2294 M-ACT 0.7659 0.1640 21.8235 <0.0001 2.1510 1.5598 to 2.9661 CALR status 0.3690 0.1685 4.7956 0.0285 1.4463 1.0395 to 2.0124 Gender 0.4071 0.1520 7.1702 0.0074 1.5024 1.1153 to 2.0240 LDH 0.1831 0.1749 1.0958 0.2952 1.2009 0.8524 to 1.6919 Palpable splenomegaly 0.3084 0.1746 3.1217 0.0773 1.3613 0.9668 to 1.9167 PLT 0.2415 0.1638 2.1729 0.1405 1.2731 0.9235 to 1.7551
b= coefficient estimates; SE=standard error for coefficient estimates b; Exp(b)= Hazard Ratio value; 95% CI of Exp(b)= 95% confidence interval of Hazard Ratio. CALR mutations vs no CARL wt (CALR); Gender male vs
Gender female (Gender); Megakaryocyte activation vs no megakaryocyte activation (M-ACT); WBC≥11.0x10⁹/l
vsWBC<11.0x10⁹/l; LDH≥250 UI/l vs LDH<250 UI/l; Palpable splenomegaly vs no palpable splenomegaly; PLT≥450x109/l vsPLT<450x109/l.
24
Figure legend
Figure 1.
Representative images of Megakaryocytic activation (M-ACT) in PV (panels A-C) and in early/prefibrotic PMF (panels D-F). Panels A and D: the panels show the emperipolesis, defined as the presence of at least one leukocyte (indicated by black arrows) or a precursor of hematopoiesis within the cytoplasm of a MK (400X magnification). Panels B and E: the panels show MK clustering, defined as an aggregation of 3 or more megakaryocytes in close contact with each other (200X and 400X magnification for panel B and E, respectively). Panels C and F: the panels show the peri-MK fibrosis, defined as the arrangement of collagen fibers around the perimeter of activated MKs (400X and 200X magnification for panel C and F, respectively).Figure 2.
Kaplan-Meier curves for PFS of PV and of early/prefibrotic PMF patients. Panel A shows the Kaplan-Meier curve for PFS of PV patients stratified by M-ACT. Panel B shows the Kaplan-Meier curve for PFS of early/prefibrotic PMF patients by M-ACT. M-ACT positive patients (red-line) was significantly associated to a worse PFS (p<0.0001) respect to those without M-ACT (blue-line) in both groups.Supplemental data Table 1S ET Overall (n=23) Age1 61.4 (42-75) Male Female 14 (60.9%) 9 (39.1%) JAK2-RT > 50% 7(30.4%) CALR mut. 2 (8.7%) CALR type 1 CALR type 2 1 (4.3%) 1 (4.3%) MPL mut. 0 (0%) Hgb3 14.3 (13.8-15.7) LDH serum levels4 245.1 (180-322) Palpable splenomegaly 4 (17.4%) WBC5 9.8(7.1-11.8) PLT6 615.3 (453-811) A/V thrombosis 6 (26.1%) Major bleeding 3 (13.0%) 1In years 2In months 3(g/dL) 4(UI/L) 5( x 109 /L ) 6( x 109 /L )
Supplementary figure legend Figure 1S
Kaplan-Meier curves for PFS of PV patients stratified for JAK2 status, bleeding and WBC count. Patients with JAK2 burden≥50% and history of bleeding (red line) had a significant correlation with a worse PFS (for JAK2 status, P=.0225, HR 2.1274, 95% CI from 1.1124 to 4.0683; for bleeding, P=.0174, HR 2.9615, 95% CI from 1.2104 to 7.2458) respect to those with JAK2 burden<50% and without history of bleeding (blu-line). Patients with WBC count≥11x109/l (red line) showed a certain trend toward significance with a worse PFS (P=.0823; HR 0.5171, 95% CI from 0.2458 to 1.0880) respect to those with WBC count<11x109/l (red line).
Figure 2S
Kaplan-Meier curves for early/prefibrotic PMF stratified for CALR mutations (type 1 and type 2 mutation), PLT count, WBC count, splenomegaly, LDH level and gender. Patients with WBC
count≥11x109/l, CALR type 1 mutation, PLT≥450x109/l, palpable splenomegaly, LDH≥250UI/l and female gender (red line) had a significant correlation with a worse PFS (for WBC count, P<.0001, HR 1.9458, 95% CI from 1.4395 to 2.6303; for PLT count, P<.0001, HR 1.9993, 95% CI from 1.4597 to 2.7384; for splenomegaly, P<.0001, HR 1.8993, 95% CI from 1.4132 to 2.5524; for LDH level, P=.0025, HR 1.5678, 95% CI from 1.1710 to 2.0991; for gender, P=.0187, HR 1.4125, 95% CI from 1.0592 to 1.8835; for CALR status; CALR type 1 mutation versus CALR wild type, P<.0001, HR 2.1476, 95% CI from 1.4040 to 3.2850) respect to those with WBC count<11x109/l, CALR wild-type, PLT<450x109/l, absence of palpable splenomegaly, LDH<250UI/l and male gender (blu-line).
Figure 3S
Kaplan-Meier curves for PFS early/prefibrotic PMF and ET stratified for M-ACT parameter. ET patients that did not have a M-ACT in any case showed a significant correlation with a better PFS in comparison to both early/prefibrotic PMF with that without M-ACT (P<.0001).