RSCAS 2015/29
Robert Schuman Centre for Advanced Studies
Florence School of Regulation Climate
An Analysis of Allowance Banking in the EU ETS
European University Institute
Robert Schuman Centre for Advanced Studies
Florence School of Regulation Climate
An Analysis of Allowance Banking in the EU ETS
Denny Ellerman, Vanessa Valero and Aleksandar Zaklan
This text may be downloaded only for personal research purposes. Additional reproduction for other purposes, whether in hard copies or electronically, requires the consent of the author(s), editor(s). If cited or quoted, reference should be made to the full name of the author(s), editor(s), the title, the working paper, or other series, the year and the publisher.
ISSN 1028-3625
© Denny Ellerman, Vanessa Valero and Aleksandar Zaklan, 2015 Printed in Italy, April 2015
European University Institute Badia Fiesolana
I – 50014 San Domenico di Fiesole (FI) Italy
www.eui.eu/RSCAS/Publications/ www.eui.eu
Robert Schuman Centre for Advanced Studies
The Robert Schuman Centre for Advanced Studies (RSCAS), created in 1992 and directed by Professor Brigid Laffan, aims to develop inter-disciplinary and comparative research on the major issues facing the process of European integration, European societies and Europe’s place in 21st century global politics.
The Centre is home to a large post-doctoral programme and hosts major research programmes, projects and data sets, in addition to a range of working groups and ad hoc initiatives. The research agenda is organised around a set of core themes and is continuously evolving, reflecting the changing agenda of European integration, the expanding membership of the European Union, developments in Europe’s neighbourhood and the wider world.
Details of the research of the Centre can be found on: http://www.eui.eu/RSCAS/Research/
Research publications take the form of Working Papers, Policy Papers, and e-books. Most of these are also available on the RSCAS website:
http://www.eui.eu/RSCAS/Publications/
The EUI and the RSCAS are not responsible for the opinions expressed by the author(s).
Florence School of Regulation Climate
Florence School of Regulation Climate (FSR Climate) is a research group within the Robert Schuman Centre for Advanced Studies. Its goal is to provide a reliable source for information and analysis of EU climate policy and a forum for discussion of research carried out in this area among government officials, academics and industry.
FSR Climate is directed by Xavier Labandeira, Professor of Economics at the University of Vigo and it works in collaboration with the energy and regulatory policy research groups of the Florence School of Regulation.
The opinions expressed in this paper are those of the author(s) and do not represent the views of the European University Institute or any of its subsidiary components.
An Analysis of Allowance Banking in the EU ETS
∗
Denny Ellerman
†Vanessa Valero
‡Aleksandar Zaklan
§March 21, 2015
The existence of some 2 billion unused EU Allowances (EUAs) at the end of Phase II of the EU’s Emissions Trading System (EU ETS) has sparked considerable debate about structural shortcomings of the EU ETS. At the same time, there has been a surprising lack of interest in one possible explanation of this accumulation of EUAs: the theory of intertemporal permit trading, i.e. allowance banking. In this paper we adapt basic banking theory to the case of a smoothly declining cap such as that in the EU ETS. We show that it is rational for agents to decrease emissions beyond the constraint imposed by the cap initially, accumulating an allowance bank and then drawing it down in the interest of minimizing abatement cost over time. Having laid out the theory, we carry out a set of simulations for a reasonable range of key parameters, calibrated to the EU ETS, to illustrate the effects of intertemporal optimization of abatement decisions on optimal time paths of emissions and allowance prices. We also explore the effect of an unexpected change in counterfactual emissions. We conclude that bank accumulation as the result of intertemporal abatement cost optimization should be considered at least a partial explanation when evaluating the current discrepancy between the cap and observed emissions in the EU ETS.
JEL classification: D92, F18, Q54
Keywords: Cap and Trade System, EU ETS, Intertemporal Trading.
∗
We thank Juan-Pablo Montero, Kristina Czura and participants of the EUI’s 2013 Annual Climate Policy Research Conference and the 6th Atlantic Workshop on Energy and Environmental Economics for very helpful discussions. The work on this paper took place while Valero and Zaklan were at the European University Institute as Jean Monnet Fellows.
†
European University Institute.
‡
1
Introduction
The existence of 2 billion unused allowances at the end of Phase II of the European Union’s Emissions Trading System (EU ETS), roughly 20% of the …ve-year cap, is often cited as the cause of the current low price of European Union Allowances (EUAs) and a sign of some fundamental ‡aw in the design of the EU ETS. The existence of this permit bank is variously attributed to e¤ects of the …nancial crisis of 2008 and the subsequent euro crisis on GDP growth, to the use of nearly 1.1 billion o¤sets, and to the promotion of energy from renewable sources that has displaced generation by CO2 emitting coal and natural gas. The observed discrepancy between allowances distributed and allowances used has been the motivation for the debate about “ back-loading” that dominated discussion concerning the EU ETS in 2013, as well as for the proposal made in January 2014 to establish a Market Stability Reserve. Both of these measures would reduce the number of allowances available in the near term while putting the withdrawn allowances back into circulation at a later time.
Firms in the EU ETS have accumulated unused allowanes at the end of both its …rst and second phases, 2005-07 and 2008-12, although the quantities banked and allowance prices were strikingly di¤erent in each case. The bank at the end of Phase I was approx-imately 100 million allowances, less than 2% of the three-year total and approxapprox-imately one-twentieth of the unused allowances existing at the end of Phase II. In the …rst case the allowance price was zero well before the end of Phase I. In contrast, while the price at the end of Phase II was much lower than expected at the beginning of Phase II (…ve instead of thirty euros), it was never driven to zero. These two situations occurred in contexts with very di¤erent rules governing allowance banking. The rules developed for Phase I, which was envisaged as a trial or experimental period, did not allow the carry-over of any unused allowances and their use for compliance in Phase II. In contrast, the rules for Phase II allowed such carry-over and later use in the post-2012 ETS. It is therefore clearly relevant to consider the e¤ects of allowing permit banking on the optimal time paths of emissions, abatement, banked allowances and permit prices starting in Phase II.
Given the ability to bank allowances in Phase II for later use, it is surprising how little attention has been given to the application of allowance banking theory to the EU ETS. This neglect is the more surprising for the extent to which banking was recognized as a major factor in explaining agent behavior in the US SO2 Emissions Trading Program (Schennach, 2000; Ellerman et al., 2000; Ellerman and Montero, 2007). That program was, however, structured di¤erently from the EU ETS, the main di¤erence being a pre-determined sharp discontinuity in the cap between Phases I and II. In contrast, there is
no similar discontinuity either in cap level or coverage in the EU ETS.1 While the
…ve-1Although the relative expansion in terms of a¤ected units has not been as pronounced as between
year cap was ‡at during Phase II, a linear reduction factor of 1.74% of the average total quantity of allowances issued annually during Phase II become e¤ective at the start of Phase III. Arguably, the absence of a marked discontinuity in the level of the cap did not raise the specter of a sharp increase in the marginal cost of abatement that would create an obvious motivation to bank, as in the US SO2 Program. Still, a steadily declining cap could be expected to lead to rising marginal abatement cost over time and this was the general expectation as evidenced by no small number of modelling studies that sought to predict EUA prices beyond the next few years. The question of whether the expected increase in marginal cost would be enough to warrant banking (and if so, at what levels) seems simply never to have been asked.
This paper seeks to remedy that failure of analysis. We do not attempt a de…nitive answer that settles the question once and for all time, but only to explore the implications of allowance banking in a cap and trade system with a continually declining cap, such as the EU ETS. We characterize the main determinants of permit banking before exploring these implications, especially concerning the levels of banked EUAs that might be ex-pected at the end of Phase II under speci…c assumptions. Doing so requires …rst of all that the theory of allowance banking (Rubin, 1996; Cronshaw and Kruse, 1996; Kling and Rubin, 1997; Schennach, 2000; Leiby and Rubin, 2001) be …tted to the speci…cs of the EU ETS. The next section presents and explains the theory of allowance banking as it would be applied to the EU ETS. Section 3 discusses reasonable values for critical parameters. Section 4 presents simulations of plausible banking outcomes for the EU ETS. Section 5 considers the e¤ect of changes in expectations. Section 6 discusses these results, while section 7 concludes.
2
Intertemporal Trade with a Linearly Declining Cap
2.1
An Intuitive Explanation of Allowance Banking
Allowance banking is a manifestation of trading through time instead of the more familiar trading across space in the same time period. Intertemporal trading could involve
borrow-ing, but in the EU ETS, as in most allowance trading programs, borrowing is not allowed.2
Thus, agents cannot use tomorrow’s allowances to cover today’s emissions, but they can use any allowances not used to cover today’s emissions to cover tomorrow’s emissions.
The basic intuition of allowance banking is similar to that for spatial trading. If the
of both new countries and sectors.
2It has been possible (and continues to be for some agents) to borrow one year ahead because of
the schedule by which freely allocated allowances are distributed in relation to when allowances must be surrendered against emissions. Intertemporal trading usually implies multi-year horizons so that this exception does not invalidate the basic rule against borrowing. Besides, with free allocation being phased out in Phase III, the ability to use this near-term ‡exibility is being progressively reduced.
2
marginal cost of abating a ton of emissions is higher at one place or time than at another, cost savings can be gained by reducing more than required where or when it is cheaper and using these allowances to cover emissions where and when it is more costly. Trading across time invokes two further considerations, namely, whether borrowing is permitted and the discount rate for comparing today’s and tomorrow’s costs. When borrowing is not allowed, the calculation is only whether tomorrow’s expected cost is higher than today’s given the discount rate. If tomorrow’s discounted expected cost is higher than today’s cost, it is worth holding allowances, whether obtained by abating more today or by purchase, and using them to either cover some of tomorrow’s emissions or sell them later on. If that expectation is not true, then it is not worth accumulating allowances. It would be more pro…table to use or sell any allowances held, however obtained, at today’s price and earn the return represented by the discount rate than to continue holding them. While the theory and basic intuition of allowance banking is clear, any particular application requires …tting the theory to the structure of the particular allowance trading program. For the EU ETS, the essential features of the cap are that it starts at a level at or only slightly below initial counterfactual emissions and declines continuously at a pre-speci…ed linear reduction rate (LRF). The LRF implies, under the usual assumption of rising costs with increasing amount of abatement, and with all other things equal, that the marginal cost of abatement will rise over time as the cap declines. How much marginal cost (or the price) will rise depends not only on how much abatement is implied by the cap, but also on the marginal abatement cost function. The issue for the individual agent is whether the expected increase in marginal cost over time is greater than the discount rate. If it is, banking is justi…ed; if not, there is no point in accumulating allowances for use later.
Whether the expected rising cost would justify banking (and if so, how much) depends on the relationship between the cap and expected counterfactual emissions. Consider, for instance, an initial cap that is set at a level 1% below counterfactual emissions and that then declines at 1% per year while counterfactual emissions are expected to be constant. In the …rst year, the required abatement is 1% of counterfactual emissions, 2% in the second year, 3% in the third year and so on. Assuming a simple linear marginal cost function, marginal cost will double in the second year, increase by 50% in the next year, 33% in the following year and so forth in a continually declining series as the additional abatement required in each succeeding year becomes smaller in proportion to abatement in the past year. So long as the marginal abatement cost increases at a rate greater than the discount rate, holding allowances for later use is justi…ed However, at some point in the future, typically denoted as , the rise in the marginal cost of abatement will be less than the discount rate. At this point in time, with the expected rise in marginal cost and price less than the discount rate, the incentive to hold allowances disappears and, if they could, agents would borrow allowances from future allocations for current use. Since
long-term borrowing is not allowed in the EU ETS, aggregate emissions beyond this point will be equal to the cap.
The period of time during which …rms hold allowances, …rst accumulating them and then drawing them down, is called the banking period. How much banking will occur and for how long, and with what e¤ect on the allowance price, depends on the values embedded in the agents’expectations. To answer such questions and to put more structure on the manifestations and e¤ects of allowance banking, we turn to the theory as applied to the speci…cs of the EU ETS.
2.2
The Model of Intertemporal Trading
We develop a model representing a cap and trade system for greenhouse gas emissions.
Contrary to the SO2 programm analysed by Rubin (1996) and Schennach (2000), the
amount of allowances is limited by a cap which is reduced over time.
As stated in previous literature, the …rms’ level of emissions can be characterized
as if a single central planner were making the decision.3 The latter wants to minimize
the presented discounted abatement cost with respect to the aggregate level of emissions when banking is allowed. He thus faces the following in…nite-horizon dynamic abatement cost-minimization problem (P): min fetg Z 1 0 e rtC(ut et) dt s.t. Bt = Yt et (1) Bt 0 (2)
where C is the abatement cost, i.e. the cost of reducing emissions where C0(:) > 0 and
C00(:) > 0.4 The quantities abated correspond to the di¤erence between u
t, the aggregate
counterfactual emissions (i.e. the emissions emitted without any restriction on emissions
by all …rms participating in the system) and et;the aggregate level of emissions at time t.
The variable r corresponds to the discount rate, assumed to be constant over time. The
variable Bt refers to the number of allowances in the bank, assumed non-negative, which
evolves according to the state equation (1). It states that the annual change in the bank
is the di¤erence between each period’s cap Yt and emissions et.5
As is the case in the EU ETS, we assume that the cap Yt decreases each period at a
constant rate a (known as the LRF) such that: Yt = e atY0 3See Rubin (1996) and Schennach (2000).
4We assume no technological progress so the cost function does not change with time. 5Note that B
tcan be either positive or negative with positive values signaling a build-up of the bank
and negative values indicating a draw-down of the bank.
4
where Y0 is the initial cap.
We also assume that the aggregate counterfactual emissions ut increase each period
at a constant rate b such that:
ut= ebtu0
where u0 is the initial level of counterfactual emissions.
We then de…ne the Lagrangian expression of the problem (P):6
L e rtC(ut et) + t(Yt et) tBt
where t and t are multipliers associated with the constraints on the change in size
of the bank and on borrowing, respectively. As shown by Rubin (1996) and Schennach (2000), di¤erentiation of the Lagrangian to obtain the …rst-order conditions and further rearrangement of terms leads to the following equation for the change in the marginal cost (mc) of abatement through time:
mc(ut et) = r mc(ut et) t (3)
Equation (3) states that the change in marginal cost over time along the optimal path will be equal to the discount rate minus the shadow price of the constraint on borrowing. The conditions for the solution of the optimal path are such that, after the banking period (i.e.
for t ) when the bank is exhausted (Bt = 0) and the borrowing constraint (Bt 0)
becomes operative, the shadow price is strictly positive > 0. Consequently, marginal
cost mc increases at a rate less than the discount rate. Since reducing emissions is costly
for …rms, the aggregate level of emissions et will be equal to the cap such that:
et = Yt (4)
These same conditions imply that when agents are banking a positive quantity of
allowances Bt> 0 during the banking period (i.e. for 0 t < ), the multiplier tis zero
so that the marginal cost mc increases at the discount rate. During this time interval and given initial marginal cost, the evolution of marginal cost can be expressed as:
mc(ut et) = ertmc(u0 e0) (5)
From equations (4) and (5), we derive the path of the allowance price Pt over the
entire time horizon from 0 to 1 such that:7
Pt=f ertmc(u 0 e0) mc(ut Yt) f or t < f or t
6To solve this continuous time minimisation problem, we use optimal control theory.
7In this dynamic equilibrium model, we assume perfect competition so that the allowance price equals
the marginal abatement cost.
From this, the path of emissions can also be deduced: et=f ut ert(u0 e0) Yt f or t < f or t (6)
During the banking period, emissions will be equal to counterfactual emissions less the amount of abatement forthcoming at each point in time. Thereafter, the cap will
determine emissions. The remaining task is to determine the initial level of emissions e0,
which depends on the discount rate and the end of the banking period .
By prior reasoning and the conditions for de…ning an optimal banking program, the allowance price increases at the discount rate during the banking period. We thus can
rewrite the path of price Pt depending on the end of the banking period such that:
Pt= mc(ut et) = e r( t)mc(u Y ) (7)
which leads to P0 = e r mc(u Y ) and e0 = u0 e r mc(u Y ):
Also, since all the allowances issued over the banking period must be equal to the cumulative emissions at , we have:
Z 0 etdt = Z 0 Ytdt (8) , Z 0 etdt = Y0 a (1 e a )
Finding is then an iterative process of …nding the point in time when the condition
expressed by equation (8) is met. Any point in time before implies a lower price during
the banking period, less abatement, more cumulative emissions than allowances issued until then, and therefore a violation of this condition. Conversely, any point in time
after implies a higher price path, more abatement, and fewer cumulative emissions than
allowances, also a violation of the condition. Once is found, everything else follows, as
illustrated in the simulations. The analytical solution when assuming a linear marginal abatement cost function is presented in the Appendix.
3
Intertemporal Trading in the EU ETS
Applying the allowance banking theory explained in Section 2 to the EU ETS and sim-ulating how agents might be expected to behave requires assumptions about several pa-rameters. The goal of the simulations presented in the next section should be considered exploratory and expository rather than an attempt to model accurately the past and future development of the EUA bank.
We remind the reader that the simulations correspond to the model as presented in the previous section of this paper, i.e. the world is perfectly deterministic and there are
6
no shocks or changes in expectations concerning the relevant variables. Of course, in reality shocks do occur and expectations may and typically will change over time. Still, the fundamental insights and motivations for banking remain and the basic structure will remain unchanged. For these reasons, no attempt is made to calibrate parameter values to match the paths observed to date. However, the e¤ect of reasonable variations in parameter values are presented and discussed to provide the reader with a sense of how results are a¤ected by changes in these values.
3.1
Discount Rate
The futures market for EUAs provides data concerning the discount rate that agents apply in valuing present and future values at least for the term of the various EUA futures contracts. Unfortunately, these contracts extend only three to four years into the future, less than what the banking period would likely be, but they are a starting point. Moreover, the yield curves in these contracts are remarkably stable, much as would be expected given the Hotelling-like price path that is predicted by equation (3), and very unlike the variations from backwardation to contango that can be observed in
the futures markets for commodities (Ellerman, Marcantonini and Zaklan, 2014).8 The
implied discount rates are always positive and since the beginning of 2008 they have varied between a low of 1.4% and a high of 9.1% with most observations falling between 2.5%
and 5.5%.9 The relationship to the euro interest rate set by the European Central Bank,
which started the period at 4% and had been reduced to 0.75% in 2012 and more recently to 0.25%, is decidedly tenuous. For this reason it is not clear how to approximate the discount rate. We thus chose a range of discout rates for the simulations that follow, applying a central rate of 4%, with variations of 3% and 5%.
3.2
Growth in Counterfactual Emissions
Counterfactual emissions, the evolution of emissions in the absence of the EU ETS, are not known with any certainty, but some estimate of these emissions and therefore of the abatement occasioned by the EU ETS, is implicit in today’s price, not to mention future prices. As discussed in Ellerman et al. (2010), reconstructions of pre-2005 emissions for the ETS sectors indicated a rate of increase of about 1% per annum since 2000 at a time when EU15 GDP was increasing at a rate of about 2%. These data imply a 1% rate of
8A potential explanation is that an inventory stock-out is virtually impossible in allowance markets
since allowances are not required inputs at the time of emissions (although the liability is then incurred) and agents typically have a grace period of several months after the close of each compliance period before allowances equivalent to the compliance-period emissions must be surrendered.
9The average discount rate for the prompt and next contracts (the most thickly traded) for weekly
observations since the beginning of 2008 is 3.98% with a median of 3.92% and a standard deviation of 1.53%.
decline in CO2 emissions per unit of GDP and are consistent with the regularly observed secular improvement in the carbon e¢ ciency of economies which is often used modelling
the relation between GDP growth and CO2 emissions.10 For the purpose of the simulations
presented here, high and low growth assumptions are presented, as well as an intermediate value. These assumptions can be taken to re‡ect the relatively optimistic expectations concerning economic growth that prevailed until the …nancial crisis of late 2008 and the considerably dampened expectations that have prevailed since. Counterfactual emissions are assumed to increase at a constant rate , for which the upper and lower values are 1.0% and 0.1% annual growth with 0.5% as the intermediate value. Assuming an underlying trend of 1.0% improvement in the carbon e¢ ciency of the economy, these values imply
growth rates for output in the ETS sectors between 1% and 2% per annum.11 Again,
no claim is made that these values are accurate re‡ections of the expectations that have informed market and banking behavior. They are plausible, but their value for our present purpose is illustrative.
3.3
Slope Coe¢ cient of the Declining Cap
In contrast to counterfactual emissions and discount rate, the cap is always known, em-bedded in legislation with as much certainty as implemented policy provides. In the case of the EU ETS, the rate of decline is speci…ed in the amended ETS Directive, 1.74%
annually.12 ;13 The relation of this precisely de…ned cap to initial counterfactual relations
is not known, but it is widely believed that the initial EU ETS cap was at or very little below business-as-usual emissions (Ellerman et al., 2010). For simplicity, we assume that the initial level of both the cap and counterfactual emissions is the same and that the cap
declines inde…nitely at a constant rate a of 1.74% annually.14
10Typically, this trend is represented by an AEEI factor re‡ecting Autonomous (i.e., non-price induced)
Energy E¢ ciency Improvement. A typical example is the EPPA model developed at MIT (Paltsev et al. 2005).
11Given the observed stagnation in EU GDP over the past few years, this assumption implies declining
CO2 emissions; however, we would note that as long as the rate of decline in emissions is less than that of the declining cap, increasing future shortage is implied and the analysis presented here, working with always positive parameter values, remains valid.
12In its recent communication concerning the 2030 framework for climate and energy policy, the
Eu-ropean Commission has suggested that a decline rate of 2.2% starting in 2021 would be consistent with the proposed legally binding target of reducing EU greenhouse gas emissions to 40% below 1990 levels by 2030. However, a speci…c proposal to do so was not put forward at this time. That will be one of the many measures to be decided following the Parliamentary elections in May 2014 and the installation of a new Commission thereafter.
13This linear reduction factor has been interpreted as a constant decrement equal to 1.74% of the
average annual cap in Phase II. In the interest of simplicity, we ignore what will be an accelerating decrement when expressed as a proportion of each year’s cap. This detail will modify speci…c results but not change the basic nature of banking or the conclusions presented here.
14While the cap was ‡at during Phase II and the linear reduction factor of 1.74% was applied starting
with the 2013 compliance year, the theoretical analysis and simulations in this paper assume a linearly declining cap from the beginning to simplify the exposition.
8
3.4
Speci…cation of the Marginal Abatement Cost Function
The shape of the aggregate marginal abatement cost function is perhaps the least re-searched aspect of the EU ETS. Every model representing the EU ETS implicitly has such a function, which is inevitably the result of values assigned to various elasticities or to cost engineering data. The common feature of all is the economic intuition that mar-ginal costs rise as the amount of abatement increases. As others have done (cf. Schennach, 2000, and Ellerman and Montero, 2007), we assume a time-invariant, linear marginal cost function with parameters chosen for the underlying total cost function to yield prices roughly in line with observations.
4
Simulations
4.1
Emissions and Prices in the Baseline Case
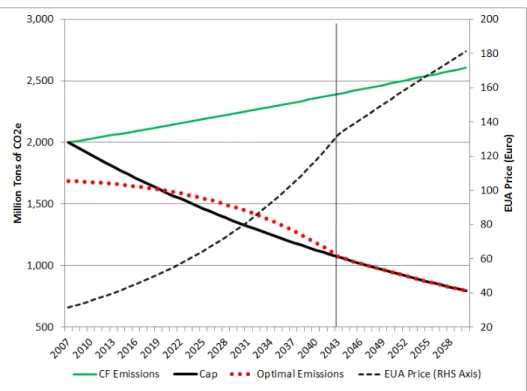
Figure 1: Cap, Emissions, Price Path, Baseline Case
Figure 1 illustrates the simulation results for the baseline case, where counterfactual emissions grow at an annual rate of 0.5% and the representative agent discounts the future at a rate of 4%. In this …gure and subsequent ones, results are measured both by quantities and prices. In Figure 1, the cap, counterfactual emissions, and the optimal emission path are to be read against the millions of tons of CO2 on the left-side scale. The price path should be read against the right-side scale which is in euros per ton of
CO2. The evolution of the bank itself in this baseline case is the middle line in Figure 2.
Figure 2: Optimal Cumulative Bank, Varying Discount Rates
The vertical line in Figure 1 marks the end of the banking period (2043). This is when the emissions path becomes permanently coincident with the cap because of the inability to borrow and a kink is observed in the price path when the rate of increase in allowance prices becomes less than the discount rate. Comparing the optimal emissions path with the cap shows that emissions will be below the cap for an initial sub-period of accumulation, ending in 2019 for this simulation. Thereafter, the accumulated bank is drawn down over a period of 24 years and emissions exceed the cap in these years. Of course, for the banking period as a whole, cumulative emissions equal cumulative allowed emissions. The cross-over year (when emissions momentarily equal the cap and the draw-down of the bank starts) is also when the bank reaches its peak value. Note also that the accumulation phase is considerably shorter (11 years) than the draw-down phase (24 years), which implies that average amount by which emissions are below the cap in the accumulation phase is roughly twice the average by which emissions will be above the cap in the subsequent draw-down phase. In the following we explore the e¤ects of varying the discount rate, rate of growth in counterfactual and slope of the cap on the optimal banking and price paths.
10
4.2
Changing the Discount Rate
Varying the discount rate generates substantial changes both in the size of the bank and in the length of the banking period (Figure 2).
For instance, applying a discount rate of 5% shortens the banking period by 7 years compared to the baseline case using a 4% discount rate and decreases the maximal bank by about one third. Applying a 3% discount rate lengthens the banking period by 10 years and increases bank’s maximum size by more than 50%. In both instances, the discount rate signals whether returns from alternative investments promise higher or lower returns with consequent e¤ects on allowance banking.
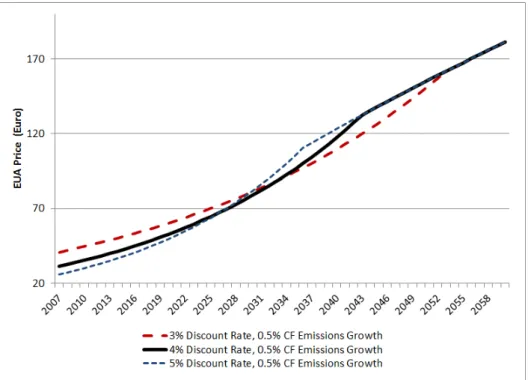
Figure 3: Optimal Price Path, Varying Discount Rates
Variations in discount rates also have an impact on the optimal permit price path (Figure 3). Changing the discount rate not only changes the length of the banking period, as already noted, and thereby the associated reference price that anchors the price path, but also the rate of price increase during the banking period. Mechanically, a lower discount rate means that the point when marginal abatement cost rises less than the discount rate is farther in the future. The lower discount rate makes future abatement more costly relative to the present thereby justi…ying more early abatement to mitigate those costs, a higher initial price, a longer banking period and a larger bank. A higher discount rate has the opposite e¤ect.
4.3
Varying the Growth Rate in Counterfactual Emissions
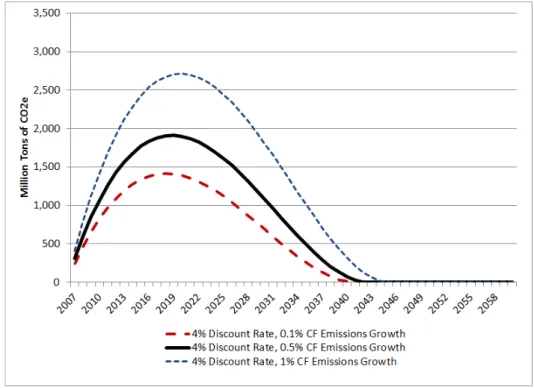
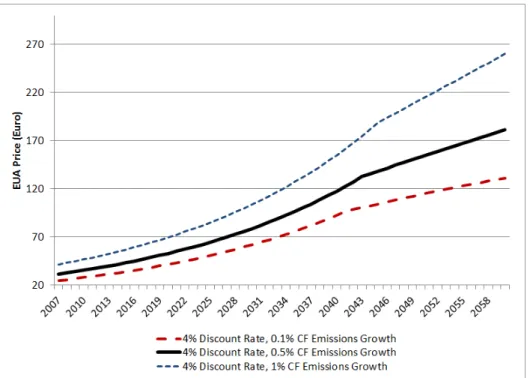
Varying the growth rate of counterfactual emissions mainly a¤ects the maximal size of the bank (Figure 4) and has, in comparison to changes in the discount rate, relatively little impact on the length of the banking period. Whether the growth rate is 0.1% or 1.0% changes the length of the banking period by only 4 years. However, the e¤ect on the maximal bank size is more substantial. Changing the counterfactual emissions growth from the middle value of 0.5% to 1% increases the maximal size of the bank by almost 50%, and a change of the growth rate in the opposite direction, from 0.5% to 0.1%, decreases the maximal bank size by about 25% with respect to the baseline case. Changing the growth rate in counterfactual emissions also strongly a¤ects the price path (Figure 5), since greater growth in counterfactual emissions requires more abatement and shifts up the price path without changing the rate of increase in marginal cost and price.
Figure 4: Optimal Cumulative Bank, Varying Growth in Counterfactual Emissions
12
Figure 5: Optimal Price Path, Varying Growth in Counterfactual Emissions
5
Change in the Growth of Counterfactual Emissions
In this section we consider an unanticipated change in the growth rate of counterfac-tual emissions in order to illustrate the dynamic e¤ects on banking behavior and permit prices. Typical reasons for such a shift could be a change in expectation concerning future economic growth or a change in the underlying secular trend towards improving economy-wide energy and carbon e¢ ciency. As shocks occur agents will change their actions accordingly and it is these corrections that we now seek to illustrate.
The following discussion considers only a decline in the expected rate of growth of counterfactual emissions. From an applied standpoint, this is more relevant for the EU ETS in that the current policy discussion concerns allowance prices that are lower than expected before 2008 due to some combination of lower expected GDP growth and greater than expected uptake of renewable energy sources and energy conservation. We also consider the e¤ects of a compensating tightening of the cap on banking behavior and allowance prices. Opposite changes in these parameters would have opposite e¤ects.
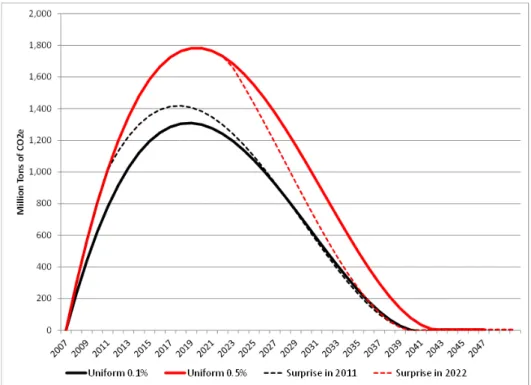
To illustrate the e¤ects of a downward shift in the path of counterfactual emissions, we consider two cases: a change that occurs in 2011, relatively soon after the start of the
program, and another that occurs much later, in 2022. To facilitate comparison with the cases illustrated in the preceding section, we posit a change from an initially expected constant growth rate of 0.5% per annum to 0.1% per annum occurring at the end of the years 2011 and 2022. To simplify, we also assume that the growth rate only features a single change, growing at a constant rate prior to and at a lower constant rate after the change.
Figure 6: Price Comparison, Unexpected Changes in CF Emissions
The most salient feature of the “surprise” cases is that the e¤ect on the price of al-lowances is immediate, producing a sudden lowering of the expected price path compared
to the no-change scenario.15 Moreover, the “corrected” price paths are intermediate
be-tween the paths that would have occurred if initial expectations of 0.5% or 0.1% annual growth had persisted. When the surprise occurs relatively soon after the start of the cap-and-trade program, the resulting price path is very close to the path that would have obtained if the corrected expectation had prevailed from the beginning. Still, it will be higher since the …rst few years did require more abatement to meet the unchanging cap. As shown by the later, 2022 surprise, the resulting price path is higher than with the 2011 surprise since cumulative abatement requirements are greater.
Unexpected changes also lead to markedly di¤erent banking paths, as shown by Figure
15We use the expressions “surprise” and “unexpected” synonymously.
14
7 below.
Figure 7: Bank Comparison, Unexpected Changes in CF Emissions
Up to the time of the change in expectation, banking is identical with the uniform 0.5% case, since that is what is then expected, but the adjustment thereafter is strongly conditioned by the newly revealed, overly large bank at the time of the surprise. In the earlier 2011 case, the rate of accumulation diminishes considerably re‡ecting the now known reduced future abatement requirements, but accumulation continues for a few years before the bank peaks earlier and at a lower level than would have occurred without the surprise. In time, the bank converges to the banking levels that would have occurred with a uniform 0.1% increase in counterfactual emissions. The same convergence can be observed with the later 2022 surprise, which occurs after the peak, when the draw-down has already begun. In this case, convergence to the uniform 0.1% case is also observed, which implies an accelerated draw-down of the bank and a shorter banking period. In both cases, the di¤ering post-surprise price paths are such as to adjust the rate of change in the level of the bank, given the reduced future cumulative abatement requirement and the now revealed “too large” bank.
Close readers of the above may have noted that the price adjustments of these surprise scenarios are not that great and within what might be considered a range of normal variation in prices over the short to medium term, and certainly nothing like the signi…cant decline in the price of allowances that has been observed between 2008 and 2012 in the EU ETS (approximately from e25 to e5). Of course, the relatively small variation of price in
the cases presented re‡ect the relatively small change in the growth rate of counterfactual emissions, arguably also within a range of reasonable expectations. In what follows, we explore the e¤ects of a much larger change of expectation as well as the e¤ects of a simultaneous, compensatory tightening of the cap.
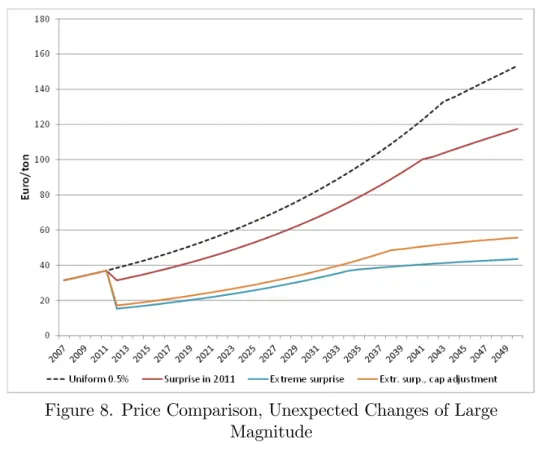
For this exercise and with an eye to the actual experience to date of the EU ETS, we limit discussion to the 2011 surprise and present two cases: 1) a fall of expected rate of change of counterfactual emissions from +0.5% per annum to –1.0% per annum without any compensating change in the cap, and 2) the same change with a simultaneous, compensatory acceleration in the rate of decline of the cap from 1.74% to 2.20% beginning
in 2021, as proposed in European Commission (2014).16 A long-term minus one percent
rate of decline in CO2 emissions is not what was projected when the EU ETS began, but with essentially stagnant GDP economic growth over the past few years and other policy measures promoting renewable energy and conservation, such a scenario is now plausible. Still, with the cap declining at an even greater 1.74% per annum, future scarcity is still certain whatever the size of the bank when the “surprise” arrives.
Figure 8. Price Comparison, Unexpected Changes of Large Magnitude
16For simplicity, we assume that the change in the rate of decline in the post-2020 cap is decided at
the same time as the change in expectation. In reality, and as demonstrated by the current debate in Europe, adoption of such a change will take some time and may occur with a probability of less than one; but, the point here is to show the e¤ect of such a proposal, assuming that the compensating cap adjustment will be enacted with certainty.
16
Figure 8 presents the price path chart for the three 2011 surprise cases. The dashed line is the uniform 0.5% growth case and the …rst solid line below it is the 2011 surprise case for a new rate of growth of 0.1% per annum, as previously presented. The two lower solid lines represent the cases of a more drastic change in expectation, to a future growth rate of -1.0%, with the bottom line showing the case without the proposed change in the post-2020 cap and the line above with that change.
The most salient feature is the signi…cant drop in the price of allowances, 50% from almost e40 to somewhat around e20 in 2012. More importantly for investment, the long term (circa 2050) expected price drops from over e100 to around e40 in the case without the compensating post-2020 adjustment of the cap. The main e¤ect of a compensatory tightening of the post-2020 cap is not so much to increase the present price as it is to raise the long-term price and thus to have more e¤ect on investment and future abatement than on current abatement.
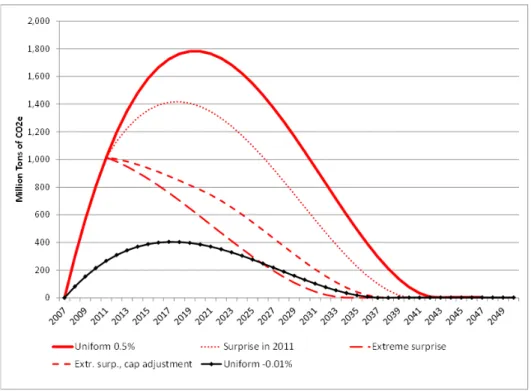
In presenting the corresponding aggregate banking paths, a new case marked with dia-monds is presented to facilitate understanding: a case in which the minus 1.0% reduction in counterfactual emissions is expected from the beginning.
Figure 9. Bank Comparison, Unexpected Changes of Large Magnitude
Banking still occurs with the uniform -1.0% case, but the maximal bank is much less than when +0.5% annual growth in counterfactual emissions is expected. The three in-termediate lines with dots, short dashes, and long dashes illustrate the 2011 surprises for
a sudden change in the expected growth rate from +0.5% to +0.1%, -1.0% with compen-sating post-2020 cap tightening, and the same -1.0% change without the compensatory cap change, respectively. The most salient feature of the two -1.0% cases is that the bank build-up stops and draw-down begins in order to converge with the path that would have obtained had this much lower rate of growth been expected from the beginning, just as has already been shown to be the case with a more modest reduction of expectations in the +0.1% case. The compensatory post-2020 tightening of the cap only slows the rate of draw-down, re‡ecting the e¤ects of the increase in expected cumulative abatement re-quirements as expressed by the higher price shown in the previous …gure. More generally, the lower the future cumulative abatement requirement in relation to the inherited bank (zero in the uniform case), the more the maximal bank level is shifted to the left and downward. And when the level of the inherited bank is greater than the maximum for the uniform case at the new, lower growth rate, the maximum is achieved at the time of the surprise and any di¤erences in future cumulative reduction requirements will show up in di¤ering rates of draw-down.
In e¤ect, the new price path is one determined by the combination of current abatement and what can be seen ex-post as mistaken, earlier “excess” abatement that achieves the cap at least cost. What is particularly notable is that the use of the “excess” banked abatement is spread over many years and not drawn down immediately. This highlights the long-term nature of the abatement cost minimization program pursued by the forward-looking agent. In all these cases, the di¤ering dynamics re‡ect the e¤ect of the present, expected cumulative abatement requirement given the discount rate (here 4.0%), the change in marginal abatement cost over time (linear by assumption), and the size of the accumulated bank (always non-negative), as explained in sections 2, 3 and 4.
6
Discussion
An examination of Figures 2 and 4 shows that, under the assumptions used, a stock of allowances would have been built up during the …rst …ve years of the ETS and that the optimal level at the end of 2012 would have been somewhere between 1.3 billion and 3 billion depending on parameter values. Moreover, all of these simulations suggest that the banking build-up has several years to go. On this evidence alone, allowance banking would seem to o¤er at least a partial explanation for the allowance stock accumulated during Phase II. Perhaps, the current level of the bank is larger (or smaller) than what our analysis suggests, but the fact that allowance banking would lead to comparable numbers should at the very least give pause to those who would suggest that the existence of such a surplus indicates some deep ‡aw in the design or functioning of the EU ETS. Instead, our results suggest that a considerable bank may accumulate as a rational response by
18
agents facing future scarcity who anticipate rising costs at a rate higher than the discount they apply in evaluating present and future costs.
We further explore and illustrate the e¤ects of a downward shock on the demand for allowances, that is, the required abatement to meet the cumulative allowed emissions over the relevant time horizons. Such shocks to the EU ETS have occurred in recent years, whether from reduced expectations of economic growth, greater than anticipated supply of o¤sets, or greater use of renewable energy due to policy-induced incentives to the deployment of these energy forms. Whatever the cause, such initially unexpected changes will cause allowance prices to be lower both than what they would have been with no downward shock or a fully anticipated one. An observation that has particular relevance to the EU ETS is that when banking is allowed and future scarcity continues to be expected, banking will continue, albeit at changed rates of accumulation and draw-down. Instead o¤alling to zero, as occurred at the end of Phase I, the price will adjust downward to some lower positive value and then continue to rise over time depending on the discount rate.
Given the abstract nature of this application of the theory of allowance banking to the particulars of the EU ETS, some quali…cations are in order, which also highlight the need for future research in key areas. The …rst is about the e¤ective time horizon over which agents optimize. The theory as we have applied it assumes that agents are so far-seeing as to be thinking about 2043 for instance. Agents may be easily assumed to be forward-looking, but do their horizons extend thirty years and even more into the future? And, if the reality is truncated horizons that are updated and moved forward as time progresses, what is the relevant time span? More importantly for our purposes, how would such behavior change the equilibrium paths that have been presented in the body of this paper?
Another issue is the e¤ect of agent heterogeneity on outcomes in the permit market, one example being the rate at which di¤erent …rms discount the future. If we assume that each …rm’s discount rate is related to the relevant central bank interest rate, then the question is how this will a¤ect a permit market in a multi-national setting with agents using di¤erent currencies in countries with di¤ering monetary regimes. Our model assumes a single uniformly applicable discount rate for all agents as if all operated within a single state. EUAs are denominated and traded in euros and most of the agents in the EU ETS operate in countries where the currency is the euro and where the discount rates used by agents might be assumed to re‡ect with varying premia the discount rate established by the European Central Bank. However, a sizeable minority of installations operate in countries, such as the UK and Poland, where the euro is not the currency and under monetary regimes with di¤erent discount rates. While agents in these countries may buy and sell EUAs denominated in euros, their accounting is ultimately in their own
currency mediated by an exchange rate and perhaps applying discount rates di¤erent from those of their counterparts in member states using the euro.
In our simulations, a range of discount rates emerging from the relatively short-term pricing of EUA futures is used and this might be viewed as the expression of the market aggregation of these potentially heterogeneous discount rates, but our choice has no ratio-nale other than that it can be directly connected to market pricing of EUAs in di¤erent time periods. As noted, this discount rate bears little relation to the interest rate set by the European Central Bank during Phase II. This discussion shows the need to carefully think about how agents value the present relative to the future and how this may a¤ect the permit market. Heterogeneity regarding other attributes of …rms may also exist, e.g. in terms of risk aversion.
Two other areas of needed research are the e¤ect of the curvature in the schedule of expected marginal abatement costs and the extent to which di¤ering rates of technological improvement in abatement technology alter these results.
7
Conclusion
Allowance banking has been a neglected subject on the research agenda concerning the EU ETS. Our hope is that our analysis will convince researchers interested in the EU ETS, or more generally in carbon markets, that the topic belongs on that agenda. As the preceding comments indicate, there are important open questions. What should not be open, however, is whether allowance banking must be considered in explaining observed phenomena in the EU ETS and in particular the stock of unused allowances that has been accumulated in the course of Phase II and into Phase III. For too long, the facile explanation of some structural or behavioral defect has been o¤ered as an explanation in the public debate when the reality is more complicated and involves economic choices by optimizing agents. One key lesson of this analysis is that it is rational to decrease emissions below the cap at the start of the banking period and to accumulate a “surplus” in order to minimize abatement costs over time. The observed EUA bank at the end of Phase II falls within the range of values indicated by the illustrative simulations presented in this paper suggesting behavior by agents consistent with intertemporal cost minimization in a perfect-foresight model.
This is good news for it reveals a form of voluntary early action triggered by the particular structure of the cap in the EU ETS, namely, one that starts out near or at the level of initial business-as-usual emissions and declines steadily thereafter. This structure can be found in one form or another in other proposed and implemented CO2 emissions trading systems and it seems likely to characterize future greenhouse gas trading systems, given the nature of the problem being addressed and the available technology. The logic
20
of allowance banking would suggest that when banking is allowed and agents are faced with a credible prospect of future scarcity, they will reduce emissions initially more than required in order to capture the gains that come from intertemporal cost minimization.
As discussed previously, the impact of bringing the model closer to reality, e.g. by considering uncertainty, shorter planning horizons or allowing for …rm heterogeneity, on the optimal paths of emissions and price need to be explored. It is our hope that this paper will stimulate further work, both theoretical and empirical, on banking in the context of permit markets featuring a smoothly declining cap.
References
[1] Cronshaw, M. B. and, J. B. Kruse (1996), “Regulated Firms in Pollution Permit Markets with Banking,” Journal of Regulatory Economics, 9, 179-189.
[2] Ellerman, A. D. and J. P. Montero (2007), “The E¢ ciency and Robustness of Al-lowance Banking in the US Acid Rain Program,” The Energy Journal, 47-71.
[3] Ellerman, A. D., F. J. Convery and C. de Perthuis (2010), "Pricing Carbon: The European Union Emissions Trading Scheme,” Cambridge University Press.
[4] Ellerman, A. D., C. Marcantonini and A. Zaklan (2014), “The EU ETS: Eight Years and Counting,”Robert Schuman Centre for Advanced Studies Working Paper 2014-04, European University Institute.
[5] European Commission (2014), “A Policy Framework for Energy and Climate from 2020 to 2030: Communication from the Commission to the European Parliament, the Council, the European Economic and Social Committee, and the Committee of the Regions,” COM(2014) 15 …nal, Brussels, January 22, 2014.
[6] Kling, C. and J. Rubin (1997), “Bankable Permits for the Control of Environmental Pollution,” Journal of Public Economics, 64, 101-115.
[7] Leiby, P. and J. Rubin (2001), “Intertemporal Permit Trading for the Control of Greenhouse Gas Emissions,” Environmental and Resource Economics, 19, 229-256. [8] Paltsev, S., J. Reilly, H. Jacoby, R. Eckaus, J. McFarland, M. Saro…m, M. Asadoorian,
and M. Babiker (2005), “The MIT emissions prediction and policy analysis (EPPA) model: version 4,”MIT Joint Program on the Science and Policy of Global Change, Report 125, Cambridge, MA.
[9] Rubin, J. (1996), “A Model of Intertemporal Emission Trading, Banking, and Bor-rowing,” Journal of Environmental Economics and Management, 31, 269-286. [10] Rubin, J. and C. Kling (1993), “An Emission Saved is an Emission Earned: An
Em-pirical Analysis of Emission Banking for Light-Duty Engine Manufacturers,”Journal of Environmental Economics and Management, 25, 257-274.
[11] Schennach, S.M. (2000), “The Economics of Pollution Permit Banking in the Context of Title IV of the 1990 Clean Air Act Amendments,” Journal of Environmental Economics and Management, 40, 189-210.
[12] Stevens, B. and A. Rose (2002), “A Dynamic Analysis of the Marketable Permits Approach to Global Warming Policy: A Comparison of Spatial and Temporal Flexi-bility,” Journal of Environmental Economics and Management, 44, 45-69.
22
[13] Yates, A. J. and M. B. Cronshaw (2001), “Pollution Permit Markets with Intertem-poral Trading and Asymmetric Information,” Journal of Environmental Economics and Management, 42, 104-118.
Appendix: Analytical Solution
In this appendix we provide an analytical solution for a simple case, to facilitate the analysis and to obtain tractable results. The marginal cost mc is assumed to be a linear function. As Schennach (2000), we rewritte mc as:
mc(ut et) = (eut et)B
where the variable eut= At=B + ut. The paths of emissions and price are such that:
Pt=f (eu0 e0) B ert (eut Yt) B f or t < f or t et =f eut ert(eu 0 e0) Yt f or t < f or t
The equation (7) can be rewritten as:
eu er (eu0 e0) = Y
and the equation (8) as:
eu + (eu0 e0) (1 er ) r = Y0 a (1 e a )
Putting equation (7) into (8), we obtain:
eu (1 e r ) r (eu Y ) = Y0 a (1 e a )
We can then substitute for e0 and in the path of price and emissions.
24