Regular Article
LYMPHOID NEOPLASIACytogenetic complexity in chronic lymphocytic leukemia:
de
finitions, associations, and clinical impact
Panagiotis Baliakas,1Sabine Jeromin,2Michalis Iskas,3Anna Puiggros,4,5Karla Plevova,6,7Florence Nguyen-Khac,8Zadie Davis,9
Gian Matteo Rigolin,10Andrea Visentin,11Aliki Xochelli,12Julio Delgado,13Fanny Baran-Marszak,14Evangelia Stalika,12Pau Abrisqueta,15
Kristina Durechova,7George Papaioannou,3Virginie Eclache,14Maria Dimou,16Theodoros Iliakis,16Rosa Collado,17Michael Doubek,6,7
M. Jose Calasanz,18Neus Ruiz-Xiville,19Carolina Moreno,20Marie Jarosova,6,7Alexander C. Leeksma,21,22Panayiotis Panayiotidis,16
Helena Podgornik,23Florence Cymbalista,14Achilles Anagnostopoulos,3Livio Trentin,11Niki Stavroyianni,3Fred Davi,8Paolo Ghia,24
Arnon P. Kater,21,22Antonio Cuneo,10Sarka Pospisilova,6,7Blanca Espinet,4,5Anastasia Athanasiadou,3David Oscier,9Claudia Haferlach,2
and Kostas Stamatopoulos,1,12on behalf of ERIC, the European Research Initiative on CLL
1Department of Immunology, Genetics and Pathology, Science for Life Laboratory, Uppsala University, Uppsala, Sweden;2MLL Munich Leukemia Laboratory,
Munich, Germany;3Hematology Department and HCT Unit, G. Papanicolaou Hospital, Thessaloniki, Greece;4Laboratori de Citogen `etica Molecular, Servei de
Patologia, Hospital del Mar, Barcelona, Spain;5Grup de Recerca Translacional en Neopl `asies Hematol `ogiques, Programa de Recerca en C `ancer, Institut Hospital
del Mar d’Investigacions M `ediques (IMIM), Barcelona, Spain;6Central European Institute of Technology (CEITEC), Masaryk University, Brno, Czech Republic;
7Department of Internal Medicine, Hematology and Oncology, University Hospital Brno and Faculty of Medicine, Masaryk University, Brno, Czech Republic;
8Hematology Department and Sorbonne University, Hopital Pitie-Salpetriere, INSERM U1138, Paris, France;9Department of Haematology, Royal Bournemouth
Hospital, Bournemouth, United Kingdom;10Hematology Section, St. Anna University Hospital, Ferrara, Italy;11Hematology Division, Department of Medicine,
University of Padua, Padua, Italy;12Institute of Applied Biosciences, Center for Research and Technology Hellas, Thessaloniki, Greece;13Department of
He-matology, Hospital Cl´ınic, Institut d’Investigacions Biom `ediques August Pi i Sunyer, Universitat de Barcelona, Barcelona, Spain;14Laboratoire d’h ´ematologie,
Hopital Avicenne, Assistance Publique–H ˆopitaux de Paris, Paris, France;15Servei d’Hematolog´ıa, Hospital Vall d’Hebron, Barcelona, Spain;16Hematology Section,
First Department of Propedeutic Internal Medicine, National and Kapodistrian University of Athens, Laikon University Hospital, Athens, Greece;17Servicio de
Hematolog´ıa, Consorcio Hospital General Universitario, Valencia, Spain;18Servicio de Gen ´etica Citogen ´etica, Departamento de Gen ´etica, Universidad de Navarra,
Pamplona, Spain;19Servei Laboratori Hematologia, ICO-Hospital Germans Trias i Pujol, Institut de Recerca Contra la Leuc `emia Josep Carreras (IJC), Universitat
Aut `onoma de Barcelona, Badalona, Spain;20Servei d’Hematologia, Hospital Universitari de la Santa Creu i Sant Pau, Barcelona, Spain;21Department of
He-matology and Lymphoma and Myeloma Center Amsterdam, Academic Medical Center Amsterdam, University of Amsterdam, Amsterdam, The Netherlands;
22Department of Experimental Immunology, Cancer Center Amsterdam and Infection and Immunity Institute of Amsterdam, Amsterdam, The Netherlands;
23Department of Hematology, University Medical Centre Ljubljana, Ljubljana, Slovenia; and24Strategic Research Program in CLL, Division of Experimental
Oncology, IRCCS San Raffaele Scientific Institute and Universit `a Vita-Salute San Raffaele, Milan, Italy
K E Y P O I N T S lComplex karyotype defined by the presence of‡3 chromosomal abnormalities should not be axiomatically considered unfavorable in CLL. lHigh cytogenetic complexity with‡5 chromosomal aberrations emerges as prognostically adverse, independently of other biomarkers.
Recent evidence suggests that complex karyotype (CK) defined by the presence of ‡3 chromosomal aberrations (structural and/or numerical) identified by using chromosome-banding analysis (CBA) may be relevant for treatment decision-making in chronic lym-phocytic leukemia (CLL). However, many challenges toward the routine clinical application of CBA remain. In a retrospective study of 5290 patients with available CBA data, we explored both clinicobiological associations and the clinical impact of CK in CLL. We found that patients with‡5 abnormalities, defined as high-CK, exhibit uniformly dismal clinical outcomes, independently of clinical stage, TP53 aberrations (deletion of chromosome 17p and/or TP53 mutations [TP53abs]), and the expression of somatically hypermutated (M-CLL) or unmutated immunoglobulin heavy variable genes. Thus, they contrasted with CK cases with 3 or 4 aberrations (low-CK and intermediate-CK, respectively) who followed aggressive disease courses only in the presence of TP53abs. At the other end of the spectrum, patients with CK and 112,119 displayed an exceptionally indolent profile. Building upon CK, TP53abs, and immunoglobulin heavy variable gene somatic hyper-mutation status, we propose a novel hierarchical model in which patients with high-CK exhibit the worst prognosis, whereas those with mutated CLL lacking CK or TP53abs, as well as CK with 112,119, show the longest overall survival. Thus, CK should not be axiomatically considered un-favorable in CLL, representing a heterogeneous group with variable clinical behavior. High-CK with‡5 chromosomal aberrations emerges as prognostically adverse, independent of other biomarkers. Prospective clinical validation is warranted before ultimately incorporating high-CK in risk stratification of CLL. (Blood. 2019;133(11):1205-1216)
Introduction
Chronic lymphocytic leukemia (CLL) is a malignancy of mature clonal B cells that mainly affects the elderly population and displays exceptional clinical and biological heterogeneity.1-3
Many host- and tumor-related features with prognostic and/or predictive value have been identified over the years, assisting in the stratification of patients into subgroups with distinct clinical course and response to treatment.4-23 Among tumor-related
biomarkers, those recommended by the International Work-shop on Chronic Lymphocytic Leukemia (iwCLL) for prognostic assessment before treatment initiation in both general practice and clinical trials pertain to the genomic background of the malignant clone, more particularly the TP53 gene, and the so-matic hypermutation status (SHM) of the rearranged immuno-globulin heavy variable (IGHV) gene expressed by the clonotypic B-cell receptor immunoglobulin.24
The genomic landscape of CLL is heterogeneous, lacking a specific cytogenetic abnormality.25Historically, thefirst evidence
for the genetic heterogeneity of CLL emerged from chromo-some banding analyses (CBAs) from the early 1990s revealing various numerical and structural abnormalities.26-28These studies
also indicated that the presence of an increased number of cytogenetic abnormalities was associated with more aggressive clinical outcomes, highlighting the prognostic significance of complex karyotype (CK) defined by the presence of at least 3 numerical and/or structural abnormalities.28
However, CBA analysis was never widely incorporated into the routine diagnostic algorithm of CLL, mainly due to technical considerations, particularly concerning the relative difficulty in obtaining sufficient metaphases of the CLL clone; this difficulty translated into a low detection rate of chromosome abnormal-ities, at least until relatively recently.29,30This scenario, combined
with the finding that fluorescence in situ hybridization (FISH) could detect at least 1 of only 4 recurrent aberrations with prog-nostic relevance [namely deletions of chromosome 11q (del(11q)), 13q (del(13q)), and 17p (del(17p)); and trisomy of chromosome 12 (112)] in ;80% of patients,12rendered CBA a less popular
approach for assessing the CLL genetic background. According to the recently updated iwCLL recommendations, thorough genetic risk stratification in CLL requires FISH analysis complemented by mutational screening for the TP53 gene.24
However, arguably, FISH offers only a partial view of the cyto-genetic landscape of CLL, whereas CBA presents the oppor-tunity to globally assess the karyotype of the malignant clone, thus potentially offering valuable complementary information and, eventually, refinement of risk stratification.6,8,26,31-35 From
a practical perspective, it is relevant to mention that, thanks to the introduction of modern cell stimulation protocols, the methodologic limitations of older protocols have been over-come, allowing for robust CBA.29,32,36
Recently, CBA in CLL has attracted great interest given the reports suggesting that in addition to representing an independent prognostic marker,6,13,37-41CK may also constitute a novel
pre-dictive marker for refractoriness to not only chemotherapy-based treatment regimens42-45 but also to novel agents; these novel
agents include B-cell signaling kinase inhibitors and the Bcl-2 inhibitor venetoclax, independently of the presence of TP53
aberrations [TP53abs; deletion of chromosome 17p (del(17p)); and/or TP53 mutation].46-50However, the available evidence derives
from small cohorts of patients in various disease phases and with markedly different treatment exposures. This situation precludes definitive conclusions from being drawn regarding the precise predictive value of CK and the optimal management of CK patients. Responding to these developments, the recently updated iwCLL guidelines state that CBA before treatment initiation is “desir-able” in the context of clinical trials and useful also in general practice, provided that an established methodology is avail-able.24 However, many challenges toward routine clinical
ap-plication of CBA must still be overcome, thereby indicating the need for rigorous definitions as well as systematic investigation in a large series, which is the aim of the present study of the European Research Initiative on CLL (ERIC).
Patients and methods
Patients
The present multicenter retrospective study included 5479 individuals with CLL (n5 5082 [93%]) and high-count (clinical) monoclonal B-cell lymphocytosis51(n5 397 [7%]) from 17
Eu-ropean institutions (Table 1) in whom cytogenetic data from CBA were available; 2198 of 5479 cases have been reported previously.6,34,37,40,41 A total of 189 cases (3%) were excluded
from further analysis due to having fewer metaphases than re-quired for reliable assessment (definitions given in the following section).
CBA was performed within the first year from diagnosis and
before the administration of any treatment in 4402 (85%) of 5179 patients and in 4499 (92%) of 4868 patients, respectively. No significant differences in obtaining an adequate number of metaphases were observed across the various institutions. The study was conducted under all recommended national and in-ternational ethical and legal recommendations after approval by the local ethics review committee of each participating in-stitution. Demographic, clinical, and biological data for the patient cohort are summarized in Table 1.
Cytogenetic analysis Stimulation protocols used for
meta-phase induction were based on either phorbol-12-myristate-13-acetate (TPA) (n5 2631 [50%]) or immunostimulatory cytosine guanine dinucleotide (CpG)-oligonucleotide DSP30 plus interleukin 2 (IL-2) (n5 2659 [50%]) following standard procedures.6,29,37,38,52
No differences regarding the number of obtained metaphases were observed between the 2 protocols. Details regarding the actual protocols are provided in the supplemental Methods, available on the Blood Web site.
Karyotypes were classified according to the 2016 International System for Human Cytogenetic Nomenclature.53For a karyotype
to be deemed normal, a minimum of 15 metaphases had to be examined; 10 metaphases were the minimum in the case of abnormal findings. Single-cell abnormalities were taken into consideration only if verified according to FISH analysis. A karyotype was defined as complex if $3 clonal aberrations (numerical and/or structural; unbalanced and balanced aberra-tions were considered as a single event) were present in
CBA54,55; aberrations detected only according to FISH were not
Table 1. Main clinicobiological features of the patients included in the study Feature Entire cohort (n 5 5290) Non-CK (0-2 abs; n 5 4496) CK ‡ 3 abs (n 5 794) Low-CK/intermediate-CK (3-4 abs; n 5 523) High-CK (‡ 5 abs; n 5 271) P , non-CK vs CK P , low-CK/intermediate-CK vs high-CK Male 3302/5290, 6 2% 2790/4496, 62% 522/794, 66% 351/523, 67% 171/271, 63% .047 .56 Median age (diagnosis) 64.6 y 6 4.3 y 64.7 y 64.2 y 66.1 y .58 .02 MBL 383/4454, 9 % 3 53/3813, 9% 30/641, 5 % 2 7/412, 7% 3/229, 1 % .0001 .004 Binet A 3030/4454, 6 8% 2643/3813, 69% 387/641, 60% 263/412, 64% 124/229, 54% , .0001 .017 Binet B /C 1041/4454, 2 3% 817/3813, 22% 2 24/641, 35% 122/412, 29% 102/229, 45% , .0001 .0002 U-CLL 1 514/3453, 4 4% 1187/2939, 40% 327/514, 64% 201/351, 57% 126/163, 77% , .0001 , .0001 TP53 abs 6 57/4968, 13% 3 37/4204, 8% 320/764, 42% 151/501, 30% 169/263, 64% , .0001 , .0001 del(11q) 487/4500, 1 1% 353/3714, 9% 165/622, 26% 119/413, 29% 46/209, 22% , .0001 .07 Trisomy 12 685/4500, 1 5% 557/3714, 15% 1 50/622, 24% 117/413, 28% 33/209, 16% , .0001 .0005 idel(13q) 1734/4500, 3 8% 1621/3714, 44% 113/622, 18% 86/413, 21% 27/209, 13% , .0001 , .0001 The statistically signi ficant level was de fined as .008 following the Bonferro ni co rrection for multiple testing. abs, aberratio ns; CK, $ 3 abs; low-CK, 3 abs; intermediate-CK, 4 abs; h igh-CK, $ 5 abs; MBL, mono clonal B-cell lympho cytosis; TP53 abs, deletion o f chromosoe 17p and/or TP53 mutation; del(11q), deletion o f chromosom e 11q; idel(13q), isolated deletio n o f chromoso m e 13q.
taken into consideration regarding the definition of CK. In-terphase FISH analysis was performed in 4766 (90%) cases using the probes for the 13q14, 11q22 (ATM), and 17p13 (TP53) regions and trisomy 12 (CEP 12).
Other biomarkers
Immunogenetic analysis Amplification of IGHV–immunoglobulin
heavy diversity–immunoglobulin heavy joining rearrangements was performed in 3453 (65%) patients as previously described.56
Based on the SHM status, namely the germline identity of the clonotypic rearranged IGHV genes, patients were classified as having unmutated CLL (U-CLL) ($98% identity) or mutated CLL (M-CLL) (,98% identity).
Analysis of TP53 gene mutations Mutational screening for
the TP53 gene included exons 4-8 but also exons 9-10 for some centers and was performed in 2861 (54%) of 5290 cases, mainly those negative for del(17p) per FISH analysis (n5 2482). Most cases (70%) were analyzed by using Sanger sequencing. The remaining patients were analyzed with next-generation se-quencing (NGS); only clones with variant allele frequency.10% were considered.57 The detection rate of TP53 mutations was
similar independently of the applied methodologies for cases carrying CK (21% and 26% for cases analyzed with NGS and Sanger sequencing, respectively; P5 .15).
Statistical analysis
Descriptive statistics for discrete parameters included counts and frequency distributions; for quantitative variables, statisti-cal measures included medians, standard deviations, and minimum–maximum values. Overall survival (OS), the end point of the present study, was measured from the date of CBA until last follow-up or death. The impact of CK on time-to-first-treatment among patients with early-stage disease has been reported elsewhere.6Survival curves were constructed with the
Kaplan-Meier method, and the log-rank test was used to de-termine differences between survival proportions. Univariable Cox regression was applied to assess the prognostic significance of CK and other prognostic factors on survival outcome. Mul-tivariable Cox regression models were implemented to test the simultaneous effect of factors on outcomes, taking into account the relative effect of the remaining parameters. For the multi-variable analysis, we considered only cases with available data for all the factors included in the model (n 5 2376) because imputing the values of the biomarkers could introduce sub-stantial bias. However, no major differences were observed between the entire cohort and the proportion of cases included in the multivariable analysis (supplemental Table 1). Survival analysis was performed with a significance level of 5%; for de-scriptive statistics, the statistically significant level was defined as .008 following the Bonferroni correction for multiple testing. All analyses were performed with Statistica Software version 10.0 (StatSoft, Inc.).
Results
CK in CLL: main features and associations
Following the current definition for CK (ie, $3 structural and/or numerical aberrations), CK was detected in 794 (15%) of 5290 cases (supplemental Figure 1), in accordance with previous reports in cohorts analyzed close to diagnosis.6CK was
signif-icantly associated with advanced clinical stage, TP53abs, U-CLL,
del(11q), and112, as well as lower prevalence of isolated del(13q) [idel(13q)] detected according to FISH analysis (P , .008 for all comparisons vs non-CK cases) (Table 1). In-terestingly, CK was detected even among cases with clinical monoclonal B-cell lymphocytosis (30 of 383 [8%]).
CK was detected more often in cases analyzed with the CpG/IL-2 protocol compared with the TPA protocol (508 of 2659 [19%] vs 286 of 2630 [11%]; P, .001) (supplemental Tables 2 and 3). This difference may be attributed, at least in part, to the reported higher effectiveness of the CpG/IL-2 stimulation protocol.29,58In total,
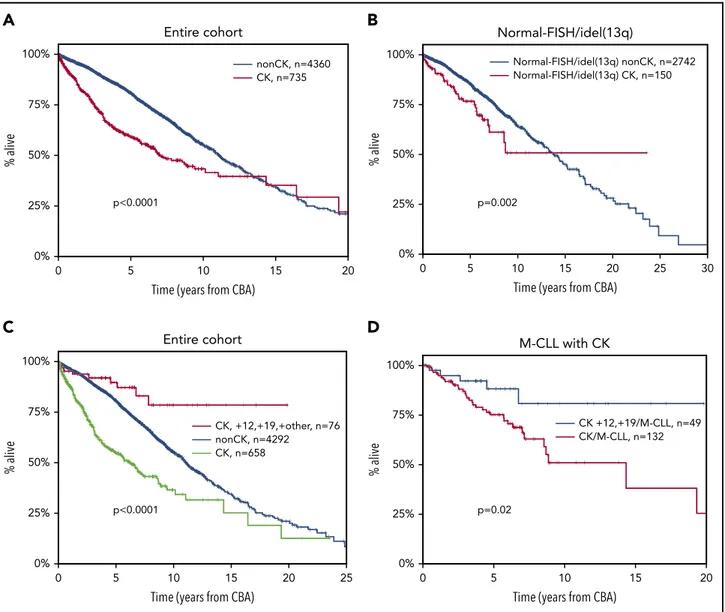
abnormal karyotypes carrying other than idel(13q) were detected in 55% and 43% (P, .001) of the cases analyzed with the CpG/IL-2 and the TPA protocols, respectively (supplemental Figure 2). Cases analyzed with the CpG/IL-2 methodology were enriched for TP53abs (16% vs 10% [P5 .0001] vs the TPA stimulation protocol). Regarding the clinical impact, CK was associated with shorter OS (median OS, 6.9 years; lower quartile–upper quartile [LQ-UQ], 2.5-18.2 years; P , .0001) (Figure 1A). This finding retained independent significance even in the multivariable analysis (hazard ratio [HR], 1.578; 95% confidence interval [CI], 1.267-1.966; P, .001) (supplemental Table 4) along with ad-vanced clinical stage, TP53abs, and U-CLL.
We and others have reported that CK can be present even among cases with idel(13q) or normal FISH [FISH-normal/ idel(13q)], identifying cases with dismal clinical outcome within this otherwise“FISH-favorable” group.6,32,33In the present cohort,
159 (5%) of 2963 cases with FISH-normal/idel(13q) carried CK, with a significantly higher incidence of CK among the idel(13q) subgroup [idel(13q), 113 of 1746 (6.4%); FISH-normal, 46 of 1229 (3.7%); P 5 .001]. These cases exhibited significantly shorter OS compared with the FISH-normal/idel(13q) cases lacking cytogenetic complexity (0-2 aberrations on CBA) (me-dian OS of 7.88 years [LQ-UQ, 3.5-12.74 years] vs a me(me-dian OS of 13.7 years [LQ-UQ, 7.5-20.1 years], respectively; P5 .002) (Figure 1B). Interestingly, the great majority of FISH-normal/ idel(13q) cases with CK were negative for TP53 gene mutations (100 [87%] of 115 cases with available data).
CK is not always adverse: the case of
112,119 CLL
We and others have previously reported that the coexistence
of112 and 119 defines a CLL subgroup with a constellation
of distinctive clinicobiological features, including ubiquitous ex-pression of immunoglobulin G–switched heavy chains, biased expression of lambda light chains, high prevalence of CD38 positivity and monoclonal paraproteinemia, low prevalence of TP53abs, and almost exclusive usage of mutated IGHV genes.8,59,60
Moreover, these cases carry extra trisomies, mostly118, as well as structural abnormalities, hence fulfilling the criteria for CK; however, they exhibit a significantly more indolent course compared with cases with sole112.
In the present cohort, a total of 81 CK cases with112,119 (10% of all CK CLL) were identified who carried either extra trisomies (n5 43) or extra structural abnormalities (n 5 38). No differences were observed between the 2 subgroups regarding either de-mographic/biological features or clinical outcome (supplemental Table 5; supplemental Figure 3). However, it should be men-tioned that the number of patients in each112,119 subgroup was limited, and hence some caution is warranted. Interestingly,
CK cases belonging to the112,119 variant exhibited significantly longer OS (median OS, not reached [NR]) compared with not only the remaining CK CLL (median OS, 6.2 years; LQ-UQ, 2.2-14.4 years; P, .001) but also the non-CK CLL (median OS, 11.1 years; LQ-UQ, 6.1-17.3 years; P, .0001) (Figure 1C). Similar to previous reports,8CK cases with112,119 exhibited longer OS compared
with cases with sole112 detected according to CBA (data not shown). Thus, this profile identifies a subgroup that, despite formally considered as CK, exhibits an extremely indolent course with only 7 deaths in 81 cases and only 57% having received treatment at a median follow-up of 7.2 years. This survival ad-vantage of112,119 CK cases compared with the remaining CK CLL was retained even when the analysis was restricted to M-CLL
(median OS112,119 CK, NR; median OS CK/M-CLL, 9.24 years
[LQ-UQ, 4.9-NR], respectively; P5 .02) (Figure 1D).
Not all CKs are equivalent: high vs low complexity
Published evidence suggests that among cases with CK, those carrying$5 abnormalities may exhibit a worse clinical outcomecompared with those with 3 or 4 aberrations.6,39However, the
relevant series were rather small, hindering definitive con-clusions. To address this issue and also capitalizing on the large cohort size of the present study, CK cases were subdivided into 3 subgroups based on whether they were carrying 3 (n5 355 [45%]), 4 (n5 168 [21%]), or $5 (n 5 271 [34%]) abnormalities. These subgroups were defined as low, intermediate, and high CKs (low-CK, intermediate-CK, and high-CK), respectively. High-CK cases were significantly enriched for TP53abs as well as U-CLL, reaching up to 65% and 76%, respectively (P, .001 com-pared with low-CK and intermediate-CK) (Figure 2A), whereas low-CK and intermediate-CK cases exhibited rather similar
de-mographic and biological profiles (supplemental Table 6).
Prompted by this finding and also considering recent
in-dependent reports61,62alluding to the significance of small TP53
clones detectable only by using NGS, we investigated whether non-TP53 aberrant high-CK cases might also carry minor TP53-mutant subclones using NGS with a sensitivity of 2%. Interestingly, 0 0% p<0.0001 nonCK, n=4360 Entire cohort CK, n=735 25% 50% 75% 100% 5 10
Time (years from CBA)
% alive 15 20 0 0% p<0.0001 CK, +12,+19,+other, n=76 Entire cohort nonCK, n=4292 25% 50% 75% 100% 5 10
Time (years from CBA)
% alive 15 20 25 CK, n=658 0 0% p=0.002 Normal-FISH/idel(13q) nonCK, n=2742 Normal-FISH/idel(13q) Normal-FISH/idel(13q) CK, n=150 25% 50% 75% 100% 5 10
Time (years from CBA)
% alive 15 20 25 30 0 0% p=0.02 CK +12,+19/M-CLL, n=49 M-CLL with CK CK/M-CLL, n=132 25% 50% 75% 100% 5 10
Time (years from CBA)
% alive
15 20
A
B
C
D
Figure 1. Kaplan-Meier curves for OS.(A) Patients with CK ($3 aberrations, red line) vs non-CK cases (0-2 aberrations, blue line) in the entire cohort. The observed
crossover can be explained by the few“events” at the tail of the CK curve, where mostly censored cases are included. (B) Patients with FISH-normal/idel(13q) detected by FISH
who carry CK ($3 aberrations, red line) vs non-CK FISH-normal/idel(13q) cases (blue line). (C) Patients with CK and 112,119 (red line) vs CLL with CK (green line) and the
remaining non-CK CLL (blue line). (D) Patients with CK and112,119 carrying mutated IGHV genes (M-CLL, blue line) vs the remaining M-CLL with CK (red line).
among 25 analyzed cases, none was found positive for low-frequent TP53 mutations.
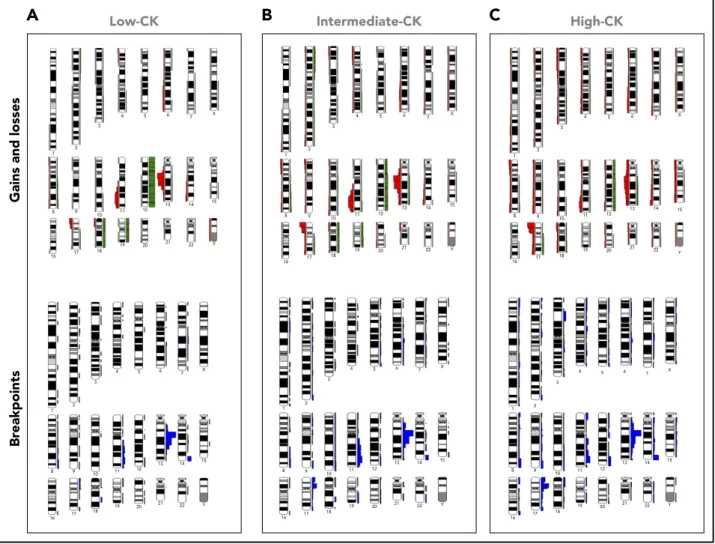
Moreover, cases with low-CK and intermediate-CK exhibited a rather similar distribution of aberrant chromosomal regions, with “CLL-recurrent” aberrations predominating; in contrast, high-CK cases showed a broader spectrum of aberrations affecting al-most all chromosomes (Figure 3), independently of TP53 status (supplemental Figure 4). In line with our previous observation regarding the existence of FISH-normal/idel(13q) cases harboring CK,6,32we also found such cases in all CK subgroups defined here,
accounting for 30%, 28%, and 21% of low-CK, intermediate-CK, and high-CK cases, respectively (Figure 2A).
High-CK exhibited significantly shorter OS (median OS, 3.1 years; LQ-UQ, 1.3-8.3 years; P, .001) compared with either low-CK or
CK cases (median OS for low-CK and intermediate-CK, 12.3 and 7.25 years; LQ-UQ, 5.1-18.1 and 3.75-NR, respec-tively; P5 .04 between low-CK and intermediate-CK) (Figure 2B); these cases resembled the remaining, non-CK CLL (median OS, 11.1 years; LQ-UQ, 6.1-17.3 years) (supplemental Figure 5A). The
same results were obtained when cases with CK and112,119
were excluded from the analysis (supplemental Figure 5B). The dismal impact of high-CK compared with the intermediate-CK and low-intermediate-CK cases was even more striking among cases lacking TP53abs (median OS, 5.1 years; LQ-UQ, 1.8-8.9 years; P , .0001) (Figure 2C). In contrast, no difference was found between low-CK or intermediate-CK vs the remaining, non-CK CLL lacking TP53abs (median OS, 14.8 years, NR, and 11.8 years; LQ-UQ, 6.7-19.1 years, 4.3 years-NR, and 6.7-17.9 years, re-spectively; P5 .27).
Low-CK Intermediate-CK High-CK
0% 25% 50% 75% 100% Cases with CK
U-CLL del(11q) Normal-FISH/idel(13q)
A
0 0% 25% 50% 75% 100% 5 p<0.001 Low-CK, n=333 Intermediate-CK, n=152 High-CK, n=233 10 Entire cohortTime (years from CBA)
% alive 15 20
B
0 0% 25% 50% 75% 100% 5 p<0.0001 nonCK, n=3762 Low-CK, n=238 Intermediate-CK, n=93 10 Without TP53absTime (years from CBA)
% alive 15 20 25 High-CK, n=79
C
0 25% 0% 50% 75% 100% 4 2 p=0.004 TP53abs/non CK, n=320 TP53abs/Low-CK, n=83 TP53abs/Intermediate-CK, n=57 6 With TP53absTime (years from CBA)
% alive
8 10 12
TP53abs/High-CK, n=147
D
TP53abs
Figure 2. Different biological profiles and clinical outcome among patients with CK (‡3 aberrations [abs]) depending on the number of chromosomal abnormalities.(A)
Frequency of U-CLL (unmutated IGHV genes),TP53abs (deletion of chromosome 17p and/or TP53 mutations), del(11q) (deletion of chromosome 11q), and normal-FISH/
idel(13q) (normal FISH or isolated deletion of chromosome 13q according to D ¨ohner hierarchical model). Patients with CK and$5 aberrations (high-CK) are enriched for
U-CLL andTP53abs compared with CK patients with 3 aberrations (low-CK) and those with 4 aberrations (intermediate-CK). Patients with normal-FISH(idel(13q) are detected
within all CK groups. (B-D) Kaplan-Meier curves for OS. (B) All patients with CK in the entire cohort. Low-CK, intermediate-CK, and high-CK cases are represented with the blue,
red, and green lines, respectively. (C) Patients withoutTP53abs. High-CK patients exhibit the shortest OS (purple line), whereas there is no difference between low-CK (red line),
intermediate-CK (green line), and the remaining non-CK CLL (blue line). (D) Patients withTP53abs. The number of aberrations aggravates the clinical outcome, with high-CK
(purple line) exhibiting the shortest OS.
When the analysis was restricted to cases carrying TP53abs, high-CK exhibited the shortest OS compared with intermediate-and low-CK (median OS, 2.5, 3.1, intermediate-and 5 years, respectively; P5 .004) (Figure 2D), suggesting that a complex genetic back-ground aggravates the already dismal clinical outcome of cases with TP53abs. The remaining non-CK cases harboring TP53abs exhibited a median OS of 6.6 years (LQ-UQ, 3.2 years-NR). Turning to immunogenetic categories, within U-CLL, high-CK cases exhibited the shortest OS (median OS, 2.33 years; LQ-UQ, 1.2-7.9 years; P, .001) compared with either low-CK or intermediate-CK cases (median OS, 10.1 and 4.4 years; LQ-UQ, 5 years-NR and 2.7 years-NR, respectively [P5 .003] between low-CK and intermediate-CK) (supplemental Figure 6A). In M-CLL, high-CK was associated with the worst clinical outcome (median OS, 6.1 years; LQ-UQ, 3.2-8.4 years; P, .001), whereas low-CK and intermediate-CK exhibited similar OS (supplemental Figure 6B).
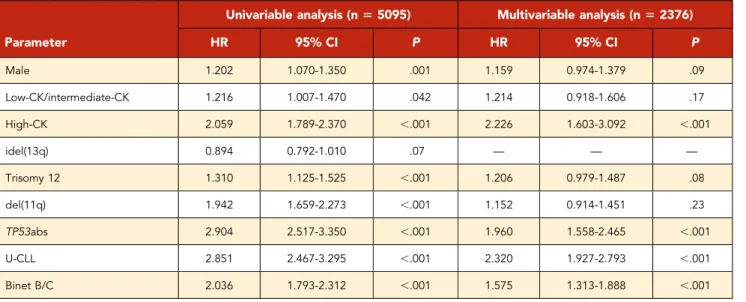
Based on thesefindings, we considered high-CK cases as an in-dependent subgroup, distinct from either low-CK or intermediate-CK cases that we merged into 1 subgroup. Interestingly, when evaluated as a single parameter, low-CK/intermediate-CK were
borderline significant in the univariable analysis for OS (HR, 1.216; 95% CI, 1.007-1.470; P5 .042), whereas they failed to reach significance in the multivariate analysis (HR, 1.214; 95% CI, 0.918-1.606; P5 .17). In contrast, high-CK emerged as an independent adverse prognosticator on multivariable analysis (HR, 2.320; 95% CI, 1.603-3.092; P, .001), along with advanced clinical stage, TP53, and SHM status (Table 2).
CK, TP53 aberrations and B-cell receptor
immunoglobulin SHM: an integrated model
Integrating CK, TP53abs, and IGHV gene SHM, we developed a hierarchical model leading to the identification of 5 groups ranked from the shortest to the longest OS, as follows: (1) high-CK (median OS, 3.1 years; LQ-UQ, 1.3-8.3 years); (2) low-high-CK and intermediate-CK with TP53abs (median OS, 4.3 years; LQ-UQ, 2.3 years-NR); (3) non- CK/TP53abs (median OS, 6.6 years; LQ-UQ, 3.2 years-NR); (4) non-CK/non-TP53abs/U-CLL (median OS, 8.4 years; LQ-UQ, 5.1 years-NR); and (5) non-CK/non-TP53abs/M-CLL and CK with112,119 (median OS, 14.7 years; LQ-UQ,
9.4-21.5 years) (P, .05 for all pair comparisons) (Figure 4). In this proposed hierarchical model, all cases with high-CK were con-sidered as 1 group independently of the presence of TP53abs.
1 2 3 4 5 6 7 X 8 9 10 11 12 13 14 22 21 20 19 18 17 16 15 Y 1 2 3 4 5 6 7 X 8 9 10 11 12 13 14 22 21 20 19 18 17 16 15 Y 1 2 3 4 5 6 7 X 8 9 10 11 12 13 14 22 21 20 19 18 17 16 15 Y 1 2 3 4 5 6 7 X 8 9 10 11 12 13 14 22 21 20 19 18 17 16 15 Y 1 2 3 4 5 6 7 X 8 9 10 11 12 13 14 22 21 20 19 18 17 16 15 Y 1 2 3 4 5 6 7 X 8 9 10 11 12 13 14 22 21 20 19 18 17 16 15 Y
Low-CK Intermediate-CK High-CK
A
B
C
Br
eakpoints
Gains and losses
Figure 3. Distribution of chromosome gains and losses as well as chromosomal breakpoints in the CKs of the present series within 3 aberrations (low-CK),
4 aberrations (intermediate-CK), and‡5 aberrations (high-CK).(A) 3 aberrations (low-CK); (B) 4 aberrations (intermediate-CK); (C)$5 aberrations (high-CK). Gains, right
green bars; losses, left red bars; translocation breakpoints, right blue bars adjacent to chromosomes. Ideograms were prepared with the CYDAS software package, freely available at www.cydas.org.
This decision was based on the fact that when cases with CK and coexisting TP53abs were placed in the model as a separate subgroup, no significant difference was observed compared with high-CK cases without TP53abs (P5 .06).
Discussion
In the largest study thus far conducted, we conclude that CK
defined according to the presence of $3 numerical and/or
structural abnormalities should not be axiomatically considered unfavorable in CLL, representing a heterogeneous group with variable clinical behavior ranging from remarkably indolent to extremely aggressive. High-CK, defined as the presence of at least 5 abnormalities, was associated with dismal clinical out-come, independently of the SHM and TP53 status. In contrast,
low-CK and intermediate-CK defined according to the presence of 3 or 4 aberrations, respectively, seem to be clinically relevant only in the presence of TP53abs.
This differential impact on clinical outcome between high-CK vs low-CK/intermediate-CK subgroups could be partially attributed to the enrichment of U-CLL and TP53abs within the former, reaching up to 76% and 65%, respectively. Interestingly, among 25 cases analyzed by using NGS, none was found positive for low-frequent TP53 mutations, indicating that TP53abs do not constitute a sole explanation for high-CK. Moreover, when con-sidering the distribution of aberrations along different chromo-somes, high-CK cases displayed a distinct profile from the low-CK/ intermediate-CK ones. In particular, the spectrum of affected chromosome regions was significantly broader, indicating that Table 2. Univariable and multivariable analysis for OS
Parameter
Univariable analysis (n5 5095) Multivariable analysis (n5 2376)
HR 95% CI P HR 95% CI P Male 1.202 1.070-1.350 .001 1.159 0.974-1.379 .09 Low-CK/intermediate-CK 1.216 1.007-1.470 .042 1.214 0.918-1.606 .17 High-CK 2.059 1.789-2.370 ,.001 2.226 1.603-3.092 ,.001 idel(13q) 0.894 0.792-1.010 .07 — — — Trisomy 12 1.310 1.125-1.525 ,.001 1.206 0.979-1.487 .08 del(11q) 1.942 1.659-2.273 ,.001 1.152 0.914-1.451 .23 TP53abs 2.904 2.517-3.350 ,.001 1.960 1.558-2.465 ,.001 U-CLL 2.851 2.467-3.295 ,.001 2.320 1.927-2.793 ,.001 Binet B/C 2.036 1.793-2.312 ,.001 1.575 1.313-1.888 ,.001
High-CK ($5 aberrations) is an independent predictor for shorter OS contrasting low-CK/intermediate-CK (3 and 4 aberrations, respectively), which failed to retain significance in the multivariable analysis. Abbreviations are explained in Table 1.
0 0% 25% 50% 75% 100% % alive 5
p<0.05 for all pair-comparisons
<0.001 <0.001 <0.001 <0.001 <0.001 <0.001 <0.001 <0.001 <0.001 <0.001 0.012 <0.001 <0.001 <0.001 0.012 0.024 <0.001 <0.001 <0.001 0.024 nonCK/non TP53abs/M-CLL-CK,+12,+19, n=1706 nonCK/nonTP53abs/U-CLL, n=1140 nonCK/TP53abs, n=320 High-CK, n=233 Low-CK/intermediate-CK/TP53abs, n=140 10 15
Time (years from CBA)
20 25
Figure 4. Kaplan-Meier curves based on a hierarchical model for OS incorporating CK, TP53abs (deletion of chromosome 17p and/or TP53 mutations), and the expression of somatically hypermutated (M-CLL) or unmutated (U-CLL) immunoglobulin heavy
vari-able genes (IGHV).High-CK ($5 aberrations, red line)
exhibits the shortest OS followed by cases withTP53abs
and 3 or 4 aberrations (low-CK and intermediate-CK, respectively; low-CK/intermediate-CK/TP53abs, green
line), non-CK cases withTP53abs (non-CK/TP53abs,
pur-ple line), and non-CK/non-TP53abs cases with unmutated IGHV genes (non-CK/non-TP53abs/U-CLL, black line). Patients with the longest OS are those with non-CK/ TP53abs and mutated IGHV genes (M-CLL), as well as
patients with CK and112,119 (non-CK/non-TP53abs/
M-CLL–CK,112,119, blue line). P values for all pair
com-parisons are provided with an inset table in which the colored cells indicate the respective subgroups based on the color of each Kaplan-Meier curve.
high-CK is reflecting increased genomic instability (Figure 3). Contrasting myeloid neoplasms with high karyotypic complexity that are characterized by a distinctive pattern of abnormalities (deletions of chromosomes 5q, 7q, and 17p),63high-CK CLL
exhibits accumulation of diverse chromosomal abnormalities in addition to the“CLL-typical” ones (deletion of 13q, 11q, 17p, and trisomy 12). On these grounds, the possibility that high-CK may in fact represent merely a surrogate for genomic instability in CLL cannot be excluded; however, this possibility should be tested experimentally before any conclusions can be drawn.
Conceivably, cases with 3 or 4 abnormalities (ie, the low-CK and intermediate-CK subgroups, respectively) might be prone to clonal evolution, acquire additional genomic aberrations, and upgrade to high-CK. Clonal evolution in CLL has been associ-ated with U-CLL and TP53abs and, when present, is linked to resistance to treatment and shorter OS.64-66In the current cohort,
the great majority of the analyzed samples were obtained upon or near diagnosis, meaning that high-CK can also be an early event. However, to address the issue of clonal evolution, large cohorts with longitudinal samples are needed, which is beyond the scope of the present study.
Further highlighting that not all CK are equivalent, CK cases harboring112,119 were found to display an extremely indolent course even when the analysis was restricted to M-CLL. This outcome further supports previous reports that112,119 CLL represents a unique subgroup with a distinctive biological background and clinical behavior.8Currently, the ontogenetic
trajectory and mechanisms leading to the emergence of such clones remain unknown.
The relative significance of CK, particularly in relation to TP53 status, in patients with CLL treated with novel agents remains to be determined conclusively, given that the available evidence is derived from retrospective studies in small series with rather discrepant results. These discrepancies can be partially explained by the differences between cohorts46,47,49,50,67;
how-ever, it should also be noted that in all published studies, CK has been considered as a homogeneous group with no further differentiation according to the number of abnormalities, which, as we show herein, is crucial independent of the TP53 status. Regarding the optimal methodology for detecting CK in CLL, our results mirror previous reports by us and others that CpG/IL-2 is superior to TPA stimulation because it was capable of iden-tifying more cases with CK.29Interestingly, in subgroup analysis,
the distinction among low-CK/intermediate-CK and high-CK was clearly demarcated among cases analyzed with the CpG/ IL-2 protocol (supplemental Figure 7A), whereas intermediate-CK and high-intermediate-CK cases detected by using TPA methodologies found similar OS (supplemental Figure 7B). This scenario sug-gests that the TPA protocol may have failed to reveal the full spectrum of chromosomal aberrations within the CLL clone, thus leading to potential underestimation of CK. In our experience, this outcome is not mainly due to an insufficient number of obtained metaphases but rather to the difference in the quality of the obtained clonal metaphases, which is higher with the CpG/IL-2 protocol, thus facilitating the detection of the re-spective chromosomal aberrations. However, the large number of CK cases identified in the present cohort allowed robust subgroup analysis, hence reaching solid conclusions.
The retrospective nature of our study hinders robust correlations between CK and the response to particular treatment regimens. However, the great majority of the analyzed patients were treated with chemotherapy-based regimens upon treatment indication. Moreover, our study included“general practice” patients mostly recruited before 2015, and therefore only a small minority were treated with novel agents. Therefore, whether different CK sub-groups may be associated with differential responses to such agents remains to be elucidated in future studies, ideally con-cerning prospective cohorts. It should be further highlighted that CBA represents the traditional and well-established methodology to define cytogenetic complexity not only in CLL but in almost all hematologic malignancies. Nonetheless, novel molecular tech-niques such as microarrays may be useful for the characterization of the clonal genomic background.68-72However, the lack of
har-monization, as well as the paucity of solid evidence regarding the clinical impact of cytogenetic complexity detected by microarrays in CLL, raises concerns about the unconditional use of microarrays in the everyday clinical setting. Lately, whole-genome sequencing has been reported as an alternative option for providing global genomic information.73-75 Whole-genome sequencing is for the
time being, however, mostly used in the researchfield with further validation being needed before even suggesting integration of such an approach into the clinical routine.
In summary, we report that CK defined according to the presence of$3 numerical and/or structural abnormalities detected by using CBA should not be axiomatically considered unfavorable in CLL because it represents a heterogeneous group with variable clin-ical behavior. High-CK defined according to the presence of $5 chromosomal aberrations emerges as prognostically adverse, in-dependently of clinical stage, SHM, and TP53 status, whereas low-CK and intermediate-low-CK are clinically relevant only if coexisting with TP53abs. Remarkably, cases carrying a CK with112,119 represent a unique subgroup with excellent prognosis. CK along with SHM and TP53 status enabled construction of a hierarchical model capable of identifying subgroups of patients with markedly distinct clinical outcomes. However, prospective clinical validation is clearly warranted before ultimately incorporating high-CK into risk stratification in CLL in everyday practice.
Acknowledgments
The authors thank the members of the Spanish Cooperative Group for Hematological Cytogenetics and the Spanish CLL Group for providing clinical and biological data.
This research was supported in part by Greek Precision Medicine Net-work in Oncology; H2020“AEGLE, An analytics framework for integrated and personalized healthcare services in Europe” by the European Union; “ODYSSEAS,” implemented under the “Action for the Strategic De-velopment on the Research and Technological Sector,” funded by the Operational Programme“Competitiveness, Entrepreneurship and In-novation” (NSRF 2014-2020) and cofinanced by Greece and the Euro-pean Union (EuroEuro-pean Regional Development Fund); the Swedish Research Council, the Lion’s Cancer Research Foundation, Uppsala; the Slovenian Research Agency; Associazione Italiana per la Ricerca sul Cancro AIRC (Investigator Grant #20246 to P.G. and 5 per mille Research Program #21198), Milano, Italy, Ricerca; ERA-NET TRANSCAN-2 JTC 2016, GCH-CLL; MIUR-PRIN 2015ZMRFEA, Rome, Italy; support by the Fondo di Ateneo per la Ricerca 2013, 2014, 2016, 2018 of the University of Ferrara (G.M.R., A.C.), Ricerca Finalizzata Ministero della Sanit `a (A.C., project RF-2011-02349712), Ministero dell’Istruzione, dell’Universit `a e della Ricerca PRIN 2015 (A.C., project 2015ZMRFEA), BEAT Leukemia Foundation Milan Italy, and AIL Ferrara, Italy; and AZV 15-30015A and 15-31834A by the Ministry of Health, Czech Republic.
Authorship
Contribution: P.B. designed the study, performed research, and wrote the paper; S.J., M.I., A.P., K.P., F.N.-K., Z.D., G.M.R., A.V., A.X., J.D., F.B.-M., E.S., P.A., K.D., G.P., V.E., M.D., T.I., R.C., M.D., M.J.C., N.R.-X., C.M., M.J., A.C.L., P.P., H.P., F.C., A.A., L.T., N.S., F.D., P.G., A.P.K., A.C., S.P., B.E., A.A., D.O., and C.H. provided data and performed research; and K.S. designed the study and wrote the paper, which was approved by all the authors.
Conflict-of-interest disclosure: K.S. received research support from Janssen Pharmaceuticals, Gilead Sciences, and Novartis SA. P.G. re-ceived research support from AbbVie, Janssen Pharmaceuticals, Gilead Sciences, and Novartis and honoraria from AbbVie, Acerta, BeiGene, Janssen, Gilead, and Sunesis. S.J. is employed by MLL Munich Leukemia Laboratory. H.P. received personal fees from Novartis Pharmaceuticals Corporation, Janssen, Takeda GmbH, and Celgene International un-related to the present study. L.T. received research support from Janssen and Gilead. The remaining authors declare no competing financial interests.
A complete list of the members of the European Research Initiative on CLL (ERIC) can be found on the ERIC Web site at www.ericll.org/ our-members.
ORCID profiles: H.P., 0000-0003-3752-2067; A.P.K., 0000-0003-3190-1891.
Correspondence: Kostas Stamatopoulos, Institute of Applied Bio-sciences, Center for Research and Technology Hellas, 57001 Thermi, Thessaloniki, Greece; e-mail: [email protected].
Footnotes
Submitted 2 September 2018; accepted 18 December 2018. Prepub-lished online as Blood First Edition paper, 2 January 2019; DOI 10.1182/ blood-2018-09-873083.
Contact [email protected] or [email protected] for original data.
The online version of this article contains a data supplement. There is a Blood Commentary on this article in this issue.
The publication costs of this article were defrayed in part by page charge payment. Therefore, and solely to indicate this fact, this article is hereby marked“advertisement” in accordance with 18 USC section 1734.
R E F E R E N C E S
1. Fabbri G, Dalla-Favera R. The molecular pathogenesis of chronic lymphocytic leukae-mia. Nat Rev Cancer. 2016;16(3):145-162. 2. Hallek M, Pflug N. Chronic lymphocytic
leukemia. Ann Oncol. 2010;21(suppl 7): vii154-vii164.
3. Chiorazzi N, Rai KR, Ferrarini M. Chronic lymphocytic leukemia. N Engl J Med. 2005; 352(8):804-815.
4. Baliakas P, Hadzidimitriou A, Sutton LA, et al. Clinical effect of stereotyped B-cell receptor immunoglobulins in chronic lymphocytic leu-kaemia: a retrospective multicentre study. Lancet Haematol. 2014;1(2):e74-e84. 5. Baliakas P, Hadzidimitriou A, Agathangelidis
A, et al. Prognostic relevance of MYD88 mutations in CLL: the jury is still out. Blood. 2015;126(8):1043-1044.
6. Baliakas P, Iskas M, Gardiner A, et al. Chromosomal translocations and karyotype complexity in chronic lymphocytic leukemia: a systematic reappraisal of classic cytogenetic data. Am J Hematol. 2014;89(3):249-255. 7. Baliakas P, Mattsson M, Stamatopoulos K,
Rosenquist R. Prognostic indices in chronic lymphocytic leukaemia: where do we stand how do we proceed? J Intern Med. 2016; 279(4):347-357.
8. Baliakas P, Puiggros A, Xochelli A, et al. Additional trisomies amongst patients with chronic lymphocytic leukemia carrying trisomy 12: the accompanying chromosome makes a difference. Haematologica. 2016;101(7): e299-e302.
9. Catovsky D, Wade R, Else M. The clinical
significance of patients’ sex in chronic
lym-phocytic leukemia. Haematologica. 2014; 99(6):1088-1094.
10. Cortese D, Sutton LA, Cahill N, et al. On the
way towards a‘CLL prognostic index’: focus on
TP53, BIRC3, SF3B1, NOTCH1 and MYD88 in a population-based cohort. Leukemia. 2014; 28(3):710-713.
11. Del Giudice I, Rossi D, Chiaretti S, et al.
NOTCH1 mutations in112 chronic lymphocytic
leukemia (CLL) confer an unfavorable prognosis,
induce a distinctive transcriptional profiling and
refine the intermediate prognosis of 112 CLL.
Haematologica. 2012;97(3):437-441. 12. D ¨ohner H, Stilgenbauer S, Benner A, et al.
Genomic aberrations and survival in chronic lymphocytic leukemia. N Engl J Med. 2000; 343(26):1910-1916.
13. Eichhorst B, Hallek M. Prognostication of chronic lymphocytic leukemia in the era of new agents. Hematology Am Soc Hematol Educ Program. 2016;2016:149-155. 14. Hamblin TJ, Davis Z, Gardiner A, Oscier DG,
Stevenson FK. Unmutated Ig V(H) genes are associated with a more aggressive form of chronic lymphocytic leukemia. Blood. 1999; 94(6):1848-1854.
15. Mansouri L, Cahill N, Gunnarsson R, et al. NOTCH1 and SF3B1 mutations can be added
to the hierarchical prognostic classification in
chronic lymphocytic leukemia. Leukemia. 2013;27(2):512-514.
16. Parikh SA, Strati P, Tsang M, West CP, Shanafelt TD. Should IGHV status and FISH testing be performed in all CLL patients at diagnosis? A systematic review and meta-analysis. Blood. 2016;127(14):1752-1760. 17. Rai KR, Jain P. Chronic lymphocytic leukemia
(CLL)—then and now. Am J Hematol. 2016;
91(3):330-340.
18. Rossi D, Gerber B, St ¨ussi G. Predictive and prognostic biomarkers in the era of new targeted therapies for chronic lymphocytic leu-kemia. Leuk Lymphoma. 2017;58(7):1548-1560.
19. Wierda WG, O’Brien S, Wang X, et al.
Prognostic nomogram and index for overall survival in previously untreated patients with chronic lymphocytic leukemia. Blood. 2007; 109(11):4679-4685.
20. Damle RN, Wasil T, Fais F, et al. Ig V gene mutation status and CD38 expression as novel prognostic indicators in chronic lymphocytic leukemia. Blood. 1999;94(6):1840-1847.
21. International CLL-IPI working group. An in-ternational prognostic index for patients with chronic lymphocytic leukaemia (CLL-IPI): a meta-analysis of individual patient data. Lancet Oncol. 2016;17(6):779-790. 22. Baliakas P, Mattsson M, Hadzidimitriou A,
et al. No improvement in long-term survival over time for chronic lymphocytic leukemia patients in stereotyped subsets #1 and #2 treated with chemo(immuno)therapy. Haematologica. 2018;103(4):e158-e161. 23. Baliakas P, Moysiadis T, Hadzidimitriou A,
et al. Tailored approaches grounded on
im-munogenetic features for refined
prognosti-cation in chronic lymphocytic leukemia [published online ahead of print 27 Septem-ber 2018]. Haematologica. doi: 10.3324/ haematol.2018.195032.
24. Hallek M, Cheson BD, Catovsky D, et al. iwCLL guidelines for diagnosis, indications for treatment, response assessment, and sup-portive management of CLL. Blood. 2018; 131(25):2745-2760.
25. Puiggros A, Blanco G, Espinet B. Genetic abnormalities in chronic lymphocytic leuke-mia: where we are and where we go. BioMed Res Int. 2014;2014:435983.
26. Dierlamm J, Michaux L, Criel A, Wlodarska I, Van den Berghe H, Hossfeld DK. Genetic abnormalities in chronic lymphocytic leukemia and their clinical and prognostic implications. Cancer Genet Cytogenet. 1997;94(1):27-35. 27. Juliusson G, Gahrton G. Chromosome
aberrations in B-cell chronic lymphocytic leu-kemia. Pathogenetic and clinical implications. Cancer Genet Cytogenet. 1990;45(2):143-160. 28. Juliusson G, Oscier DG, Fitchett M, et al.
Prognostic subgroups in B-cell chronic
lym-phocytic leukemia defined by specific
chro-mosomal abnormalities. N Engl J Med. 1990; 323(11):720-724.
29. Haferlach C, Bacher U. Cytogenetic methods in chronic lymphocytic leukemia. Methods Mol Biol. 2011;730:119-130.
30. Gahrton G, Rob `ert KH, Friberg K, Zech L, Bird AG. Nonrandom chromosomal aberrations in chronic lymphocytic leukemia revealed by polyclonal B-cell-mitogen stimulation. Blood. 1980;56(4):640-647.
31. Dubuc AM, Davids MS, Pulluqi M, et al. FISHing in the dark: how the combination of FISH and conventional karyotyping improves the diagnostic yield in CpG-stimulated chronic lymphocytic leukemia. Am J Hematol. 2016; 91(10):978-983.
32. Haferlach C, Dicker F, Schnittger S, Kern W, Haferlach T. Comprehensive genetic charac-terization of CLL: a study on 506 cases ana-lysed with chromosome banding analysis, interphase FISH, IgV(H) status and immuno-phenotyping. Leukemia. 2007;21(12): 2442-2451.
33. Haferlach C, Dicker F, Weiss T, et al. Toward a comprehensive prognostic scoring system in chronic lymphocytic leukemia based on a combination of genetic parameters. Genes Chromosomes Cancer. 2010;49(9):851-859. 34. Puiggros A, Collado R, Calasanz MJ, et al.
Patients with chronic lymphocytic leukemia and complex karyotype show an adverse outcome even in absence of TP53/ATM FISH deletions. Oncotarget. 2017;8(33): 54297-54303.
35. Rigolin GM, Cibien F, Martinelli S, et al. Chromosome aberrations detected by con-ventional karyotyping using novel mitogens in
chronic lymphocytic leukemia with“normal”
FISH: correlations with clinicobiologic parameters. Blood. 2012;119(10):2310-2313. 36. Nguyen-Khac F, Borie C, Callet-Bauchu E,
Eclache V, Struski S. Cytogenetics in the management of chronic lymphocytic leuke-mia: an update by the Groupe francophone de cytog ´en ´etique h ´ematologique (GFCH). Ann Biol Clin (Paris). 2016;74(5):561-567. 37. Blanco G, Puiggros A, Baliakas P, et al.
Karyotypic complexity rather than chromo-some 8 abnormalities aggravates the outcome of chronic lymphocytic leukemia patients with TP53 aberrations. Oncotarget. 2016;7(49): 80916-80924.
38. Dicker F, Schnittger S, Haferlach T, Kern W, Schoch C. Immunostimulatory
oligonucleotide-induced metaphase cytoge-netics detect chromosomal aberrations in 80% of CLL patients: a study of 132 CLL cases with correlation to FISH, IgVH status, and CD38 expression. Blood. 2006;108(9):3152-3160. 39. Jaglowski SM, Ruppert AS, Heerema NA, et al.
Complex karyotype predicts for inferior out-comes following reduced-intensity condi-tioning allogeneic transplant for chronic lymphocytic leukaemia. Br J Haematol. 2012; 159(1):82-87.
40. Rigolin GM, Cavallari M, Quaglia FM, et al. In CLL, comorbidities and the complex karyo-type are associated with an inferior outcome independently of CLL-IPI. Blood. 2017; 129(26):3495-3498.
41. Rigolin GM, Saccenti E, Guardalben E, et al. In chronic lymphocytic leukaemia with complex karyotype, major structural abnormalities identify a subset of patients with inferior outcome and distinct biological character-istics. Br J Haematol. 2018;181(2):229-233.
42. Badoux XC, Keating MJ, Wang X, et al. Fludarabine, cyclophosphamide, and ritux-imab chemoimmunotherapy is highly effective treatment for relapsed patients with CLL. Blood. 2011;117(11):3016-3024.
43. Herling CD, Klaum ¨unzer M, Rocha CK, et al. Complex karyotypes and KRAS and POT1 mutations impact outcome in CLL after chlorambucil-based chemotherapy or chemoimmunotherapy. Blood. 2016;128(3): 395-404.
44. Takahashi K, Hu B, Wang F, et al. Clinical implications of cancer gene mutations in patients with chronic lymphocytic leukemia treated with lenalidomide. Blood. 2018; 131(16):1820-1832.
45. Le Bris Y, Struski S, Gui `eze R, et al. Major prognostic value of complex karyotype in addition to TP53 and IGHV mutational status
infirst-line chronic lymphocytic leukemia.
Hematol Oncol. 2017;35(4):664-670. 46. Mato AR, Hill BT, Lamanna N, et al. Optimal
sequencing of ibrutinib, idelalisib, and venetoclax in chronic lymphocytic leukemia: results from a multicenter study of 683 patients. Ann Oncol. 2017;28(5):1050-1056. 47. Mato AR, Thompson M, Allan JN, et al.
Real-world outcomes and management strategies for venetoclax-treated chronic lymphocytic leukemia patients in the United States. Haematologica. 2018;103(9):1511-1517. 48. Roberts AW, Davids MS, Pagel JM, et al.
Targeting BCL2 with venetoclax in relapsed chronic lymphocytic leukemia. N Engl J Med. 2016;374(4):311-322.
49. Thompson PA, O’Brien SM, Wierda WG, et al.
Complex karyotype is a stronger predictor than del(17p) for an inferior outcome in re-lapsed or refractory chronic lymphocytic leu-kemia patients treated with ibrutinib-based regimens. Cancer. 2015;121(20):3612-3621. 50. Anderson MA, Tam C, Lew TE, et al.
Clinicopathological features and outcomes of progression of CLL on the BCL2 inhibitor venetoclax. Blood. 2017;129(25):3362-3370. 51. Swerdlow SH, Campo E, Pileri SA, et al. The
2016 revision of the World Health
Organiza-tion classification of lymphoid neoplasms.
Blood. 2016;127(20):2375-2390.
52. Muthusamy N, Breidenbach H, Andritsos L, et al. Enhanced detection of chromosomal abnormalities in chronic lymphocytic leuke-mia by conventional cytogenetics using CpG oligonucleotide in combination with poke-weed mitogen and phorbol myristate acetate. Cancer Genet. 2011;204(2):77-83.
53. International Standing Committee on Human Cytogenetic Nomenclature. ISCN: An In-ternational System for Human Cytogenomic Nomenclature. Basel, NY: Karger; 2016.
54. Peterson JF. The complexities of defining
a complex karyotype in hematological ma-lignancies: a need for standardization? Acta Haematol. 2017;138(1):65-66.
55. Slovak ML, Kopecky KJ, Cassileth PA, et al. Karyotypic analysis predicts outcome of pre-remission and postpre-remission therapy in adult acute myeloid leukemia: a Southwest Oncol-ogy Group/Eastern Cooperative OncolOncol-ogy Group Study. Blood. 2000;96(13):4075-4083.
56. Agathangelidis A, Darzentas N,
Hadzidimitriou A, et al. Stereotyped B-cell receptors in one-third of chronic lymphocytic
leukemia: a molecular classification with
implications for targeted therapies. Blood. 2012;119(19):4467-4475.
57. Malcikova J, Tausch E, Rossi D, et al; European Research Initiative on Chronic Lymphocytic
Leukemia (ERIC)–TP53 network. ERIC
recom-mendations for TP53 mutation analysis in
chronic lymphocytic leukemia—update on
methodological approaches and results interpretation. Leukemia. 2018;32(5): 1070-1080.
58. Put N, Konings P, Rack K, et al; Belgian Cy-togenetic Group for Hemato-Oncology (BCGHO). Improved detection of chromo-somal abnormalities in chronic lymphocytic leukemia by conventional cytogenetics using CpG oligonucleotide and interleukin-2 stimulation: a Belgian multicentric study. Genes Chromosomes Cancer. 2009;48(10): 843-853.
59. Ibbotson R, Athanasiadou A, Sutton LA, et al. Coexistence of trisomies of chromosomes 12 and 19 in chronic lymphocytic leukemia occurs exclusively in the rare IgG-positive variant. Leukemia. 2012;26(1):170-172.
60. Sellmann L, Gesk S, Walter C, et al. Trisomy 19 is associated with trisomy 12 and mutated IGHV genes in B-chronic lymphocytic leu-kaemia. Br J Haematol. 2007;138(2):217-220. 61. Rossi D, Khiabanian H, Spina V, et al. Clinical impact of small TP53 mutated subclones in chronic lymphocytic leukemia. Blood. 2014; 123(14):2139-2147.
62. Nadeu F, Delgado J, Royo C, et al. Clinical impact of clonal and subclonal TP53, SF3B1, BIRC3, NOTCH1, and ATM mutations in chronic lymphocytic leukemia. Blood. 2016; 127(17):2122-2130.
63. Arber DA, Orazi A, Hasserjian R, et al. The 2016 revision to the World Health
Organiza-tion classification of myeloid neoplasms
and acute leukemia. Blood. 2016;127(20): 2391-2405.
64. Huang SJ, Bergin K, Smith AC, et al. Clonal
evolution as detected by interphase
fluores-cence in situ hybridization is associated with worse overall survival in a population-based analysis of patients with chronic lymphocytic leukemia in British Columbia, Canada. Cancer Genet. 2017;210:1-8.
65. Stilgenbauer S, Sander S, Bullinger L, et al. Clonal evolution in chronic lymphocytic leu-kemia: acquisition of high-risk genomic aberrations associated with unmutated VH, resistance to therapy, and short survival. Haematologica. 2007;92(9):1242-1245. 66. Wawrzyniak E, Kotkowska A, Blonski JZ, et al.
Clonal evolution in CLL patients as detected by FISH versus chromosome banding analysis,
and its clinical significance. Eur J Haematol.
2014;92(2):91-101.
67. Lazarian G, Tausch E, Eclache V, et al. TP53 mutations are early events in chronic lymphocytic leukemia disease progression and precede evolution to complex kar-yotypes. Int J Cancer. 2016;139(8):1759-1763. 68. Gunnarsson R, Isaksson A, Mansouri M, et al. Large but not small copy-number alterations
correlate to high-risk genomic aberrations and survival in chronic lymphocytic leukemia: a high-resolution genomic screening of newly diagnosed patients. Leukemia. 2010;24(1): 211-215.
69. Kay NE, Eckel-Passow JE, Braggio E, et al. Progressive but previously untreated CLL patients with greater array CGH complexity exhibit a less durable response to chemo-immunotherapy. Cancer Genet Cytogenet. 2010;203(2):161-168.
70. Ouillette P, Collins R, Shakhan S, et al. Acquired genomic copy number aberrations
and survival in chronic lymphocytic leukemia. Blood. 2011;118(11):3051-3061.
71. Puiggros A, Puigdecanet E, Salido M, et al. Genomic arrays in chronic lymphocytic leu-kemia routine clinical practice: are we ready to substitute conventional cytogenetics and fluorescence in situ hybridization techniques? Leuk Lymphoma. 2013;54(5):986-995. 72. Schoumans J, Suela J, Hastings R, et al.
Guidelines for genomic array analysis in acquired haematological neoplastic dis-orders. Genes Chromosomes Cancer. 2016; 55(5):480-491.
73. Klintman J, Barmpouti K, Knight SJL, et al. Clinical-grade validation of whole genome sequencing reveals robust detection of low-frequency variants and copy number alterations in CLL. Br J Haematol. 2018;182(3):412-417. 74. Puente XS, Pinyol M, Quesada V, et al.
Whole-genome sequencing identifies recurrent
mutations in chronic lymphocytic leukaemia. Nature. 2011;475(7354):101-105.
75. Puente XS, Be `a S, Vald ´es-Mas R, et al. Non-coding recurrent mutations in chronic lym-phocytic leukaemia. Nature. 2015;526(7574): 519-524.
![Figure 2. Different biological profiles and clinical outcome among patients with CK (‡3 aberrations [abs]) depending on the number of chromosomal abnormalities](https://thumb-eu.123doks.com/thumbv2/123dokorg/4758953.47346/6.890.79.810.72.678/different-biological-profiles-clinical-aberrations-depending-chromosomal-abnormalities.webp)